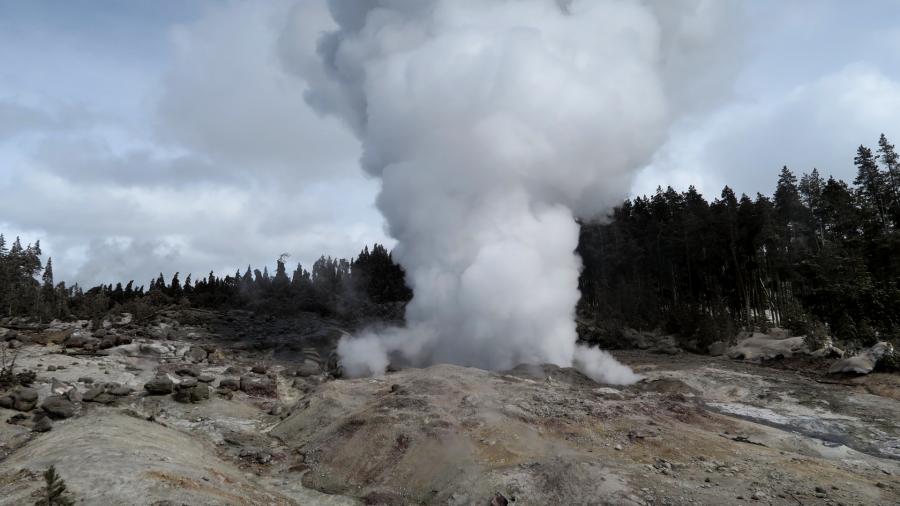
 Steamboat geyser is a very large geyser situated in the Norris Geyser Basin in the north section of Yellowstone National Park and Caldera. It has entered a very frequent water eruption phase since March 15, 2018, when its first eruption of 2018 occurred. It has erupted large amounts of super-heated water and blown rocks into the sky a total of 24 times so far this year, at the time of writing this. In this blog post we will take a quick and simple seismological look at Steamboat geyser and the seismic signals it creates.
Steamboat needs to erupt 6 more times to beat the record, or 5 more times to match the record, of 29 eruptions in one year. That year in question was 1964. Will she make it? PLEASE CLICK THE TITLE OF THIS POST OR "READ MORE" TO READ THE REST OF THIS BLOG POST! Image courtesy of USGS.
1 Comment
 Hey there again! I am briefly going to show the helicorders and seismogram/spectrogram analysis images for the two earthquakes that recently occurred at Yellowstone on October 21, 2018. These two earthquakes occurred in a very random spot. Usually we see the majority of larger earthquakes (M2.0 and above) occur either near the Maple Creek/Hebgen Lake area, the Norris area, or the northern tip of Yellowstone Lake and West Thumb lake. However today these two earthquakes appear to have occurred at the southern tip of Yellowstone lake, just 2.7 miles south-southwest of seismic station YTP. PLEASE CLICK THE TITLE OF THIS POST TO READ MORE!!!
 Hey there guys! In this blog post I am simply going to show some helicorders and seismogram/spectrogram analysis images of recent seismicity at Yellowstone caldera for 00:00UTC October 19, 2018 to about 21:10UTC October 20, 2018, since that is the time I am writing this. Remember, before Daylight savings time ends, 00:00UTC would be 5:00pm (17:00) Pacific Time. After daylight savings time ends, in about 2 weeks or so, 00:00UTC will then be 4:00pm (16:00) Pacific Time. I know it sounds confusing but it is really easy to figure out!
With all the hydrothermal changes still occurring at Yellowstone, it is surprising seismicity has remained low. It has been low in regards to what we should see during hydrothermal changes. Nevertheless I am still sticking to my theory that a major earthquake swarm still could be approaching. Please monitor this area with me! PLEASE CLICK THE TITLE OF THIS PAGE OR CLICK "READ MORE" TO READ THE REST OF THIS POST! Hey guys sorry I haven't been doing many blog posts lately! I know probably almost nobody reads my blog posts, since my website here gets very low views, but I still like to post stuff that interests me. I have been doing more YouTube videos lately than blog posts. Of course this website contains alot of information already that has nothing to do with my blog. I am looking for new suggestions for new pages to add to this website so please feel free to email me or comment below (if the comment box is working).
Texas felt a magnitude 4.0 earthquake today at 5.3km in depth just 15km NNE of Amarillo, Texas. The two images directly below show the basic information provided by USGS and the location of this earthquake. As of the time I am writing this over 1,055 people have REPORTED feeling this quake. That means many more actually felt it since not everybody reports to the USGS. PLEASE CLICK THE TITLE OF THIS ARTICLE OR CLICK "READ MORE" TO READ THE REST OF THIS POST! Yellowstone & Long Valley Supervolcanoes See Increase in Seismicity: In-Depth Seismological Look10/20/2018 Parts:
00:01 – Introduction 01:41 – Long Valley station locations 02:02 – Long Valley quakes analyzed in WAVES 03:50 – Long Valley quakes analyzed in SWARM 09:10 – Recent quakes at Yellowstone 10:46 – Seismogram/Spectrogram of largest event in Montana 12:27 – West Thumb, Yellowstone rapid fire swarm in WAVES 16:24 – West Thumb, Yellowstone rapid fire swarm in SWARM 18:35 – Other recent quakes at Yelly analyzed in SWARM 22:02 – Investigate this strange seismic event with me! 31:49 - Conclusion Parts:
00:01 – Intro 01:08 – About Mt Veniaminof 03:18 – Veniaminof on Google Earth 07:07 – Latest seismicity near Veniaminof 07:52 – Seismogram/Spectrogram of that large M5.0 quake 08:18 – Recent AVO Veniaminof update 11:27 – Seismological analysis of harmonic tremor using SWARM 20:09 – Current volcano alert level 22:15 – Past 24 hours of seismic data 26:29 – 1st audio/seismogram/spectrogram of harmonic tremor 28:04 – 2nd audio/seismogram/spectrogram of harmonic tremor Parts:
00:01 – Introduction 02:33 – Yellowstone seismicity 05:10 – Steamboat Geyser activity 06:11 – Largest quake at Yelly for September (Analysis image included) 07:08 – Recent Yellowstone GPS charts 09:37 – Recent Tilt charts B208 12:12 – New seismic station at Yelly!!! YDD 12:49 – Long Valley seismicity 13:54 – Analysis image of largest event 14:21 – Long Valley GPS deformation charts 18:32 – Newberry Caldera seismicity 19:19 – Analysis image of largest event 19:50 – Newberry GPS charts 21:49 – Mt Rainier seismicity 23:58 – Analysis image of largest event 24:21 – Rainier GPS data 26:28 – St Helens seismicity 27:22 – Analysis image largest event 27:54 – Helens recent GPS data 28:57 – Mt. Hood seismicity 29:22 – Analysis image plus bonus image 30:27 – Hood GPS data 31:55 – Mt Shasta seismicity 32:23 – Analysis image 32:55 – Shasta GPS data 33:45 – Lassen Peak seismicity 34:18 – Analysis image 34:55 – Lassen GPS data 37:32 – Images of 1915 Lassen eruption 38:18 - Conclusion  September 24, 2018 Mt. Hood Event Seismogram/Spectrogram Analysis: UW_VLL_--_EHZ To start, if you have not seen the original article about the event I am going to be talking about then please CLICK HERE. This post here will not make much sense unless you read the original.
On September 24, 2018 a very strange event occurred at Mt. Hood. It originally was listed as an earthquake. The earthquake in question was analyzed and its characteristics indicated a long period, low frequency earthquake possibly indicative of magmatically derived volcanic gas "farting" its way up to the surface. The earthquake occurred just 15 miles west of Mt. Hood's summit. It was very peculiar but there is now an update! This event has now been marked as an "explosion" by PNSN and USGS. The event type changed, but the depth changed from 5.3km in depth to 5.1km in depth. Only a 0.2km depth differential! How can an explosion occur at around 5km underground if related to quarry/mine activity? We will assess the data provided and you be the judge. It was a very odd event! Please click the title of this post or "read more". 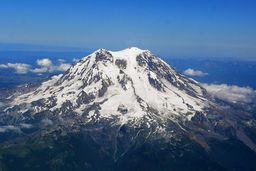 STOP! First, if you have not seen the original blog post about these peculiar events please CLICK HERE or simply backspace and find the blog post with close to the same title as this post here. Most of the information will be in the first blog post. This is just a continuation of that post with additional data for September 24-25. Please click "read more" below.
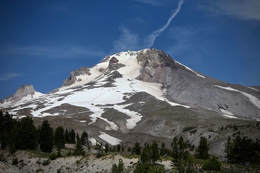 Things are usually quiet near Oregon's version of Mount Rainier, Mount Hood. However today, September 24, 2018, something seems to have changed. A low frequency earthquake appeared near Mount Hood. Yes, you saw that correctly! A low frequency earthquake, possibly indicative of being involved with magma or magmatically derived volcanic gas, has occurred just 15 miles west of Mount Hood's summit. This is not something that is questionable. This really was a low frequency event. So what does this mean? Well this seems to have been an isolated incident, so far, and seismicity remains at low levels. But if swarms start to break out, it is probably a good idea to stay away and monitor the area. I am not saying an eruption is coming! Just that this was not glacier or tectonic activity and extremely likely to be involved with magma in some way due to the characteristics of the event. Could this be a sign that something is changing or is all as it should be? Of course low frequency events do occur from time to time at volcanoes worldwide, many times without eruptions occurring or being in danger of occurring, but it is always a good idea to pay attention to anything caused by magma. Please click this post title or "read more" to read more.
 Hey guys! Some interesting stuff is happening. Nothing major, but interesting nonetheless. Ever since the small shallow earthquake swarm occurred at Mt. Rainier on September 19, there have been some interesting seismic events occurring. They are not that large with the largest event of September 23-24 being about the size of a magnitude 1.0 earthquake or so. Please click the title of this post or "read more" to read more. Data will be included of the events in question. Helicorders (the chart on which seismograms reside) of seismic stations RER, RCS, and OBSR will be shown as well.
 The image above shows the location of the magnitude 2.1 earthquake that struck South Carolina at 6.2km in depth at 7:47UTC on September 22, 2018. This area is not known to be seismically active, but they still do occur. I believe right when Hurricane Florence was hitting this area, an earthquake of similar depth and size occurred. This earthquake was very weird and had a hard time showing up on local seismographs. The closest seismic station I could find data for was SUMMV CO which appears to be about 25 miles away or so. Below is the seismogram/spectrogram analysis of this event along with the helicorders of the two closest seismic stations. You can tell it barely showed. Nevertheless, it is a very interesting event! 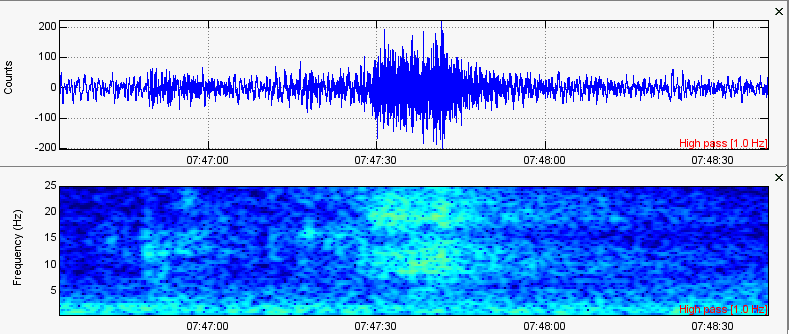 Seismogram/spectrogram from SUMMV_HHZ_CO_00 of this M2.1. 1HZ High-Pass filter added. 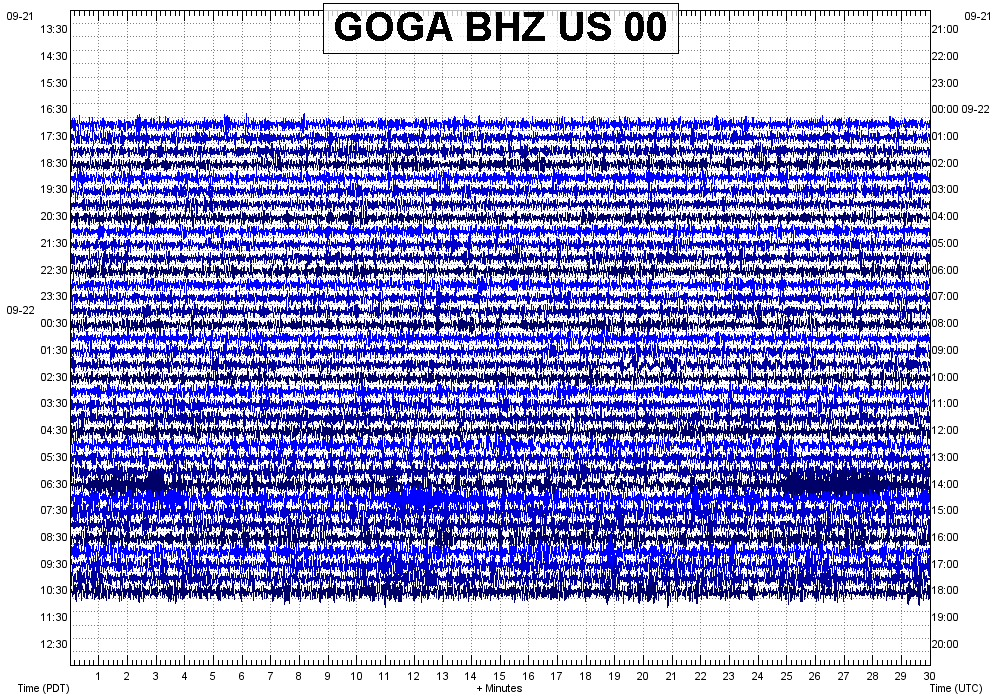 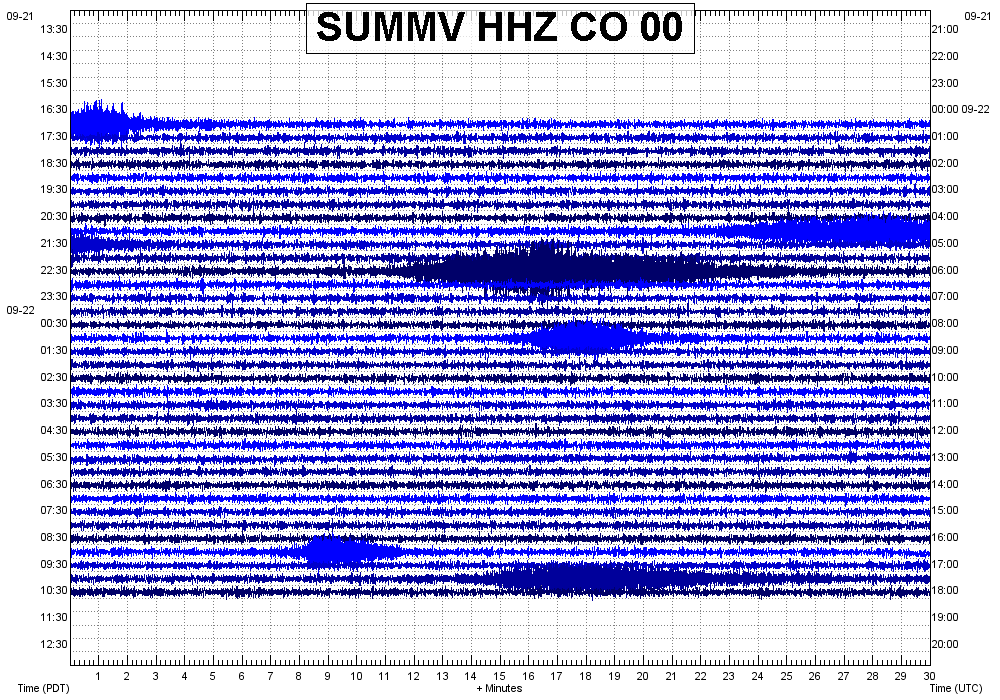 On September 19, 2018 a fast paced but short lived earthquake swarm occurred at Mt. Rainier, inside the strato-cone itself. The origin could be related to the steam vents just inside the cone. Regardless of cause, this swarm was definitely very interesting! A very peculiar signal was also spotted just after the swarm that almost looks like a type of DLP (deep long period) event. Please watch the video below. To see the description box of this video or join in on comments on YouTube, please CLICK HERE to goto the original video on YT. 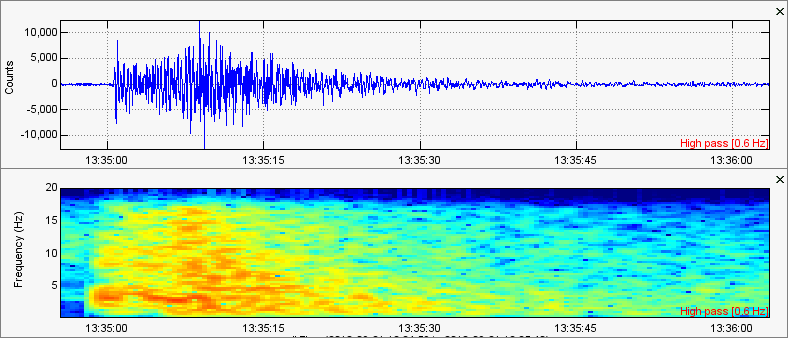 This M3.2 earthquake was the largest in the swarm. Taken from AHID BHZ. On September 21, 2018 A short lived earthquake swarm broke out near Montpelier and Soda Springs, Idaho. This location is near the epicenter of the massive late-2017 Soda Springs earthquake swarm which I have always theorized to be related to magma in some way. I mean the magnitudes were off the charts! At its peak, multiple 3.0s and 4.0s shook the area frightening all those that live in the area. We will real quick look at today's swarm and show some data. Please click "read more".
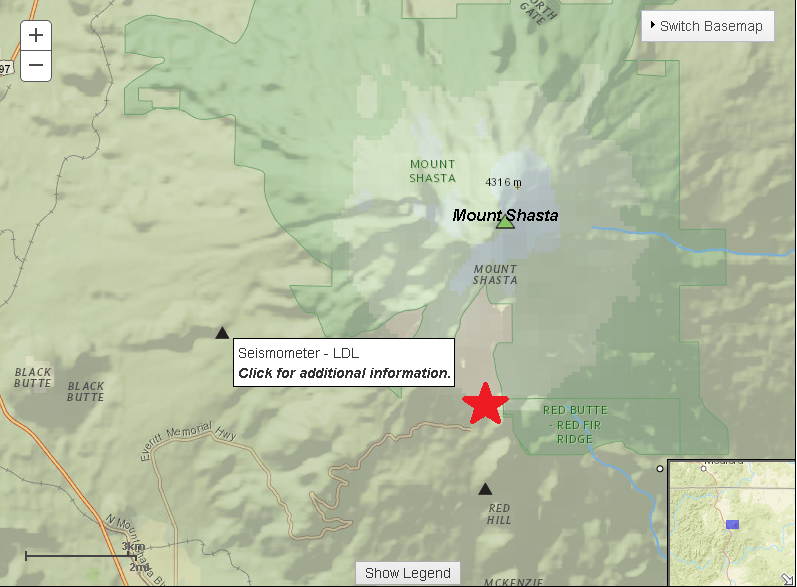 On September 21, 2018 at 20:14UTC a magnitude 2.1 earthquake at 3.2km in depth struck directly beneath the southern base of Mount Shasta in Northern California. Seismicity over the past few years has been low so this could just be an isolated incident. Nevertheless, whenever seismic changes occur at volcanoes it is probably a good idea to monitor the area anyway. 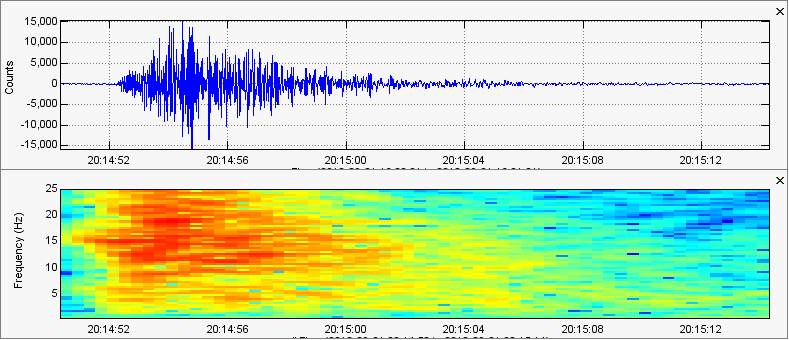 The seismogram/spectrogram shown above is from seismic station LDL_HHZ_NC_01 and is of the magnitude 2.1 earthquake that occurred today at Mount Shasta. In the first image in this post, you can see the location of seismic station LDL. You can see blatant high frequency characteristics indicative of normal volcano-tectonic earthquakes that are seen at volcanoes worldwide. No sign of volcanic activity as of yet but still should be monitored just in case. If anything changes, I will let you know. The helicorder below is from station LDL and shows the earthquake near the bottom. Have a good day! 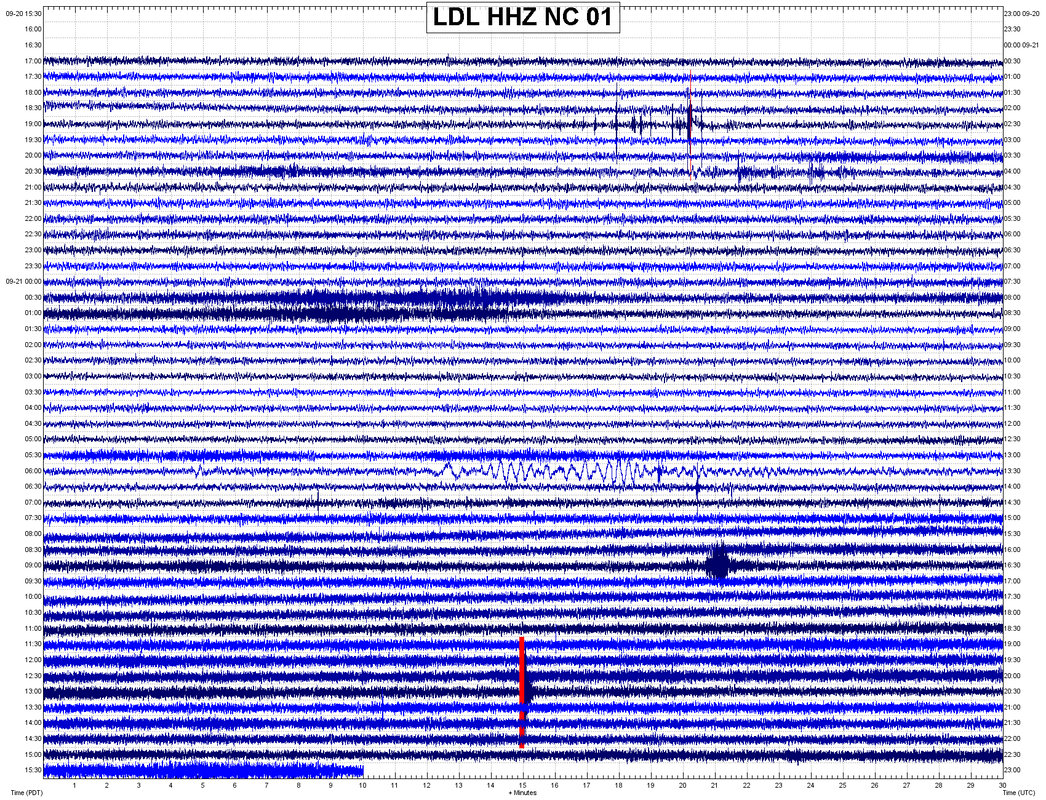 |
AuthorBen Ferraiuolo is a fast learner and someone who will always stand for the truth. Visit "About Me" for more! Archives
November 2019
Categories |
 RSS Feed