GPS instruments are becoming widely used for monitoring both volcanic and tectonic hazard areas. GPS instruments are simple in that they detect the way the ground is shifting over a long period of time. Usually a reading, better known as a sample, is taken once per day. These instruments are usually quite accurate down to 1 millimeter.
The purpose of this page is to help you understand the GPS charts on volcanoes.usgs.gov, including many other websites, and to help you find actual GPS data to create your own GPS deformation charts for any time period you wish! Deformation simply means the way the ground is shifting over a period of time. The reason for this page and subsequent video is because the online GPS charts show a very long time frame. Now don't get me wrong, the online GPS deformation charts are great for seeing deformation over many years or decades. However, if you wish to see tiny changes in the earth over a much shorter time frame, for example one year or 3 months, then I highly suggest creating your own charts. It may sound difficult, but it is actually quite easy! If you are already used to downloading seismic data and analyzing it, then downloading and analyzing GPS data should be very easy to learn.
Below is an image of the 3 separate plots shown on http://geodesy.unr.edu/NGLStationPages/gpsnetmap/GPSNetMap.html for station OFW2 (Mallard Lake Resurgent Dome, Yellowstone):
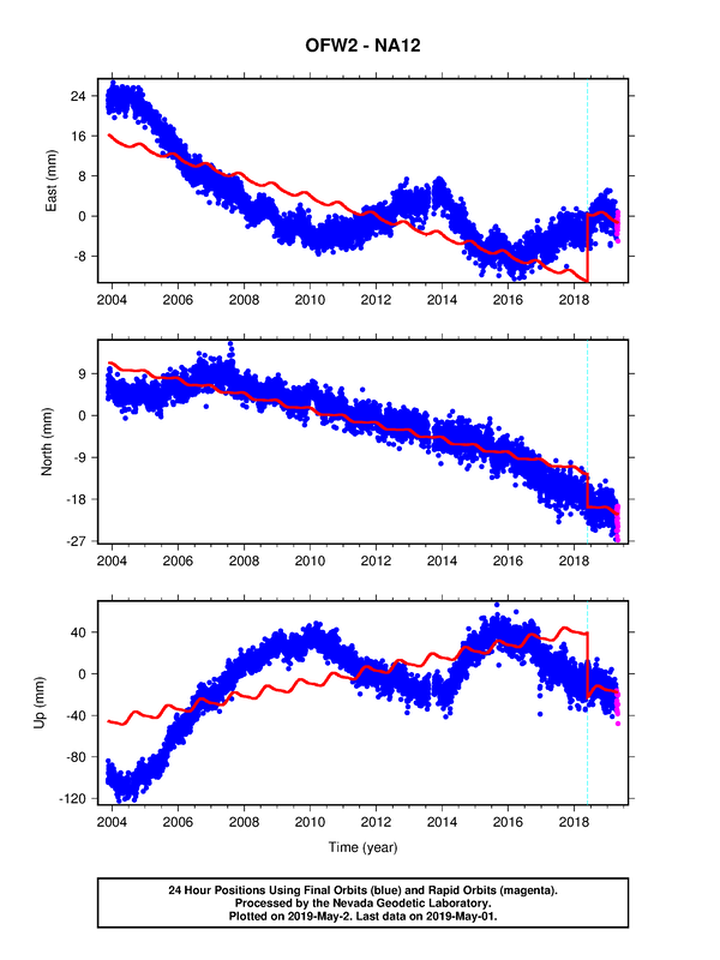
First off, you must always read chart labels otherwise you could get deceived very easily! Remember, when dealing with meters or millimeters as labeled on the left of any GPS plot, 0.05 meters is 50 millimeters. You simply move the decimal over to the right 3 times to discover the millimeter of any meter. Notice the chart above looks like a solid line, right? Well it is not. The line is made up of dots. Each dot is a sample and each sample is taken once per day. Note there are 3 things to always keep in mind:
-E or East records east-west horizontal ground deformation.
-N or North records north-south horizontal deformation.
-U or Up records vertical deformation (in other words, uplift or subsidence).
-1,000 millimeters = 1 meter.
-ALWAYS READ CHART LABELS!
Below is the video that will help get you started. I suggest doing the things I do in the video while following along. I hope you enjoy these new possibilities to monitor volcanic hazard areas for possible eruptions!
Please CLICK HERE if you would rather view the video on my YouTube channel.
Parts:
00:01 – Intro/About GPS deformation monitoring
08:12 – UNR map to find stations and GPS plots (use this map to find station names for download)
12:26 – How to understand GPS plots
14:44 – How they used to detect deformation
15:29 – UNAVCO data download webservice
18:07 – Opening the data in Microsoft Excel/Explaining data
19:29 – Creating your own GPS plots
25:29 – How to label your plots
28:46 - Conclusion
Resources you need in order to do what I did in the video:
Microsoft Paint (or Photoshop if you wish)
Microsoft Excel (the newer the version, the better)
About GPS/GNSS monitoring: https://www.unavco.org/instrumentation/geophysical/gps-gnss/gps-gnss.html
IMPORTANT: UNR Station Map: http://geodesy.unr.edu/NGLStationPages/gpsnetmap/GPSNetMap.html
IMPORTANT: UNAVCO webservice: https://www.unavco.org/data/web-services/documentation/documentation.html#!/gps/getPositionByStationId
Old way scientists used to monitor deformation: https://earthquake.usgs.gov/monitoring/deformation/edm/