Did you know whale calls are detectable via seismic data from underwater seismometers? If not, check this out! Seismic audio of each whale call example is included.
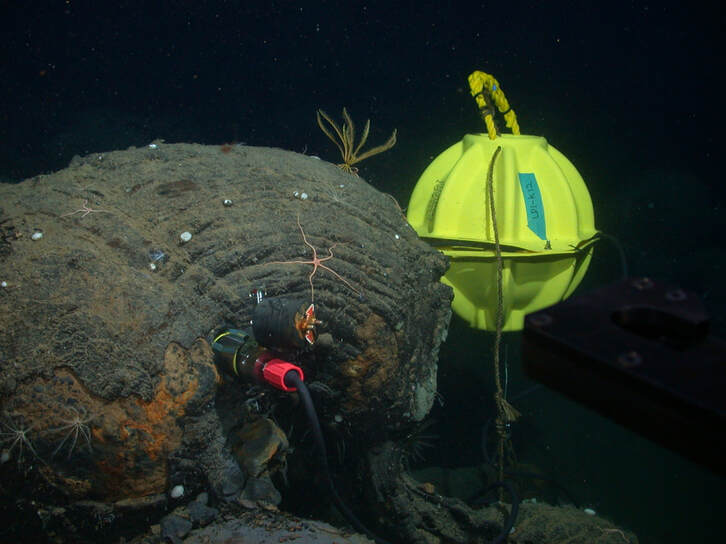
A seismometer drilled into hardened lava underneath the ocean. A data recorder is held within the yellow sphere. Image credit: John Delaney and Deborah Kelley, UW
Longer than a decade ago, scientists decided to start preparations for the creation of a large underwater seismic observatory off the coast of Washington and Oregon states. This observatory would monitor for undersea earthquakes, potential submarine volcanic eruptions, and any geological changes that could take place, whether it affects man on shore or not. This observatory still does not seem to be complete, but there are already numerous submarine seismic stations available for data download through the typical IRIS database.
Much to the surprise of some seismologists, there were some very strange “pings” in a rhythmic formation which saturated data obtained from these submarine seismometers. Come to find out, these rhythmic beats were the recorded acoustics from nearby whale populations, likely fin whales.
Remember, audio is simply a vibration. There are no microphones attached to the seismometer itself, however the vibrations are strong enough to be detected and can then be used to research fin whale communication. The Journal of the Acoustical Society of America calls for seismic data to be used as a non-invasive form of monitoring whale populations and their poorly understood migration patterns.
According to investigator William Willock, “Over the winter months we recorded a lot of earthquakes, but we also had an awful lot of fin-whale calls.” He went on to state that the fin whale calls, at least to the seismologists, “were kind of just a nuisance.” Please CLICK HERE to read more from the official University of Washington article.
Well, oceanographers are now using seismometers to track whale populations, most notably fin whales which make up the majority of recent whale calls, some of which will be shown in this post here. They occur primarily ever 20-25 seconds episodically, but can vary.
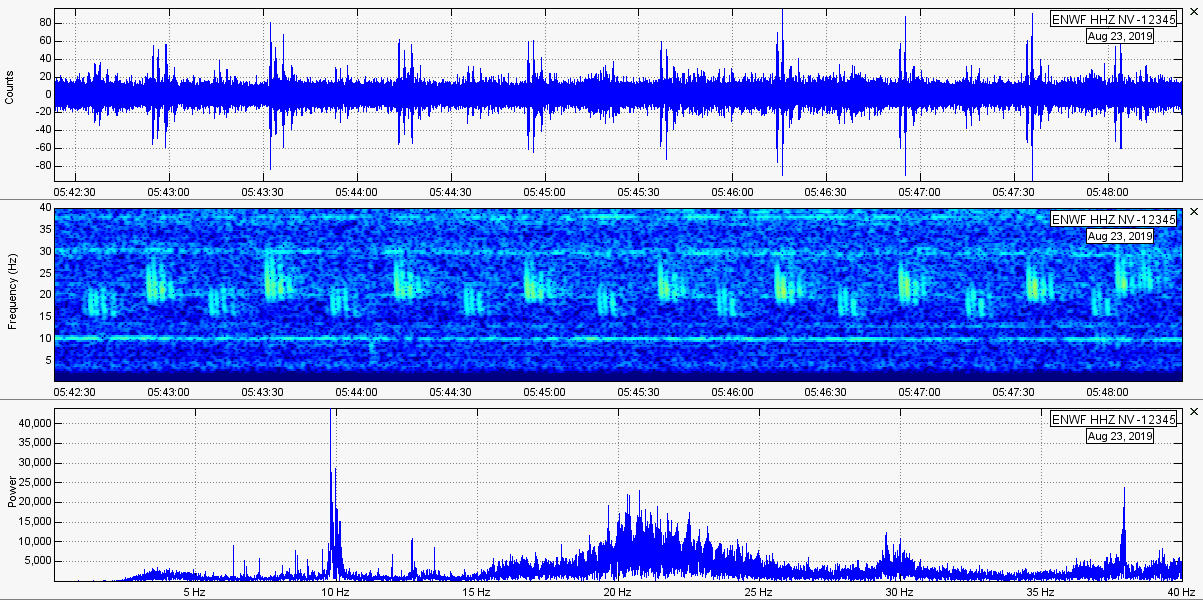
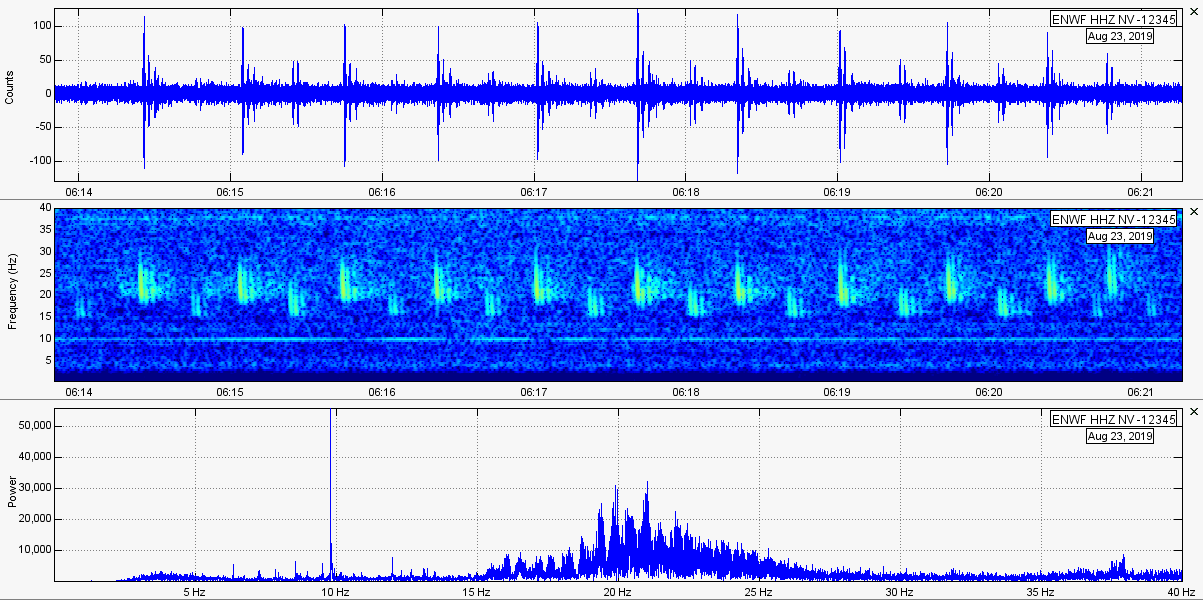
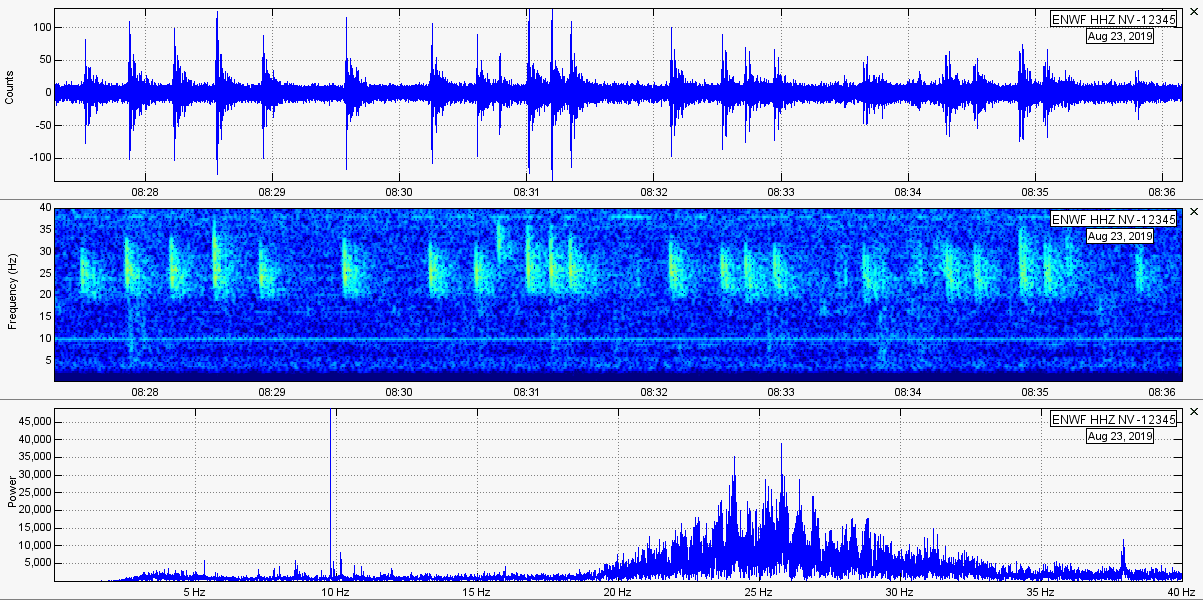
There are two different types of whales calls that are spotted. There are the typical singlet calling patterns and also the doublet calling pattern. You can see this via the spectrogram plots directly below this text.
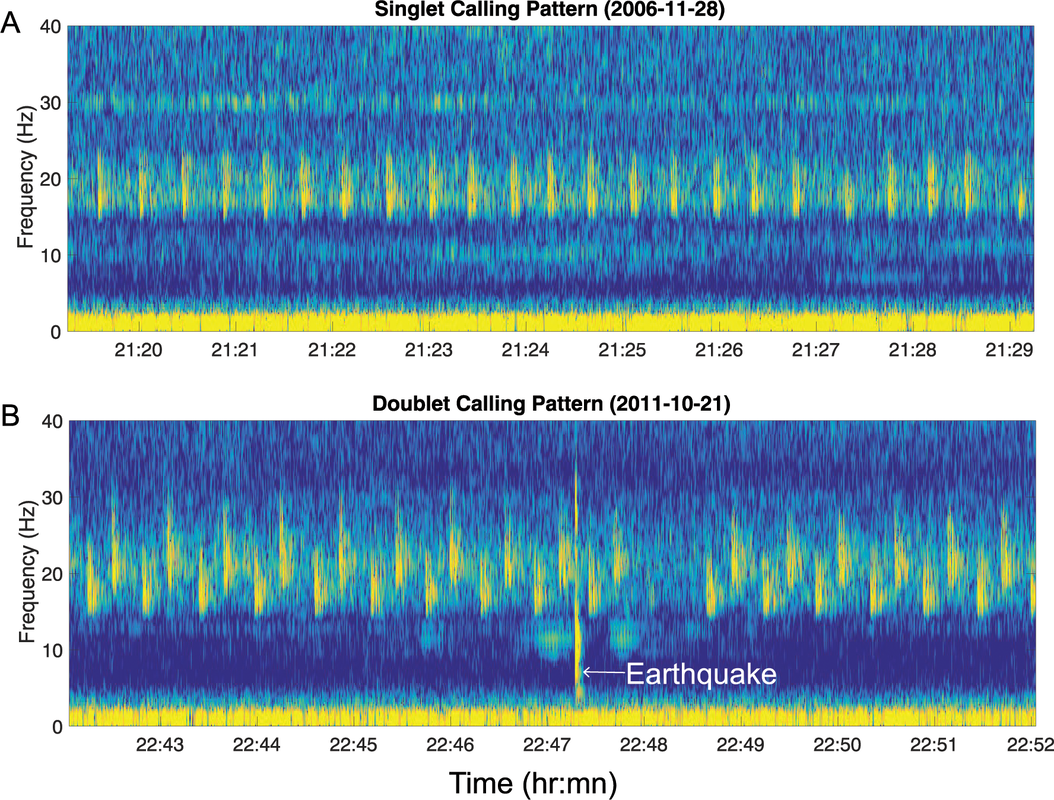
CLICK HERE to visit the publication where I obtained those spectrogram plots.
Let’s quickly talk about the doublet pattern. They occur usually with a lower beat and then a higher beat, over and over in rhythmic succession. Since this is of course a living creature communicating, this of course varies and can change dramatically.
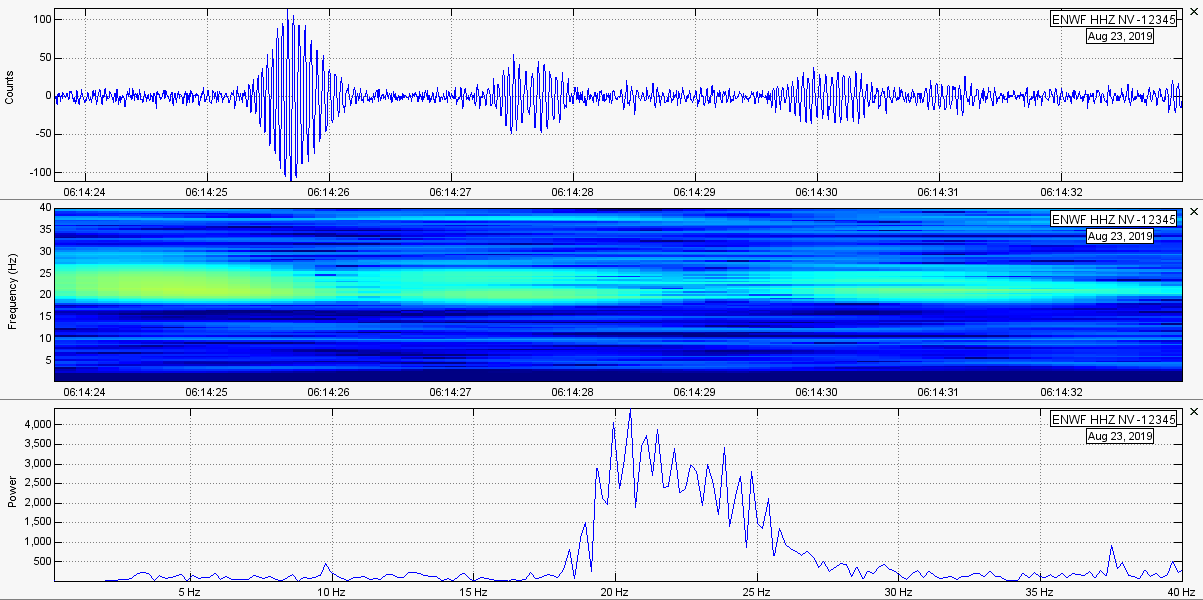
The lower frequency beat, within the doublet pattern, starts at about 15Hz and ends at about 22Hz. The high frequency beat, within the same doublet pattern, starts at about 19Hz and ends at about 28Hz. Take a look at the spectrogram plot below, which was generated by yours truly. Note the blatant rhythm of the doublet pattern? This is likely a single fin whale. If multiple fin whales start talking, it would likely appear the same but much busier.
Let’s quickly talk about the doublet pattern. They occur usually with a lower beat and then a higher beat, over and over in rhythmic succession. Since this is of course a living creature communicating, this of course varies and can change dramatically.
The lower frequency beat, within the doublet pattern, starts at about 15Hz and ends at about 22Hz. The high frequency beat, within the same doublet pattern, starts at about 19Hz and ends at about 28Hz. Take a look at the spectrogram plot below, which was generated by yours truly. Note the blatant rhythm of the doublet pattern? This is likely a single fin whale. If multiple fin whales start talking, it would likely appear the same but much busier.
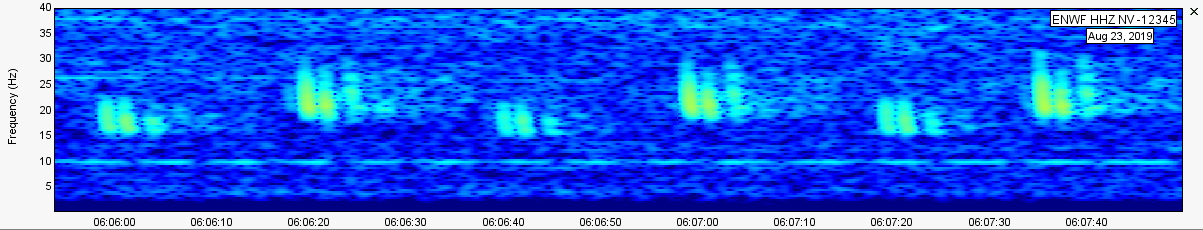
Filter: 4Hz High Pass
On this page I will show some quick data pertaining to these whale calls. When I found out that this was possible I was very intrigued. Below is the waveform and frequency content of a single whale call. This was part of a doublet pattern and is the higher frequency call.
Filter: 4Hz High Pass
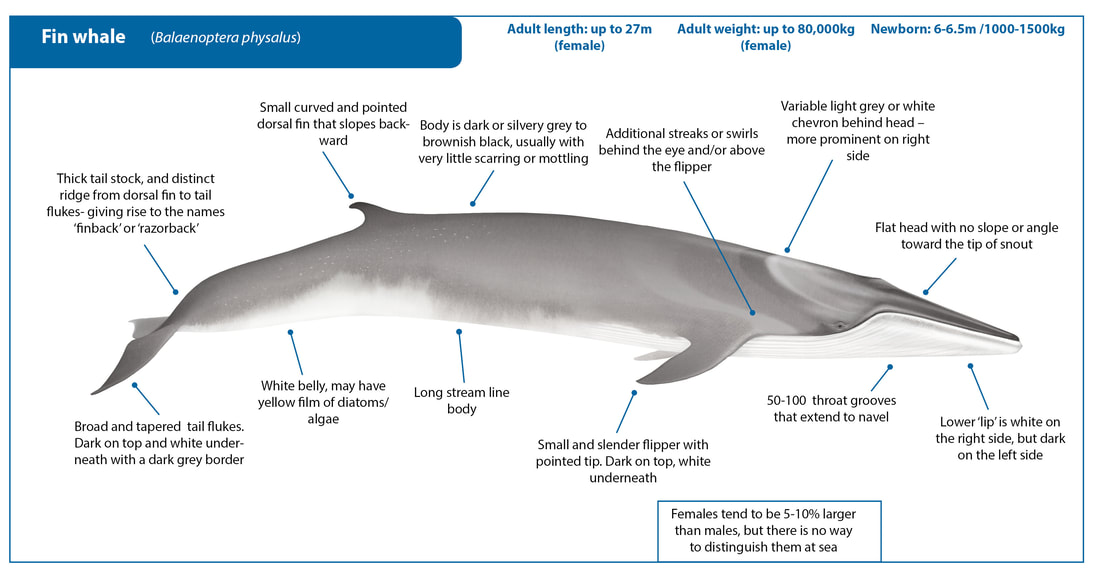
Fin Whale
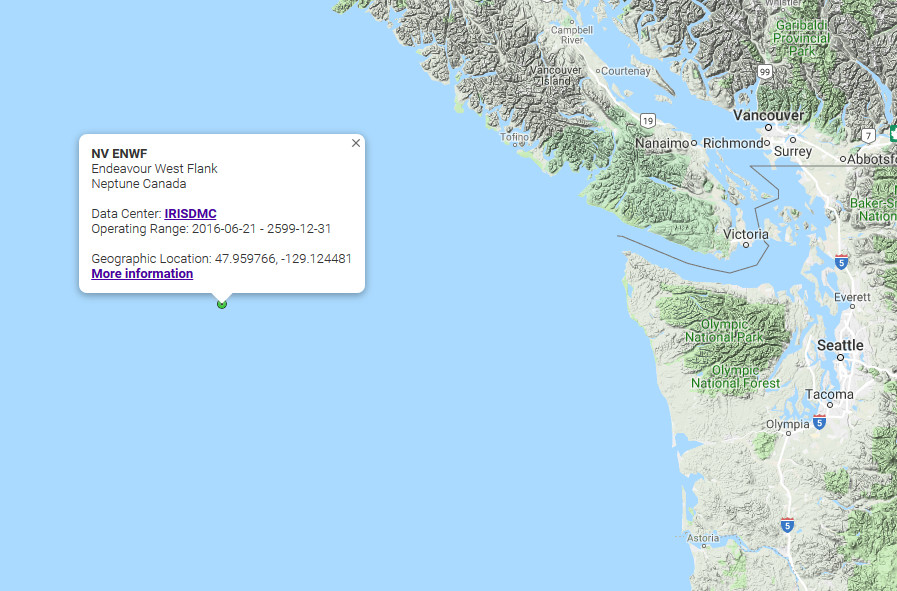
On this page data will be shown from seismic station ENWF in the NV network, a broadband station on the ocean floor off the coast of Vancouver Island and Washington State. The location of this station can be shown via the image below, or you could just CLICK HERE to visit the IRIS Gmap showing the location of every station in the NV network.
The NV network is held by Neptune Canada, an organization of oceanographers.
So, how is it possible that an instrument that detects vibrations can detect the calls of whales? First off, it is because audio itself is simply a vibration with varying frequencies. Also, according to Michelle Weirathmueller, an oceanographer with the UW, the calls are consistent at 190 decibels, which would be 130 decibels in the air. 130 decibels is around the loudness of a jet engine!!!
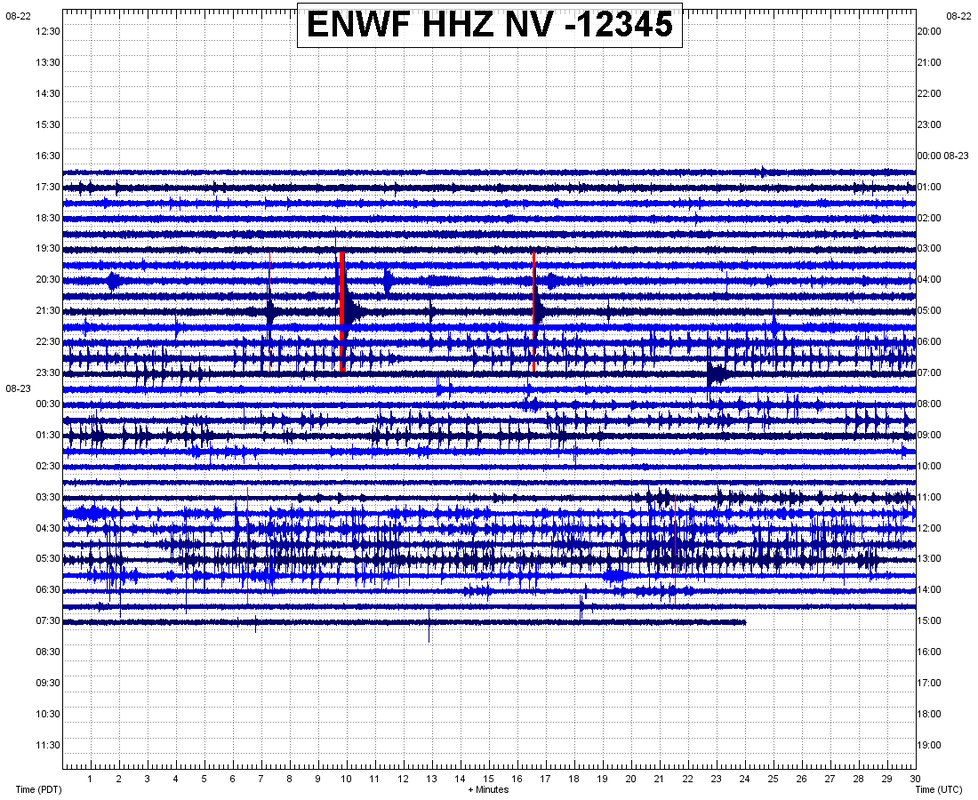
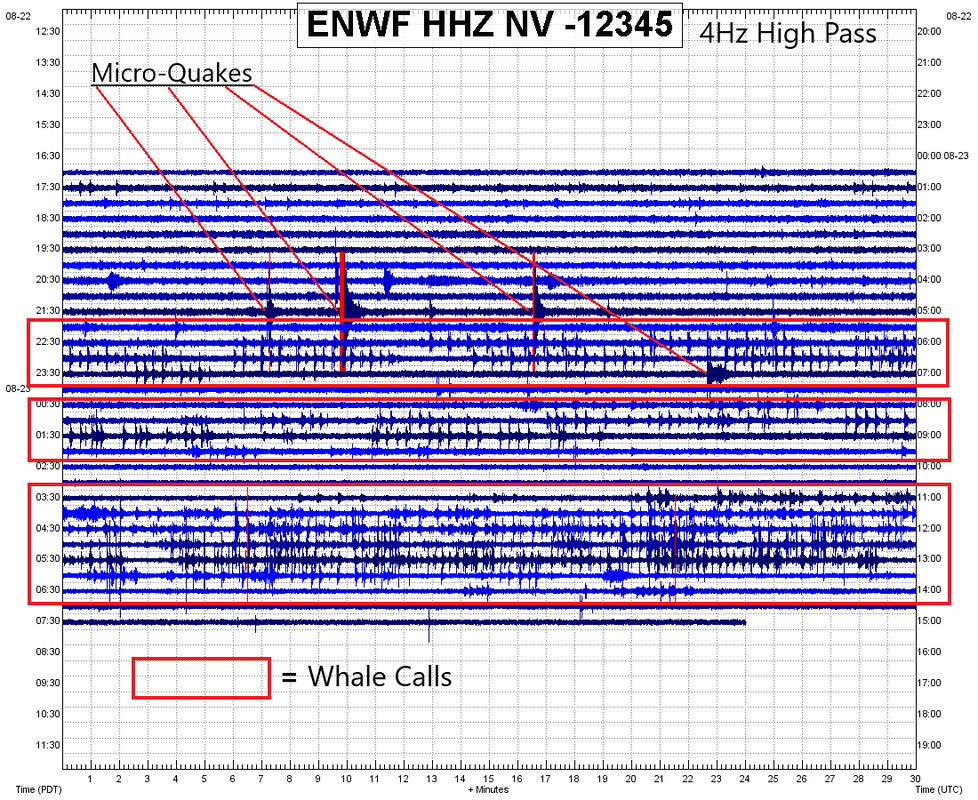
In the image below you can see a helicorder plot containing half of the data for August 23, 2019. There were a few earthquakes detected on this day, likely smaller than M2.5. However, almost everything else you see are whale calls!
Helicorder filtered through IRIS Time Series using a 4Hz high pass filter.
Helicorder filtered through IRIS Time Series using a 4Hz high pass filter.
At the end of this page I will show audio for this entire day. However, directly below I will show 3 random whale call episodes along with the audio so you can actually hear the whales themselves! This is likely only one whale talking. The first two whale calls are the doublet patterns and the last whale call is considered the singlet pattern. All audio is compressed (sped up) so it is easier for humans to hear. Both the plots and the audio contain a 4Hz high pass filter to filter out any oceanic microseisms or possible volcanic tremor.
I suggest using headphones, but be wary of the volume just in case!
I suggest using headphones, but be wary of the volume just in case!
Also, for those interested in seeing the earthquakes that were detected during this day, you can check out the plots below which are in slideshow format.
If you wish to hear the audio of this entire data period, from 00:00UTC to 14:54UTC on August 23, 2019, you may listen to the audio below. It is a total of 14 hours and 54 minutes of seismic audio compressed into 24 minutes and 29 seconds. I suggest using headphones for this.