2018
Steamboat Geyser is one of the world's largest hydrothermal geysers. Currently Steamboat Geyser is the largest active geyser on the entire planet. It produces some of the largest, tallest, and longest hydrothermal eruptions known to man. It resides in the Norris Geyser Basin at the infamous super-volcano: Yellowstone National Park and Caldera. This page will show the helicorders, along with the seismogram/spectrogram/spectral plots, of every Steamboat hydrothermal eruption since it started in the early morning hours of March 15, 2018. It has been dormant for some time but miraculously sprang to life. The record used to be 29 eruptions in one year, which occurred in 1964. Then, on December 8, 2018, Steamboat Geyser officially beat the all-time record with 32 eruptions for 2018. Then, on August 27, 2019, Steamboat Geyser blew that record out of the water. 2019 now holds the highest count of eruptions within 1 year with a grand total of 48 eruptions for 2019. Don't forget to stay up to date with the official 2020 Steamboat page here on my website! I will try my best to update within a few hours of every Steamboat eruption.
Now I have talked about Steamboat Geyser many times on my YouTube channel and "Seismo-Blog". I have shown numerous amounts of data pertaining to these eruptions. The seismic traces you are about to see, using many different types of data sets, are the surface vibrations from these events. If you would like to see the reasons why, please click the button above. Therefore, since the seismic stations detect the surface vibrations, you can compare the amplitude count, the "count" on the left hand side of any seismogram plot, and understand which eruptions were larger, in terms of amplitude (strength), than others. Please enjoy!
This page is for 2018 only! Please visit the 2020 Steamboat page to see the most recent Steamboat eruptions. I will post them in order from the oldest (March 15, 2018 eruption), at the bottom of the page, to the newest, here at the top of the page. Every time Steamboat erupts I will add the helicorder and plots from YNM, the station closest to Steamboat geyser. If you need any other data, please let me know and please check back here from time to time.
Since YNM (WY_YNM_01_HHZ) detects these eruptions best, I will use that seismic station. Remember, as always, you must read chart labels FIRST before you read the data. Time period is especially crucial when analyzing seismogram or spectrogram plots. If you keep the size of a chart the same but increase the amount of data shown within that chart, then less detail will be shown. That is how it goes with every plot (well except spectral plots since they do not show time period).
HEADS UP! Since some of you may be comparing the amplitude count (strength) on the seismogram plots for the eruptions, there is something you might notice that confuses you. Notice how on some of the seismogram plots the amplitude count reaches 1e5 or 1.5e5? Well what does that mean? It is simple. 1e5 is a 1 followed by 5 zeroes (100,000). So 1e5 would be 100,000 amplitude count. 2e5 would be 200,000 amplitude count and 3e5 would be 300,000 amplitude count. Some traces around the world for strong quakes have shown 5e8, in other words a 5 followed by 8 zeroes (500,000,000 amplitude count). Now you may notice 1.5e5. That is simply 150,000 amplitude count. Whenever you see 1.5e5 that would be 15 followed by 4 zeroes, which would be 150,000 amplitude count. It may be a little confusing but pretty much all you need to know is 1e5=100,000 and 1.5e5=150,000. All of the following plots and helicorders were generated by me using only SWARM and the IRIS seismic archive.
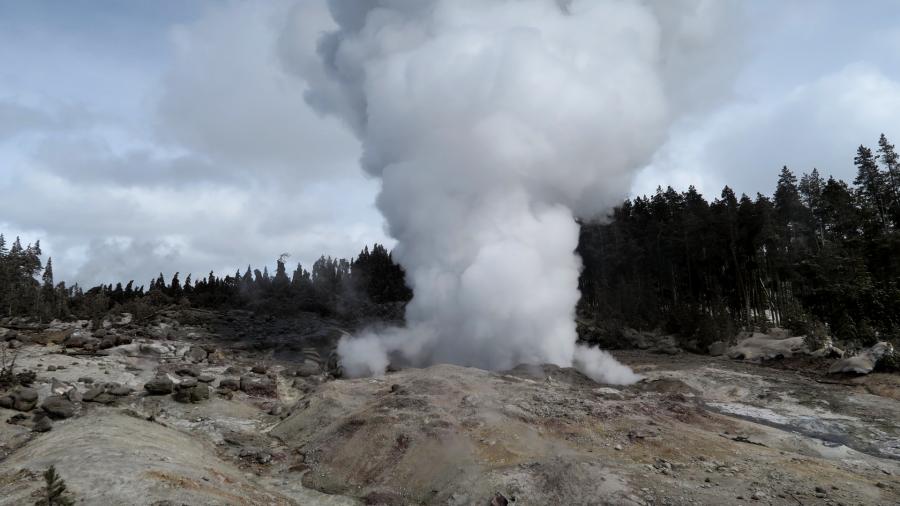
Steamboat geyser in the steam phase of eruption on March 16, 2018, just a day after the first water (hydrothermal) eruption of 2018. Photo taken by Behnaz Hosseini.
As of the 32nd eruption, the strongest eruptions were the 13th and 18th eruptions of 2018. 2019 has officially beaten the 2018 record.
32nd eruption of 2018 occurred at 6:21UTC December 26, 2018 (11:21pm MST December 25, 2018) (Most likely last eruption of 2018, Merry Christmas!)
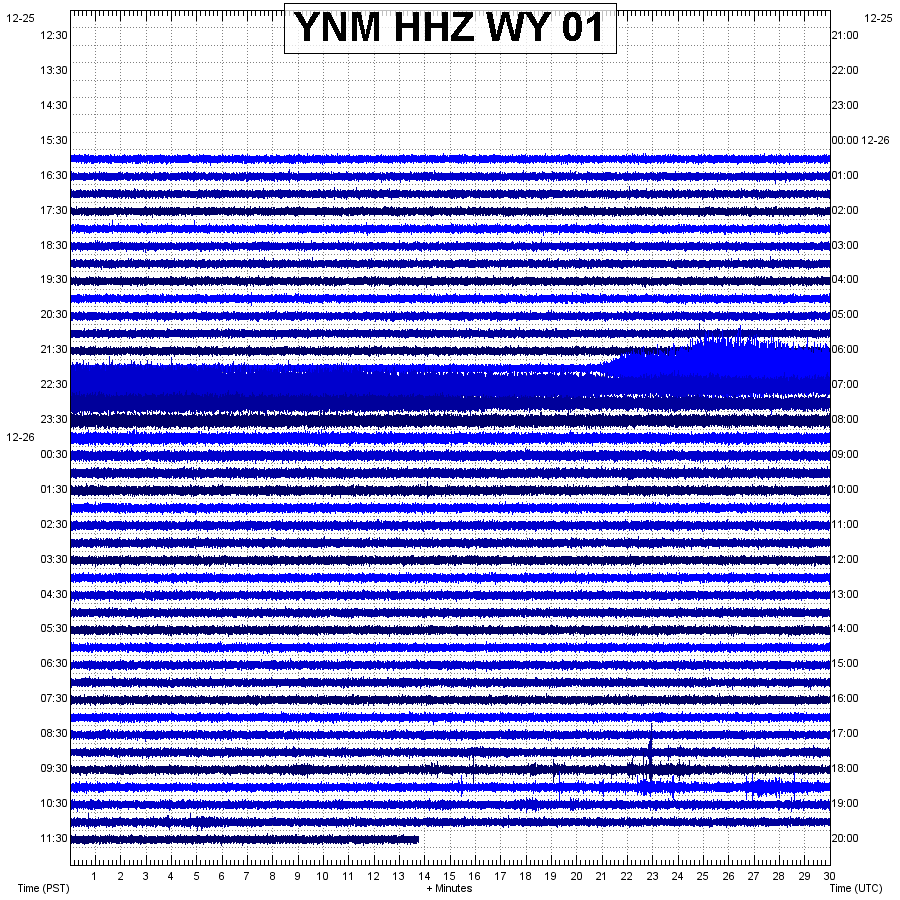
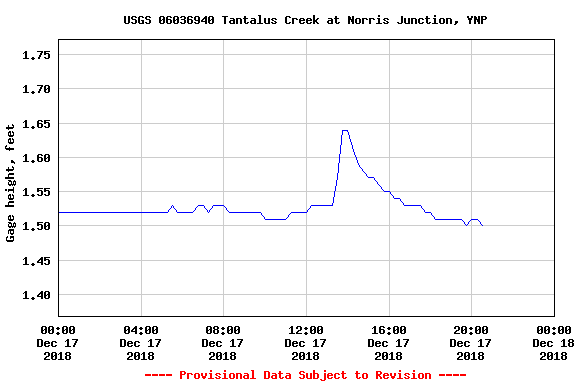
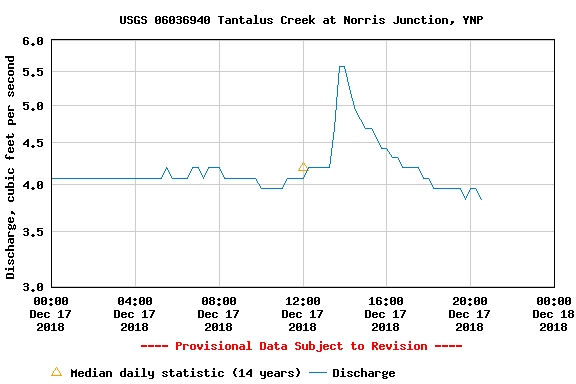
31st eruption of 2018 occurred at about 19:30UTC December 17, 2018 (12:30pm MST December 17, 2018) Please note that the plots below for this one eruption are NOT seismic plots. YNM has been offline for a few days and has missed the 31st eruption. This eruption was confirmed by YVO using water and temperature data so the 31st eruption did occur. Below are the stream gauge plots for the Tantalus Creek station. Everytime Steamboat erupts there is a very large spike. Note how on the larger charts the Steamboat eruptions look near-vertical. The first two plots show the 31st, 30th, and 29th eruptions and the last two plots show only the 31st eruption in a one day time frame. Please click on an image to enlarge it.

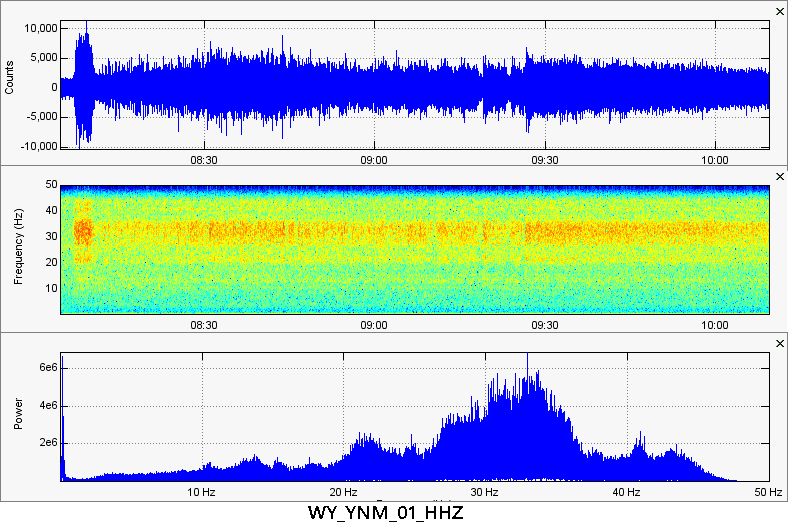
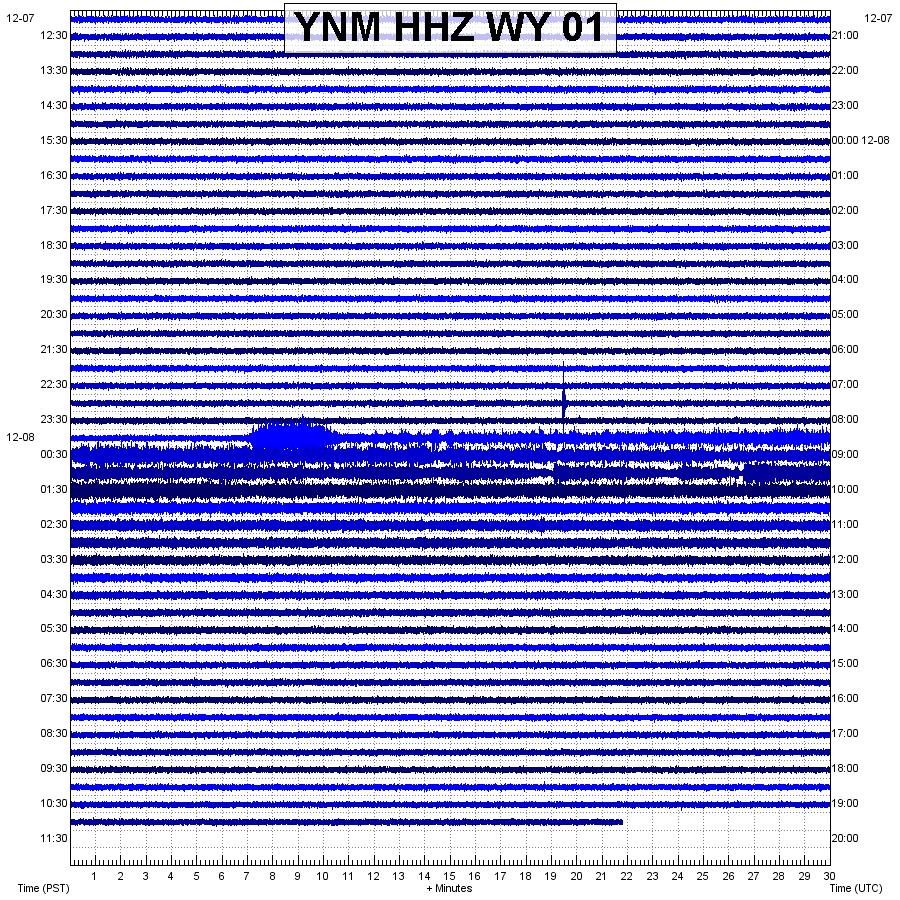
30th eruption of 2018 occurred at 8:07UTC December 8, 2018 (1:07am MST December 8, 2018) (THIS ERUPTION BROKE THE ALL-TIME RECORD WHICH WAS SET BACK IN 1964!!!):
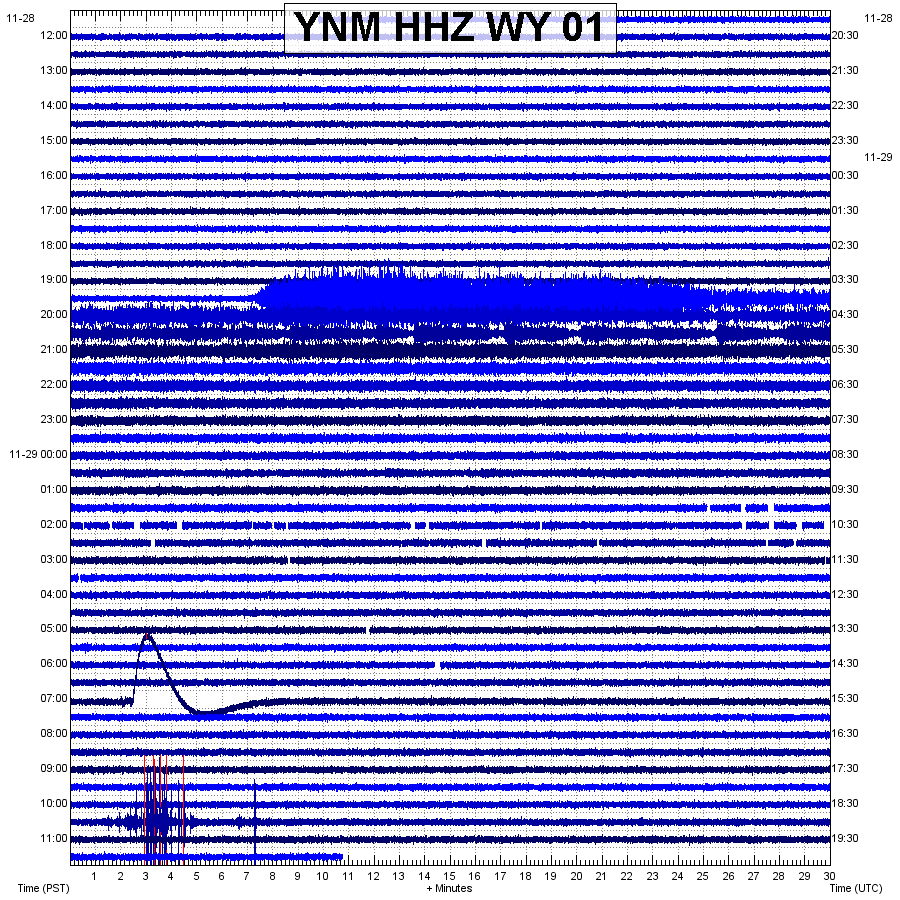
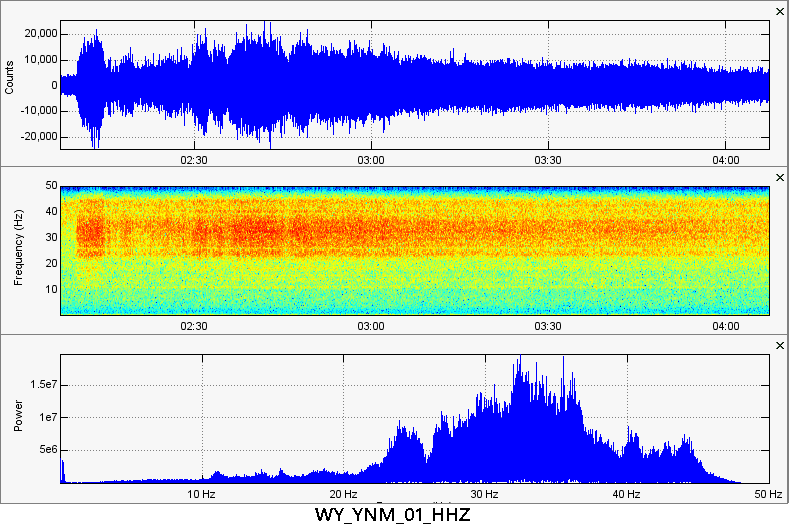
29th eruption of 2018 occurred at 3:37UTC November 29, 2018 (8:37pm MST November 28, 2018):
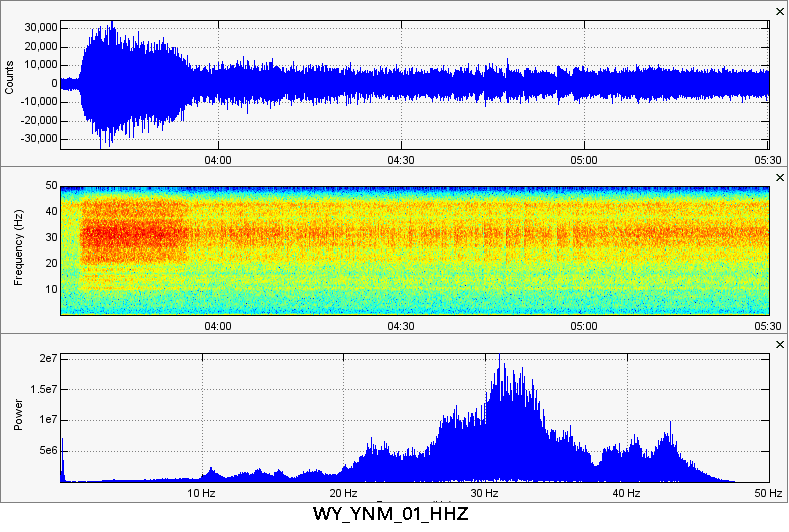
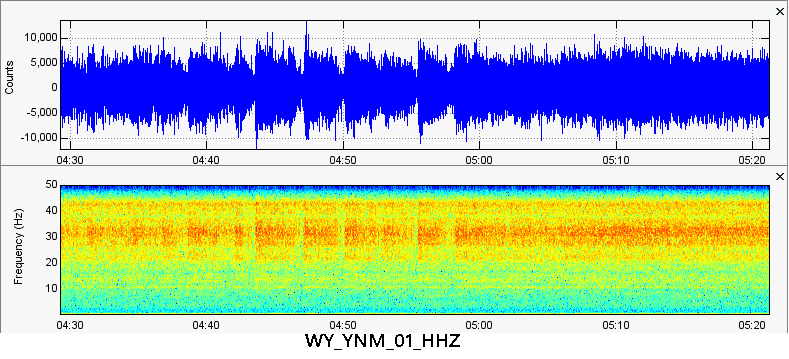
A zoomed-in look at the eruption pulses that occurred halfway through this 29th eruption. Officially, Steamboat has matched the all-time record and will for sure beat it by the end of the year. This eruption lasted 2 hours or so. Very long!
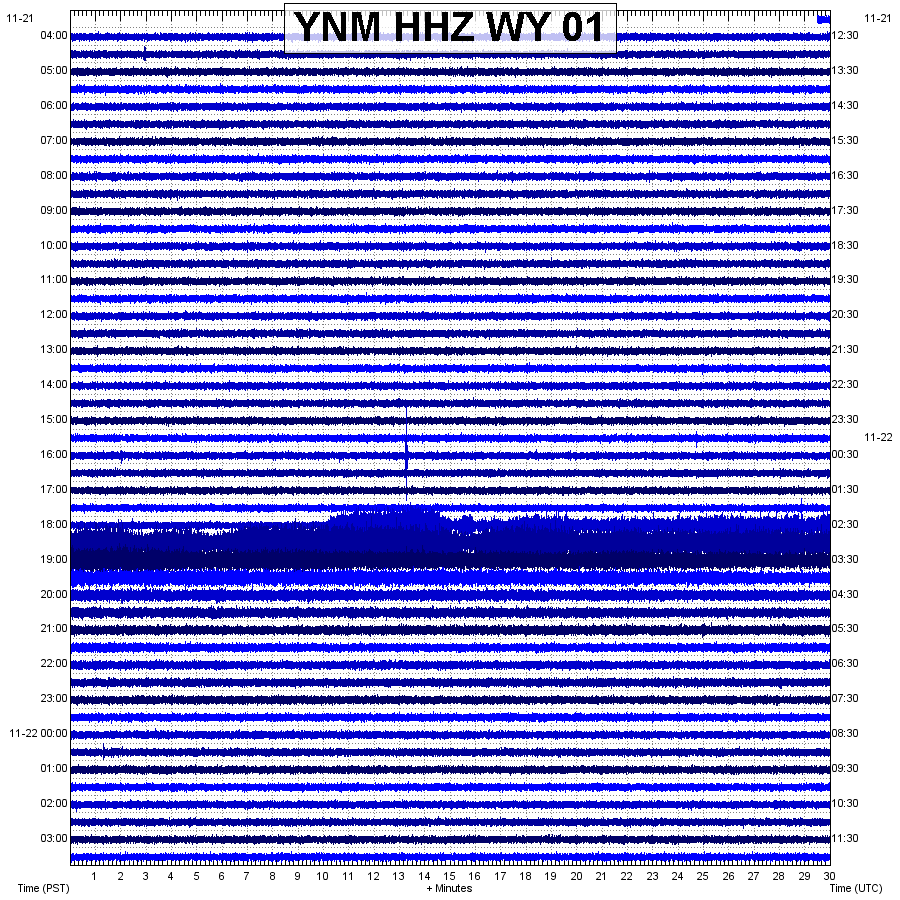
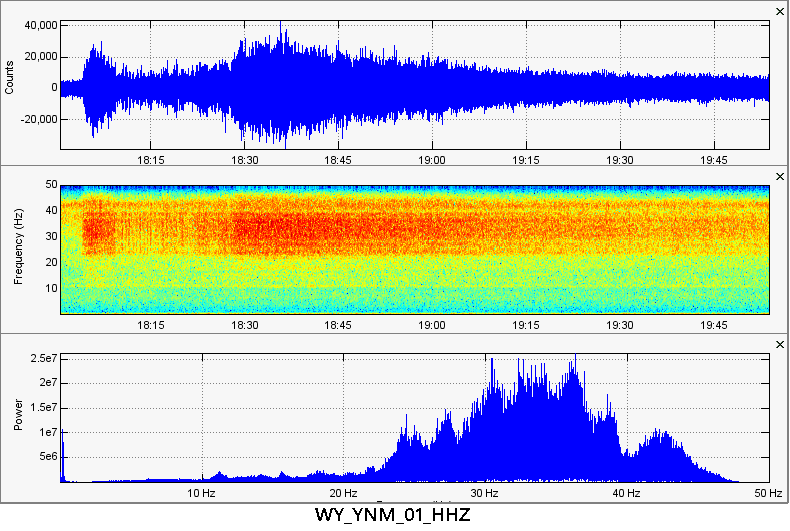
28th eruption of 2018 occurred at 2:10UTC November 22, 2018 (7:10pm MST November 21, 2018):
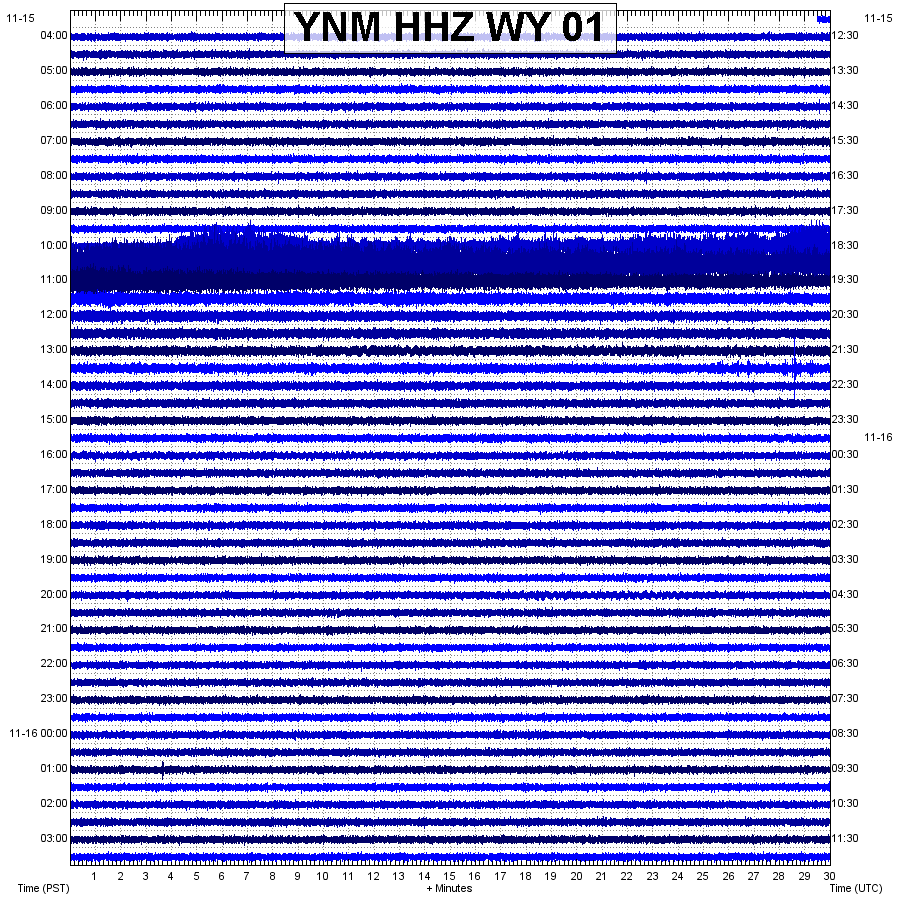
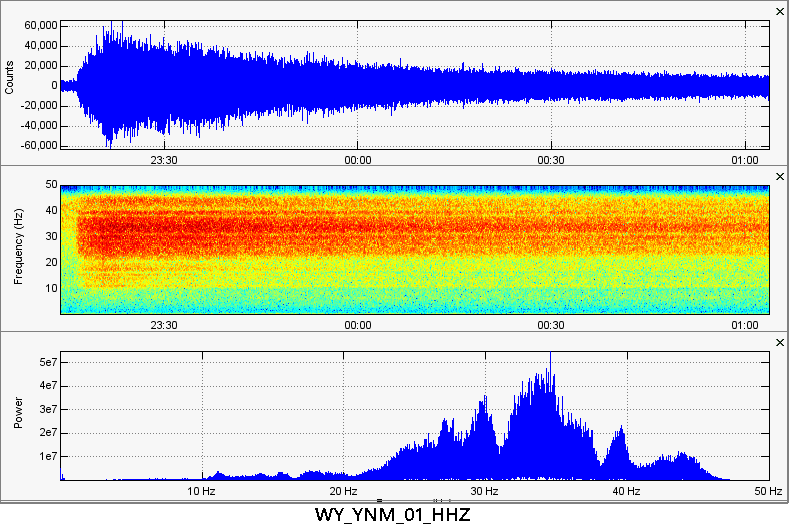
27th eruption of 2018 occurred at 18:04UTC November 15, 2018 (11:04am MST November 15, 2018):
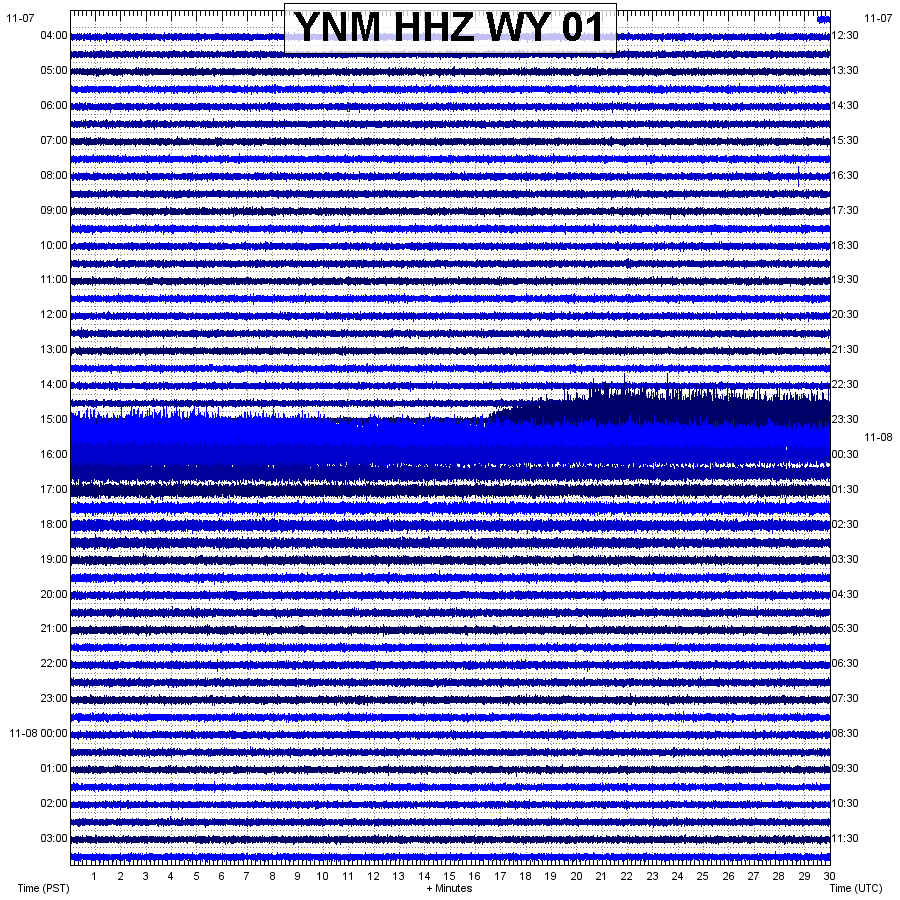
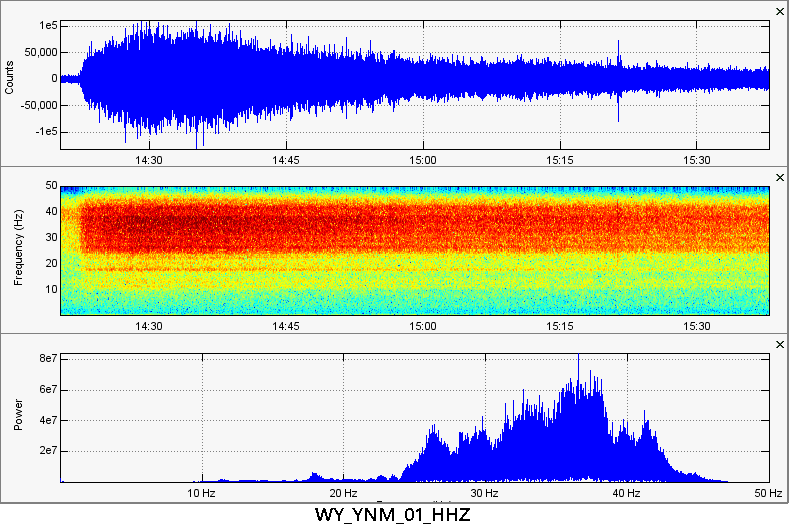
26th eruption of 2018 occurred at 23:16UTC November 7, 2018 (4:16pm MST November 7, 2018):
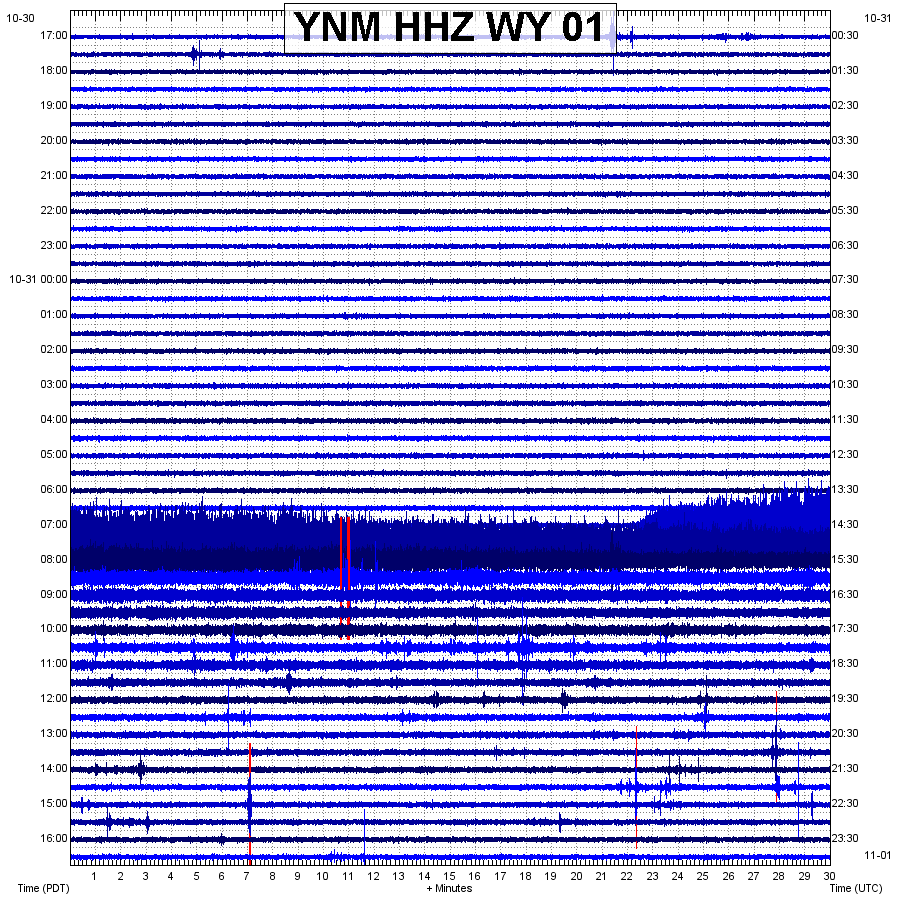
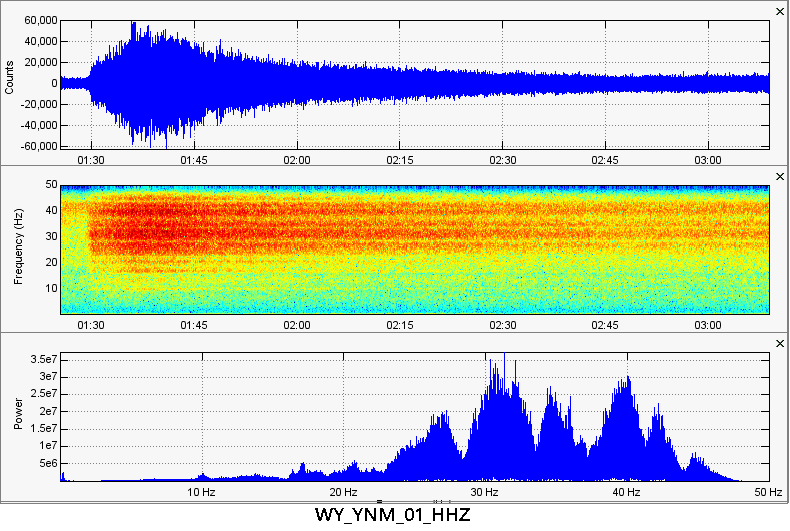
25th eruption of 2018 occurred at 14:22UTC October 31, 2018 (8:22am MST October 31, 2018):
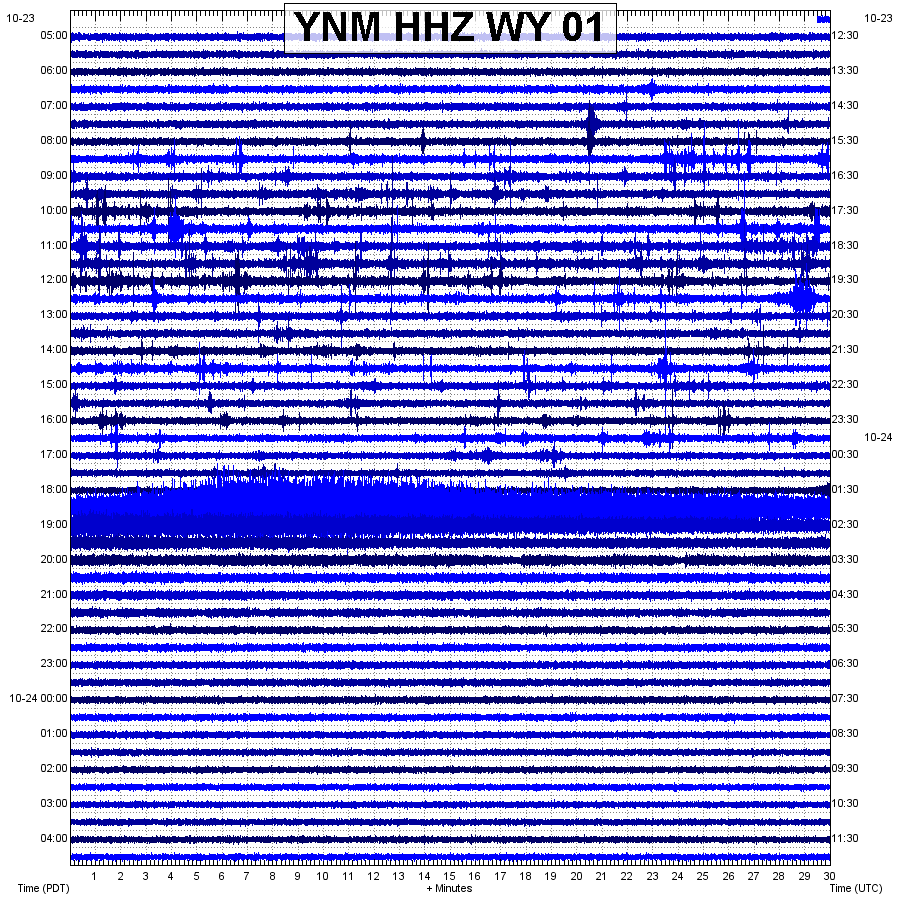
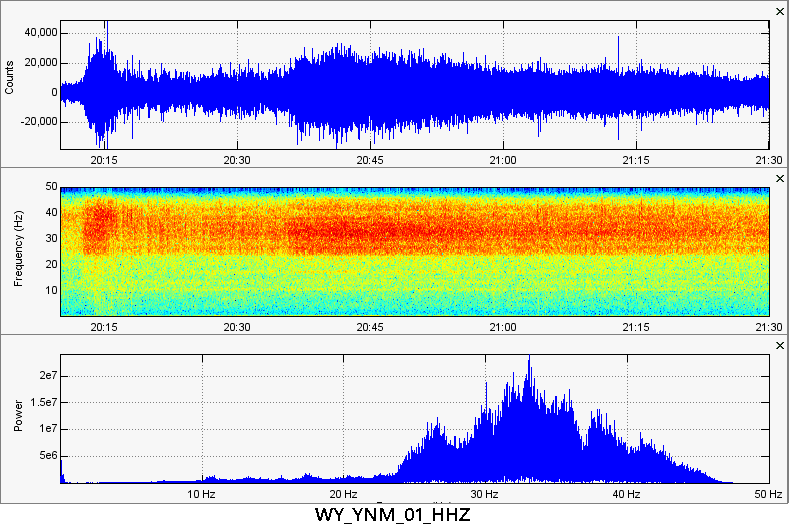
24th eruption of 2018 occurred at 1:29UTC October 24, 2018 (7:29pm MST October 23, 2018; note USGS states this eruption started at 9:29pm MST instead of 7:29pm MST like the data shows):
23rd eruption of 2018 occurred at 20:12UTC October 15, 2018 (2:12pm MST October 15, 2018):
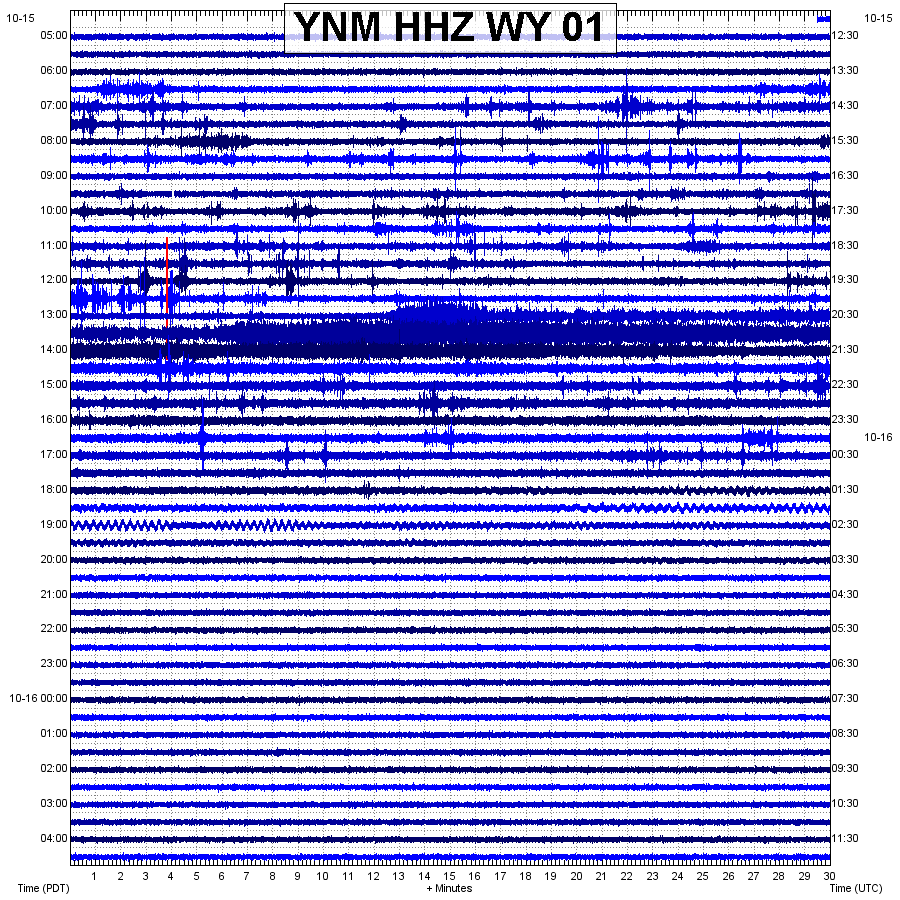
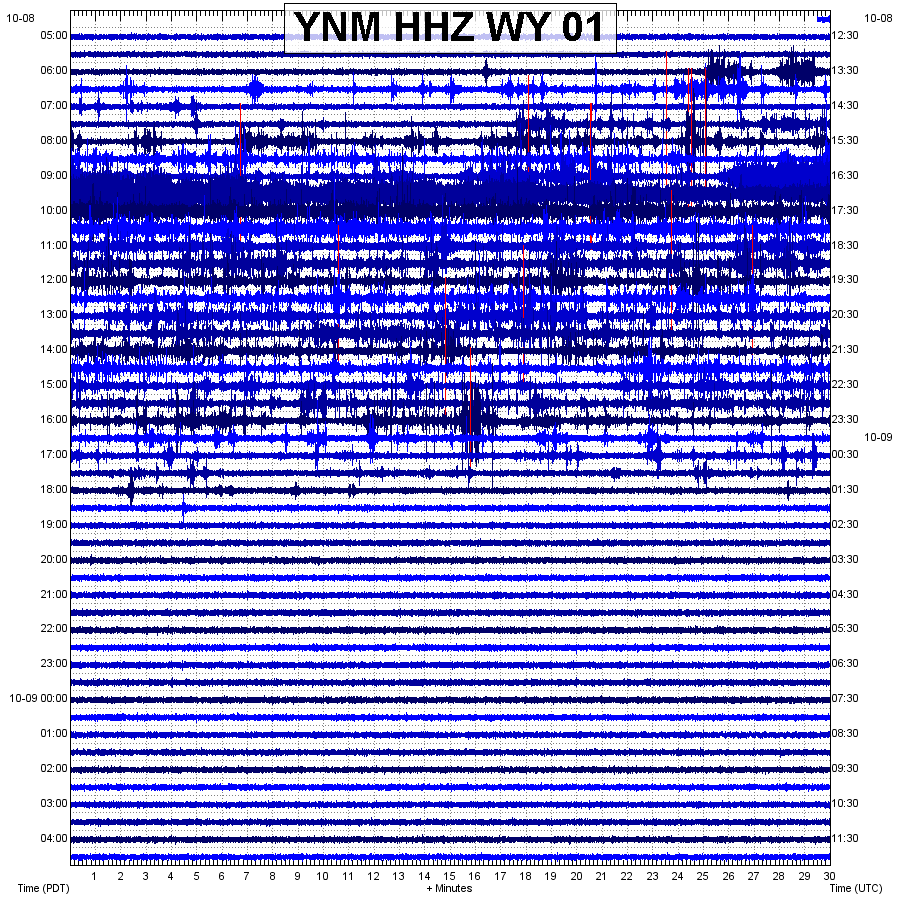
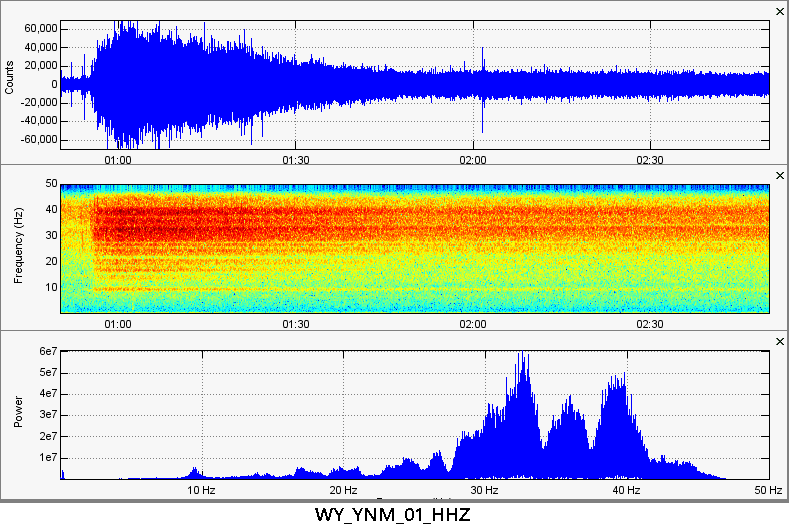
22nd eruption of 2018 occurred at 16:25UTC October 8, 2018 (10:25am MST October 8, 2018):

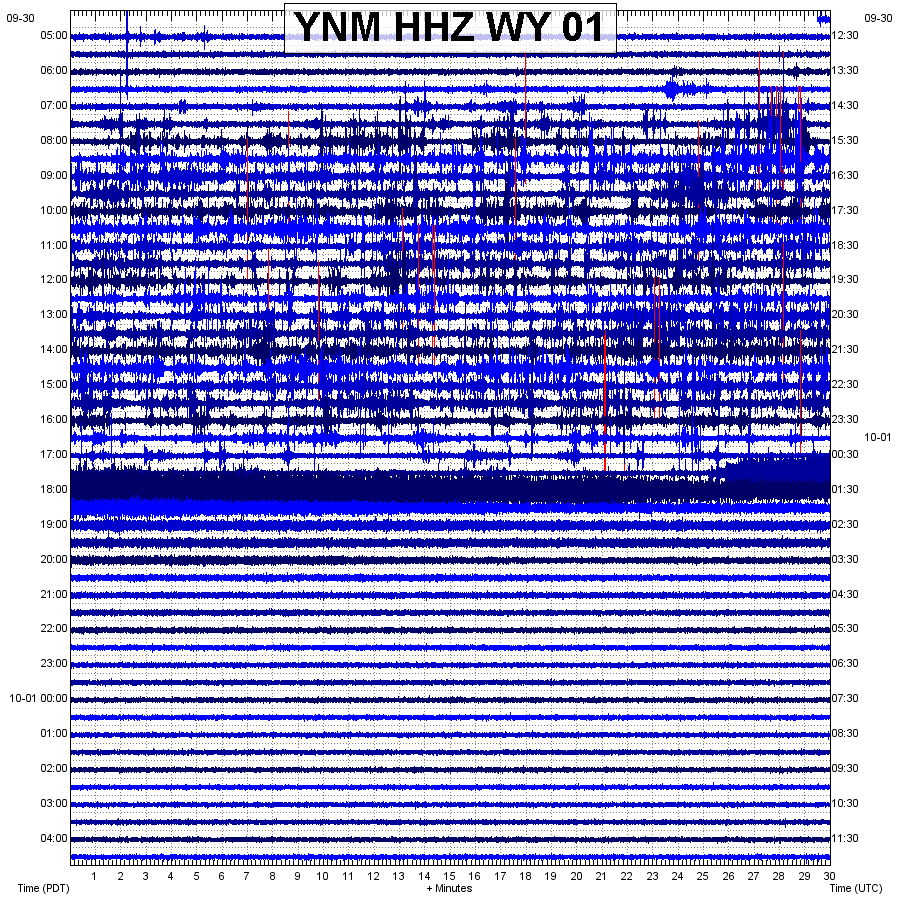
21st eruption of 2018 occurred at 0:55UTC October 1, 2018 (6:55pm MST September 30, 2018):
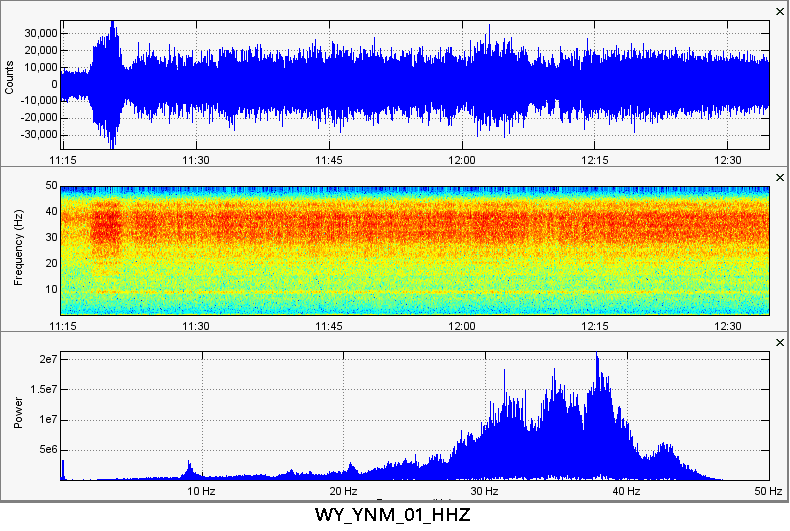
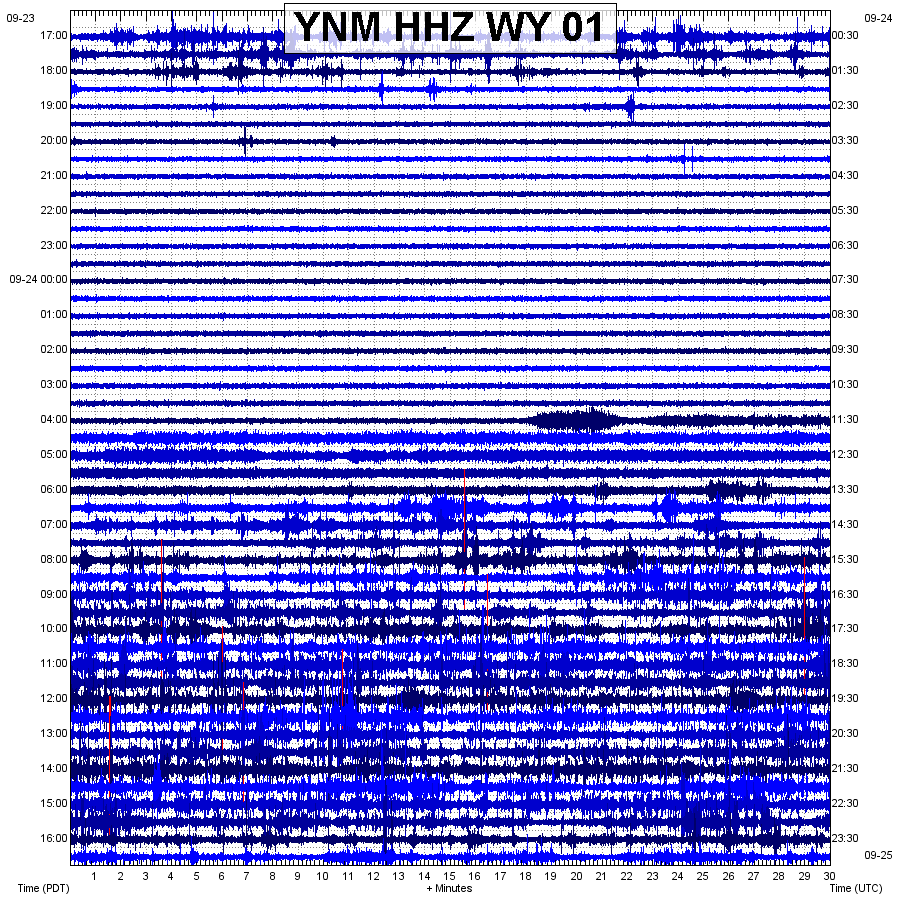
20th eruption of 2018 occurred at 11:18UTC September 24, 2018 (5:18am MST September 24, 2018):
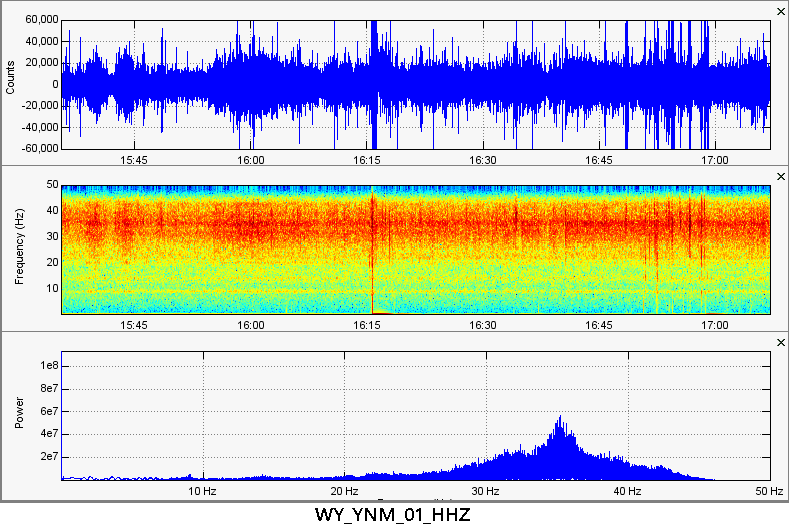
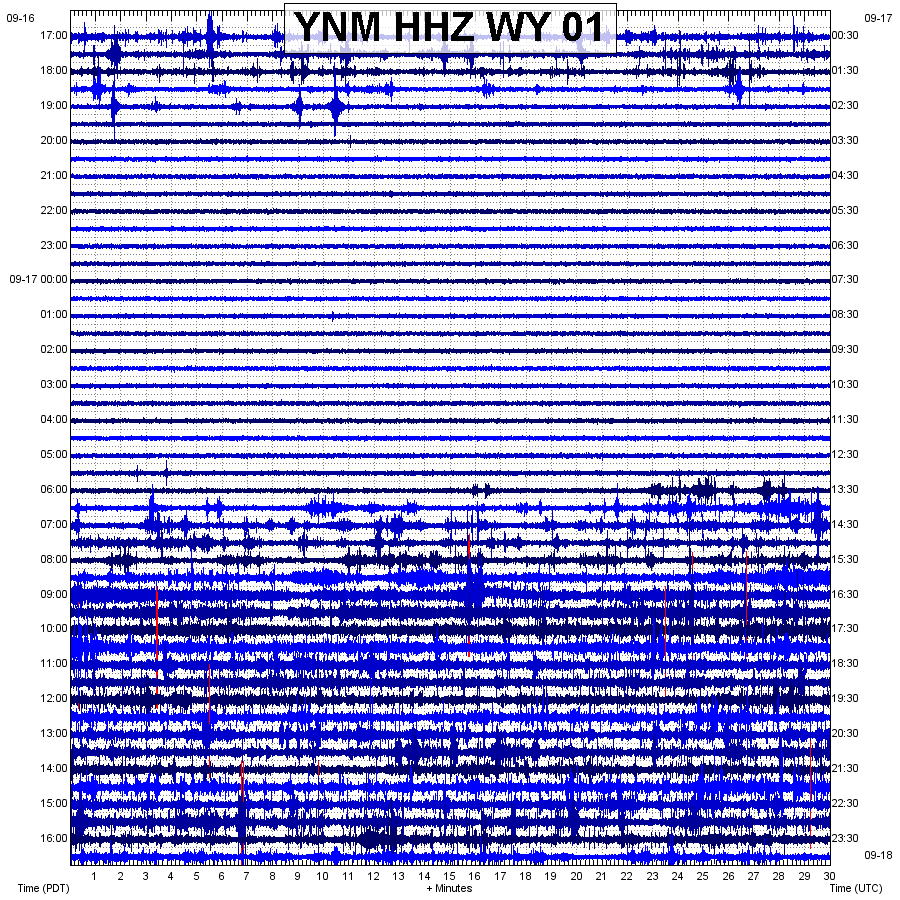
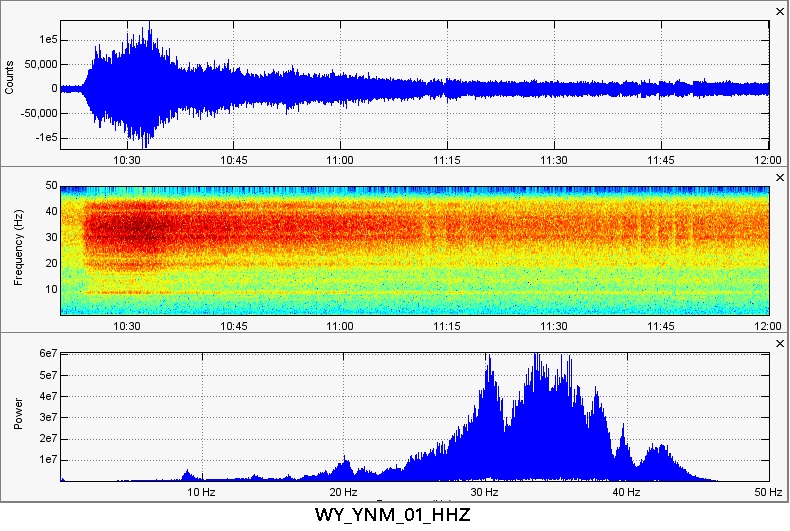
19th eruption of 2018 occurred at 15:38UTC September 17, 2018 (9:38am MST September 17, 2018):
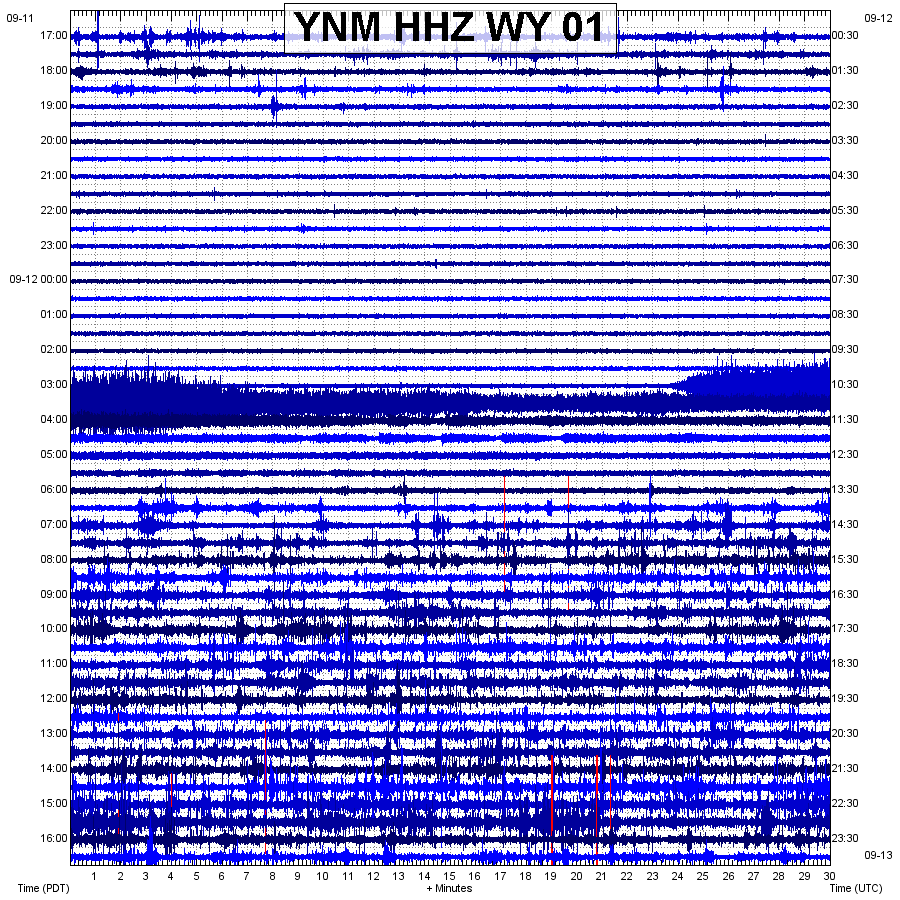
18th eruption of 2018 occurred at 10:23UTC September 12, 2018 (4:23am MST September 12, 2018; please note the strange "pulses" at the end of this eruption):
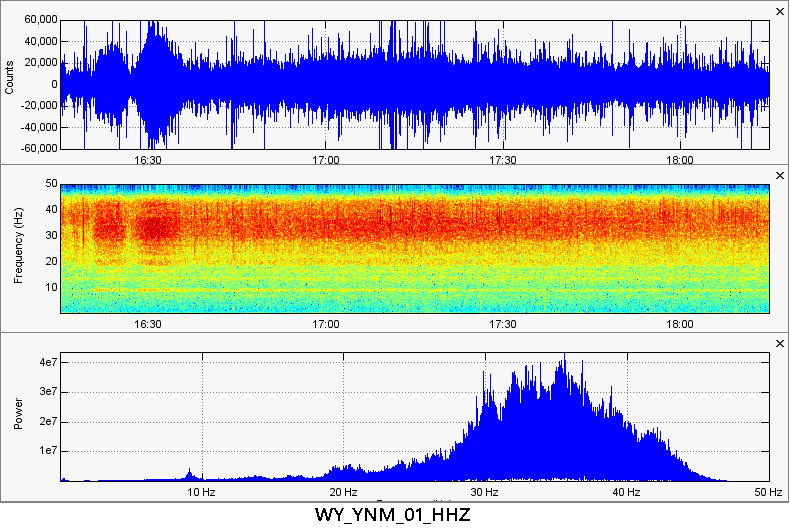
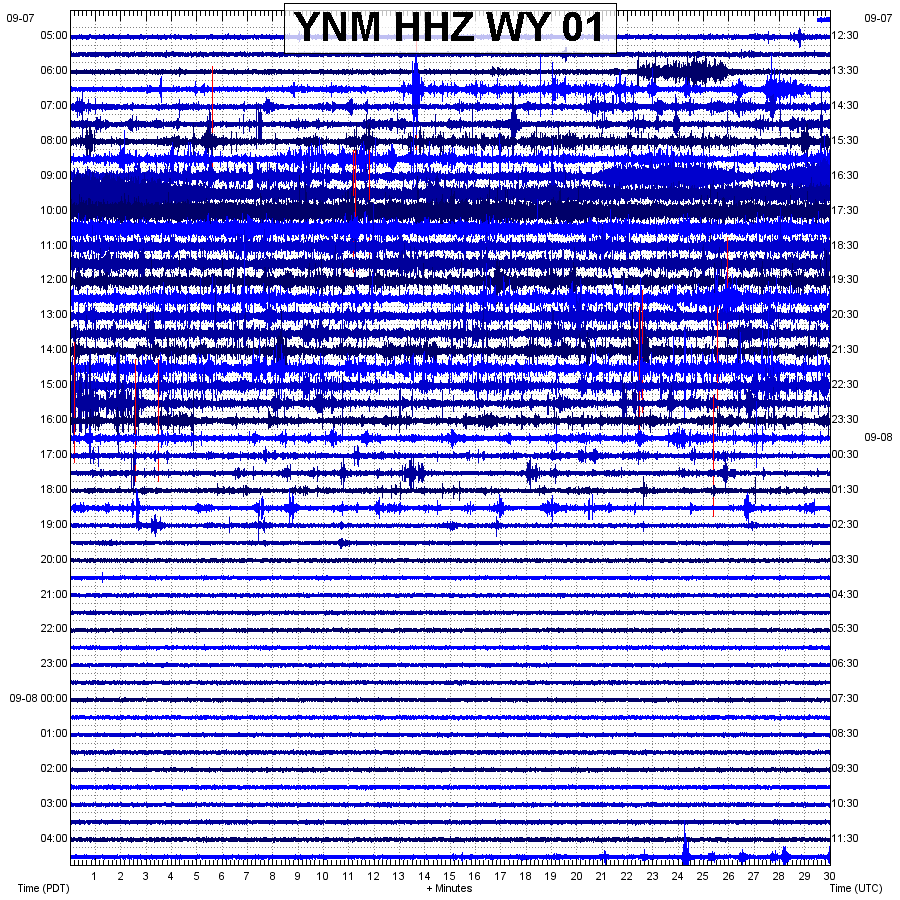
17th eruption of 2018 occurred at 16:20UTC September 7, 2018 (10:20am MST September 7, 2018):
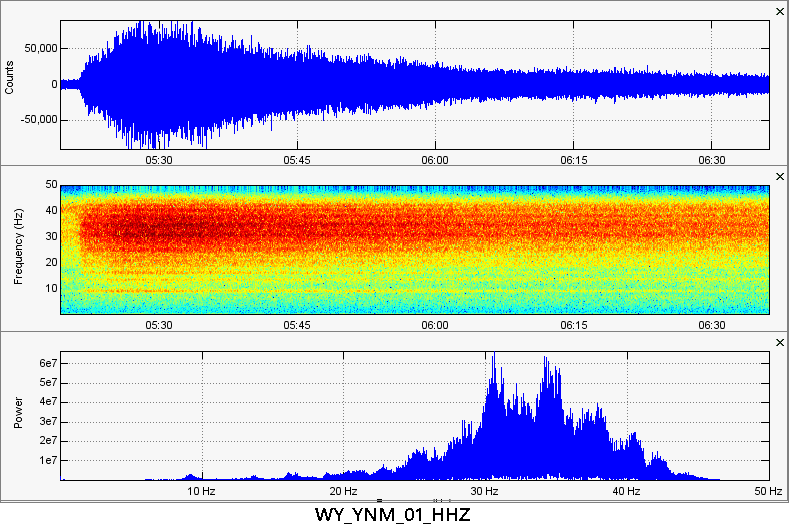
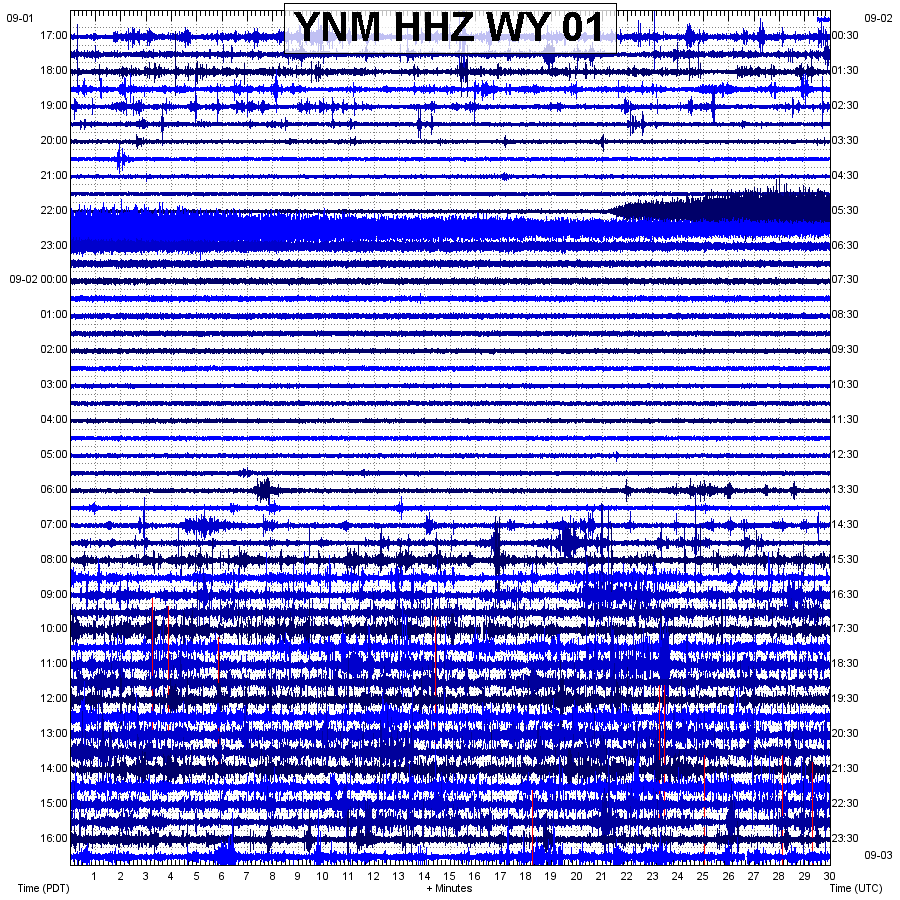
16th eruption of 2018 occurred at 5:21UTC September 2, 2018 (11:21pm MST September 1, 2018):
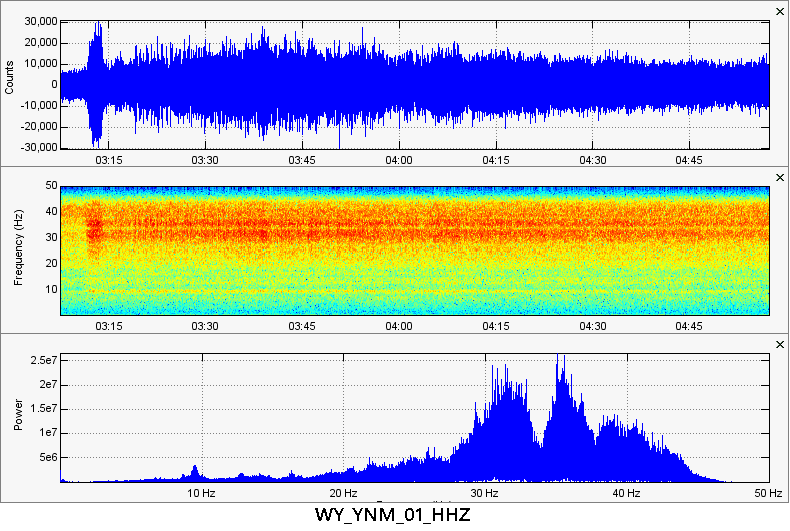
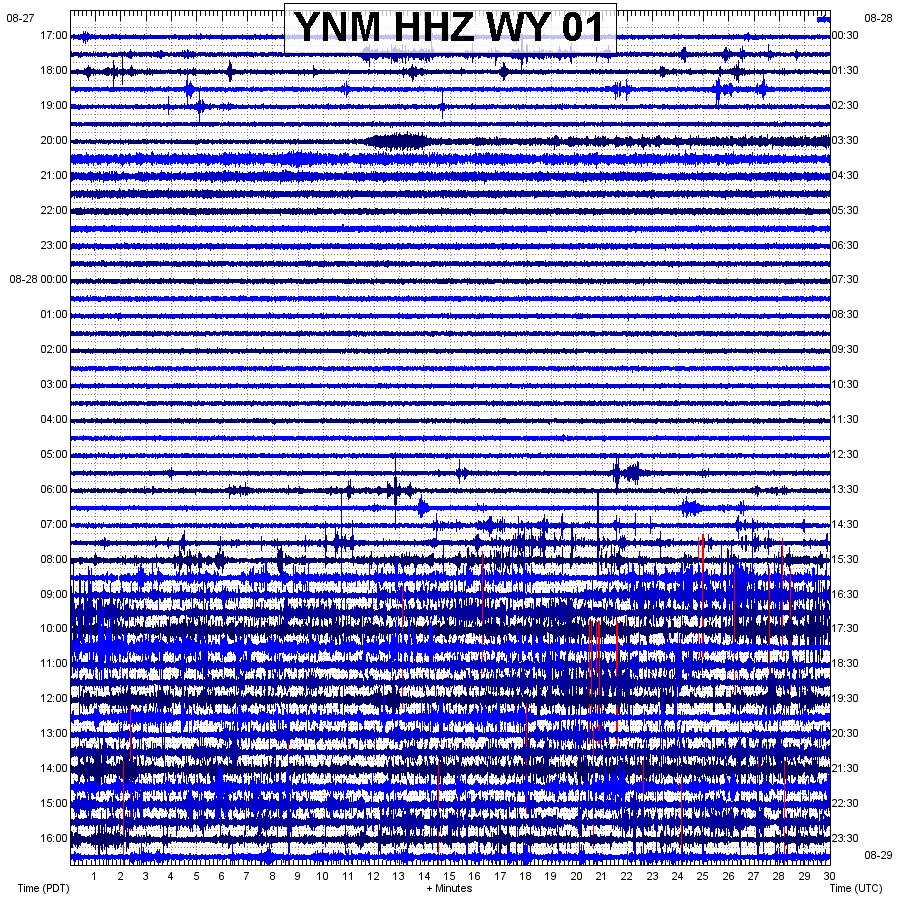
15th eruption of 2018 occurred at 3:12UTC August 28, 2018 (9:12pm MST August 27, 2018; note the USGS site says the eruption started at 9:30pm MST instead of 9:12pm MST like the data shows):
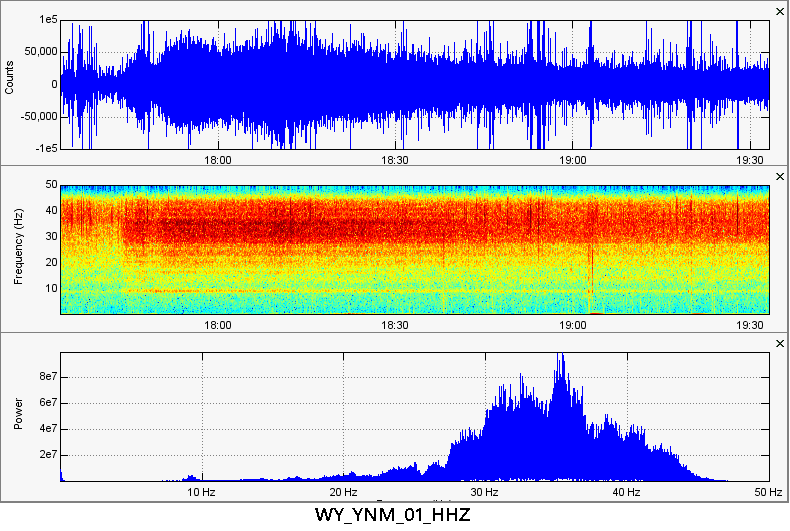
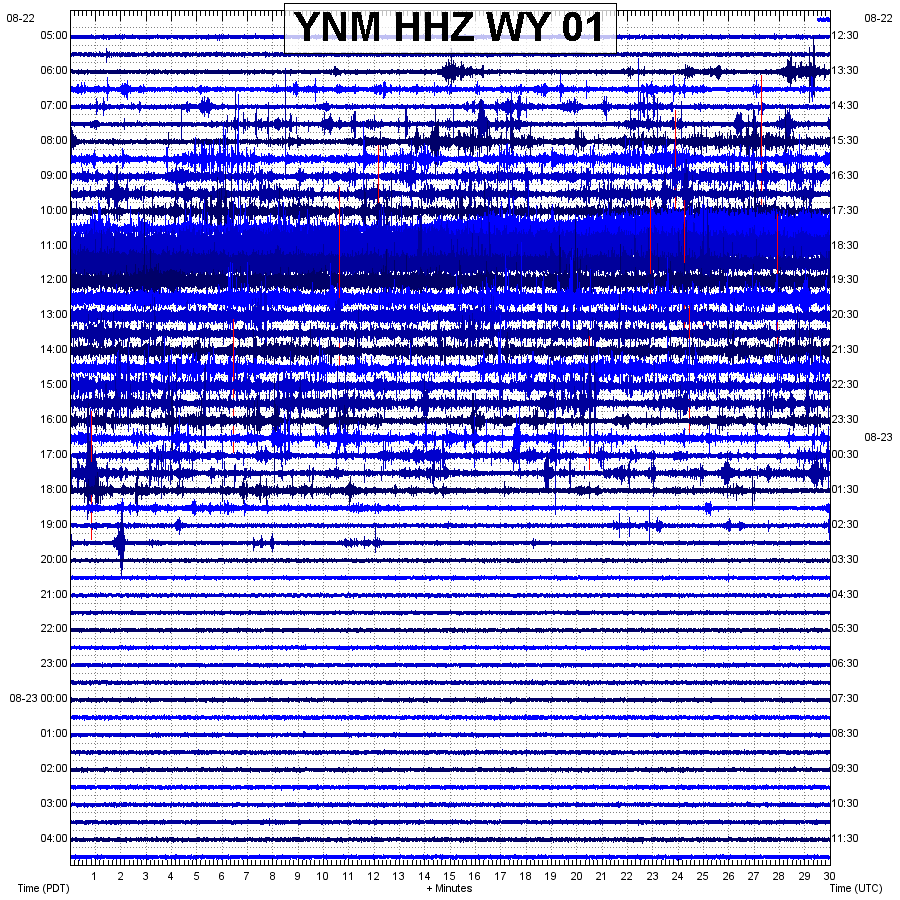
14th eruption of 2018 occurred at 17:44UTC August 22, 2018 (11:44am MST August 22, 2018):
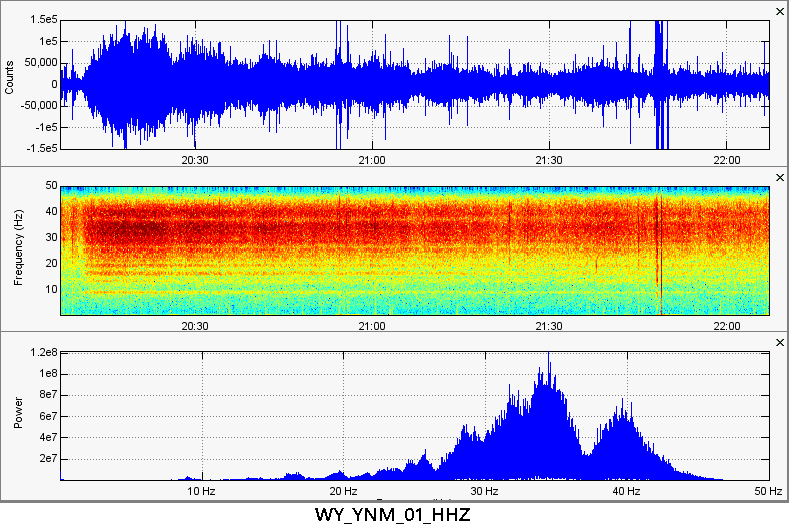
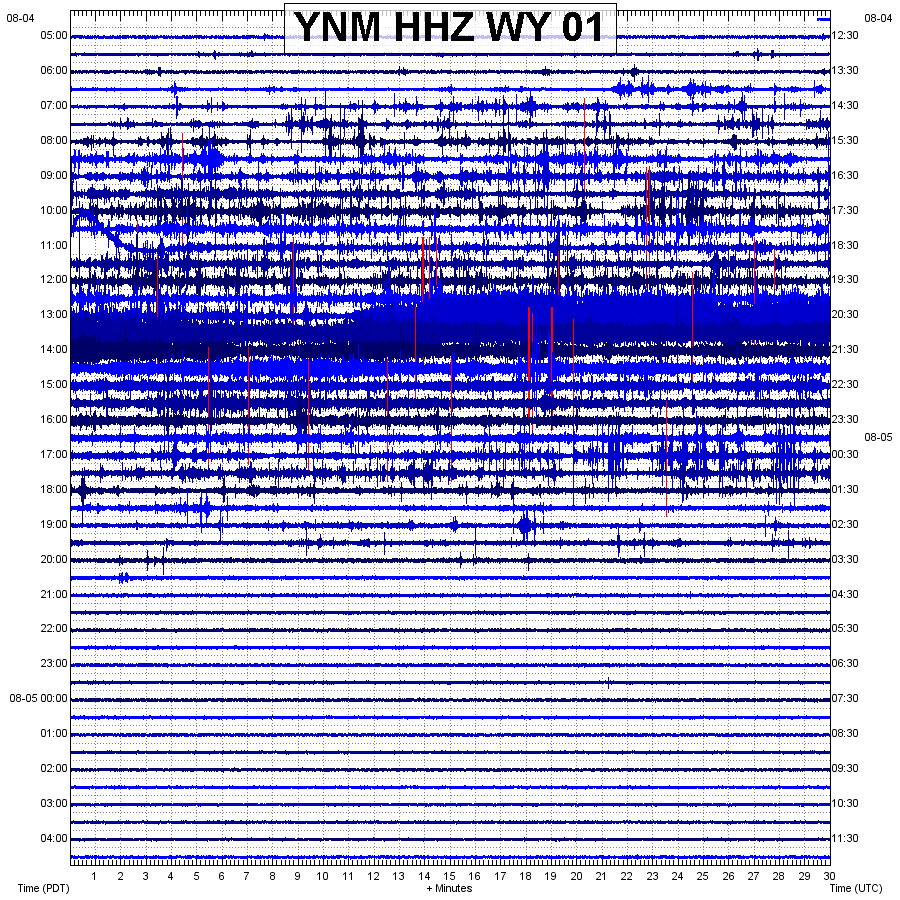
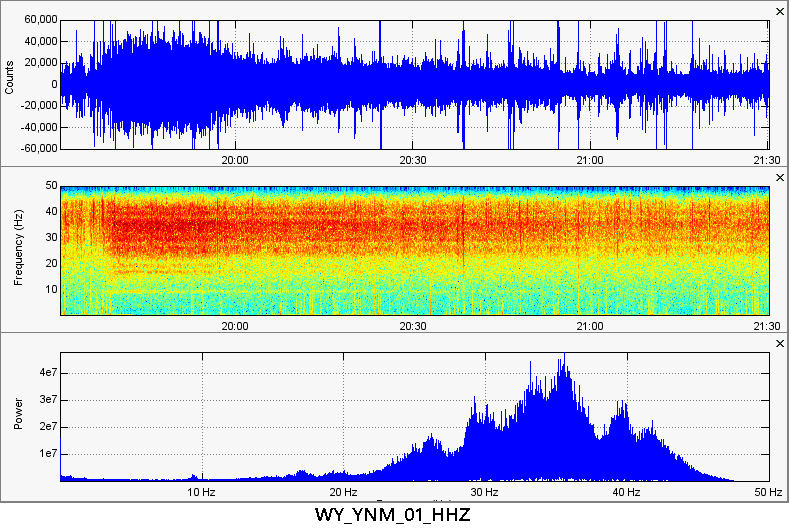
13th eruption of 2018 occurred at 20:10UTC August 4, 2018 (2:10pm MST August 4, 2018):
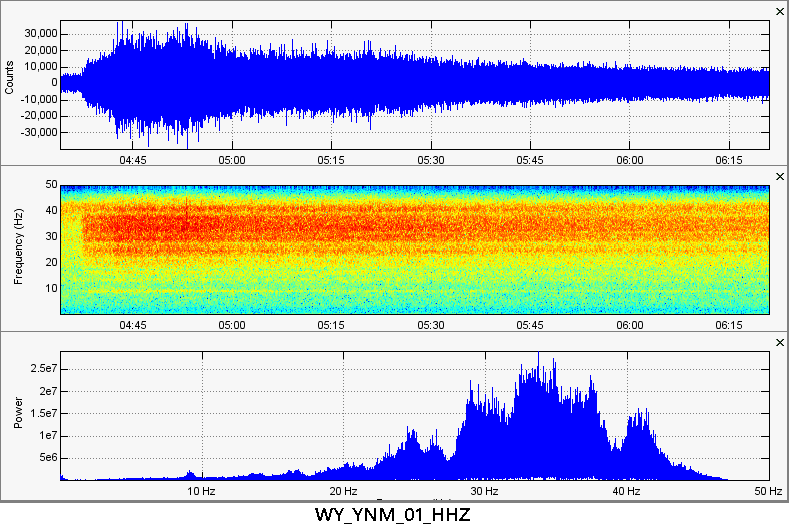
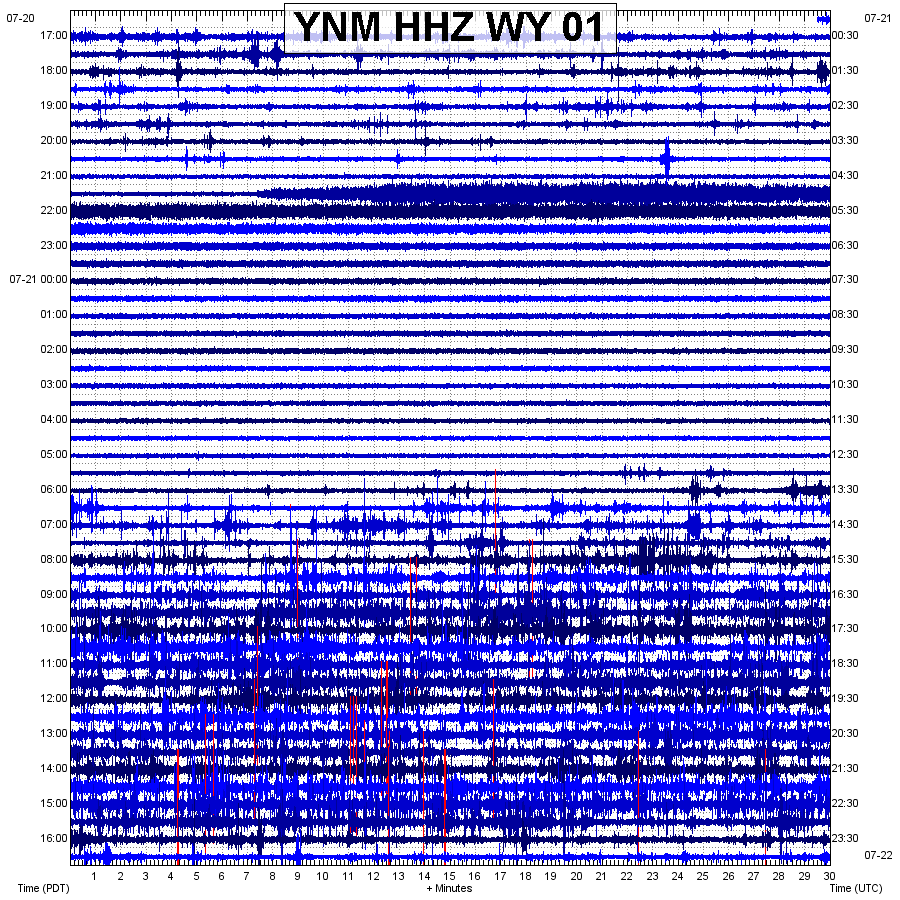
12th eruption of 2018 occurred at 4:36UTC July 21, 2018 (10:36pm MST July 20, 2018):
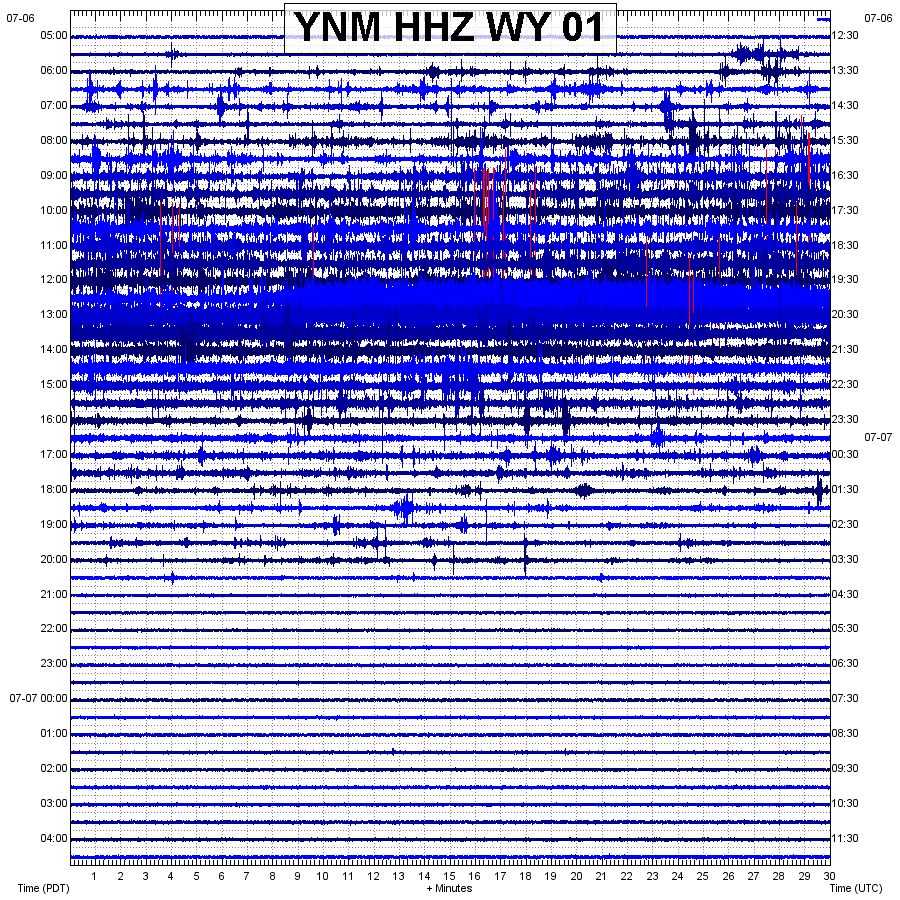
11th eruption of 2018 occurred at 19:38UTC July 6, 2018 (1:38pm MST July 6, 2018):
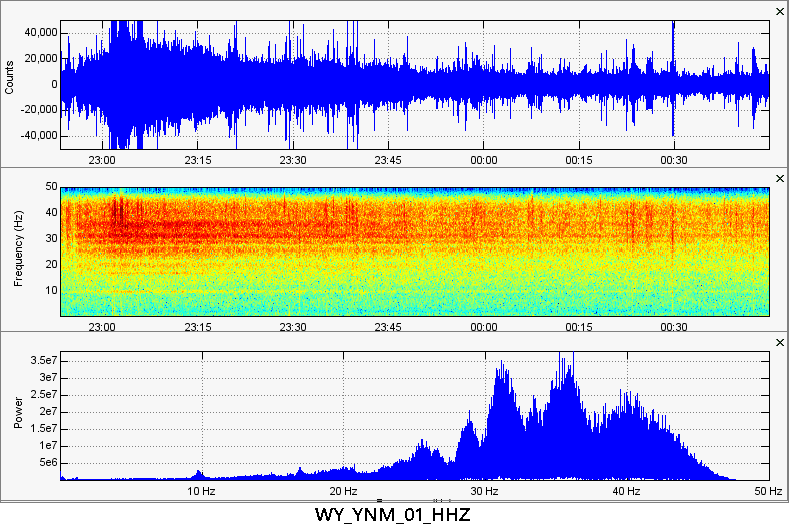
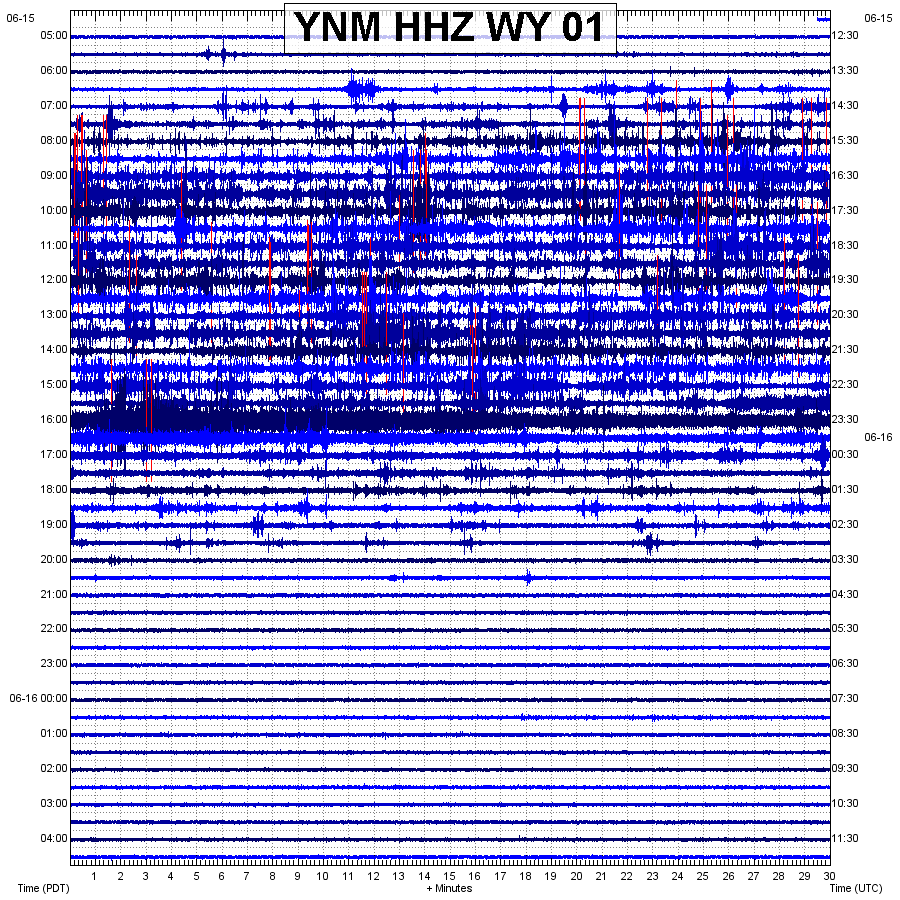
10th eruption of 2018 occurred at 22:55UTC June 15, 2018 (4:55pm MST June 15, 2018):
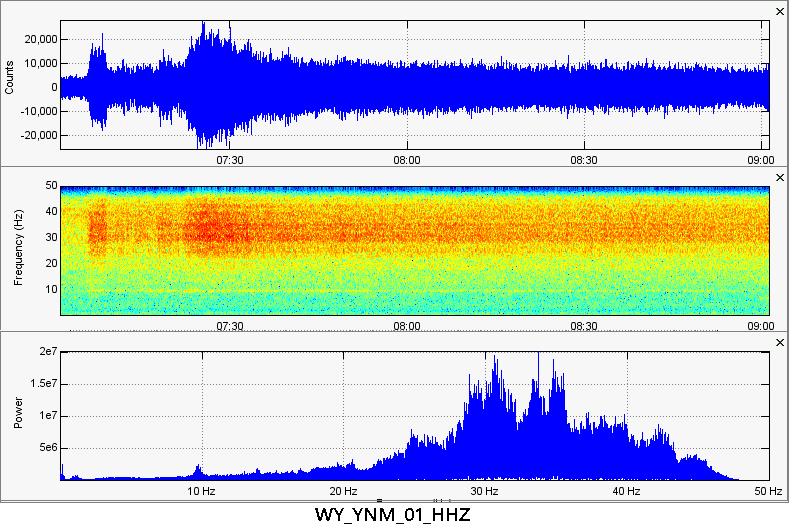
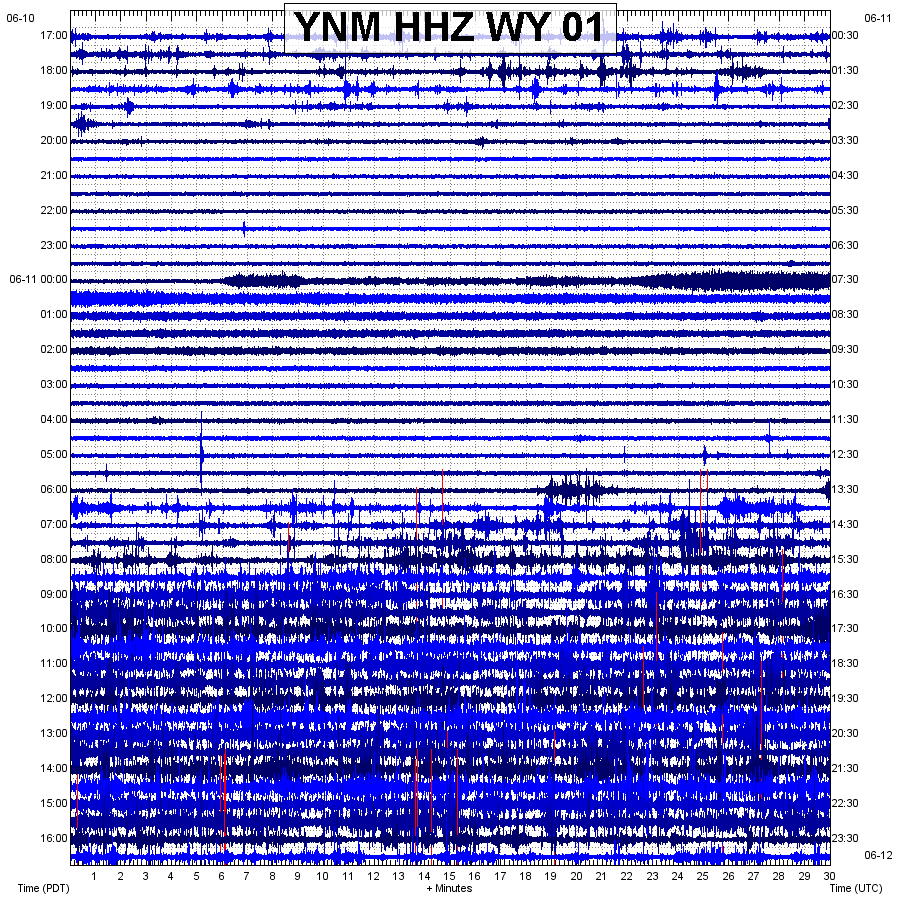
9th eruption of 2018 occurred at 7:06UTC June 11, 2018 (1:06am MST June 11, 2018):
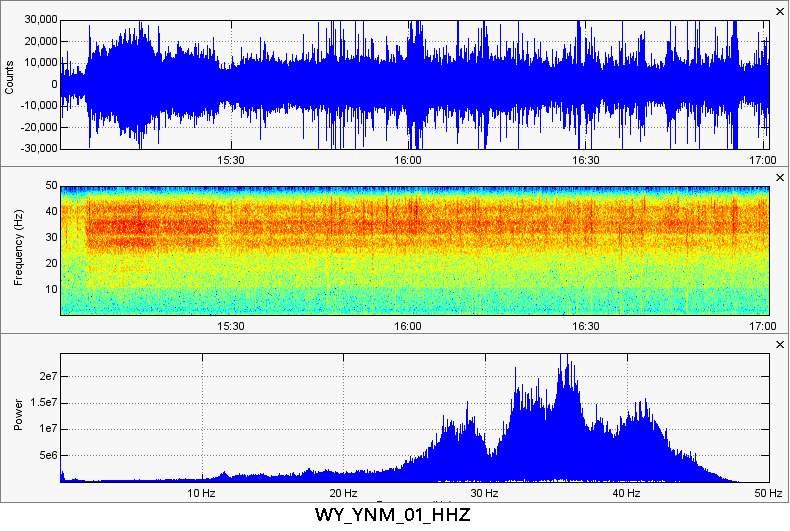
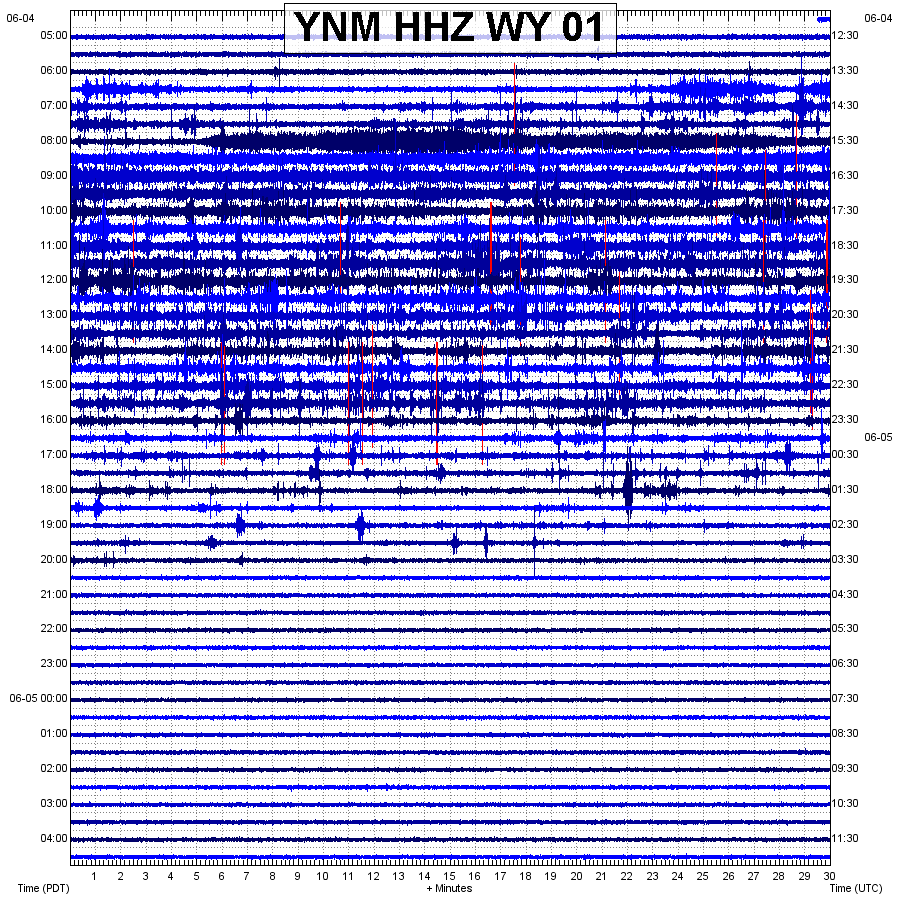
8th eruption of 2018 occurred at 15:05UTC June 4, 2018 (9:05am MST June 4, 2018):
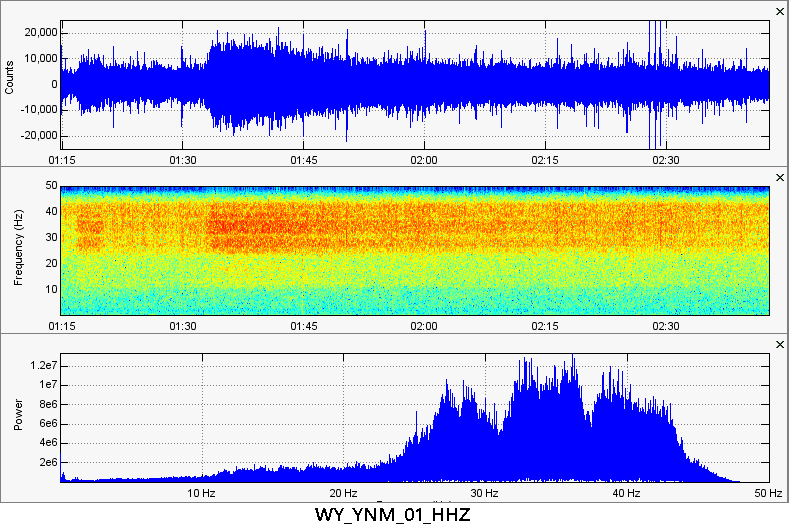
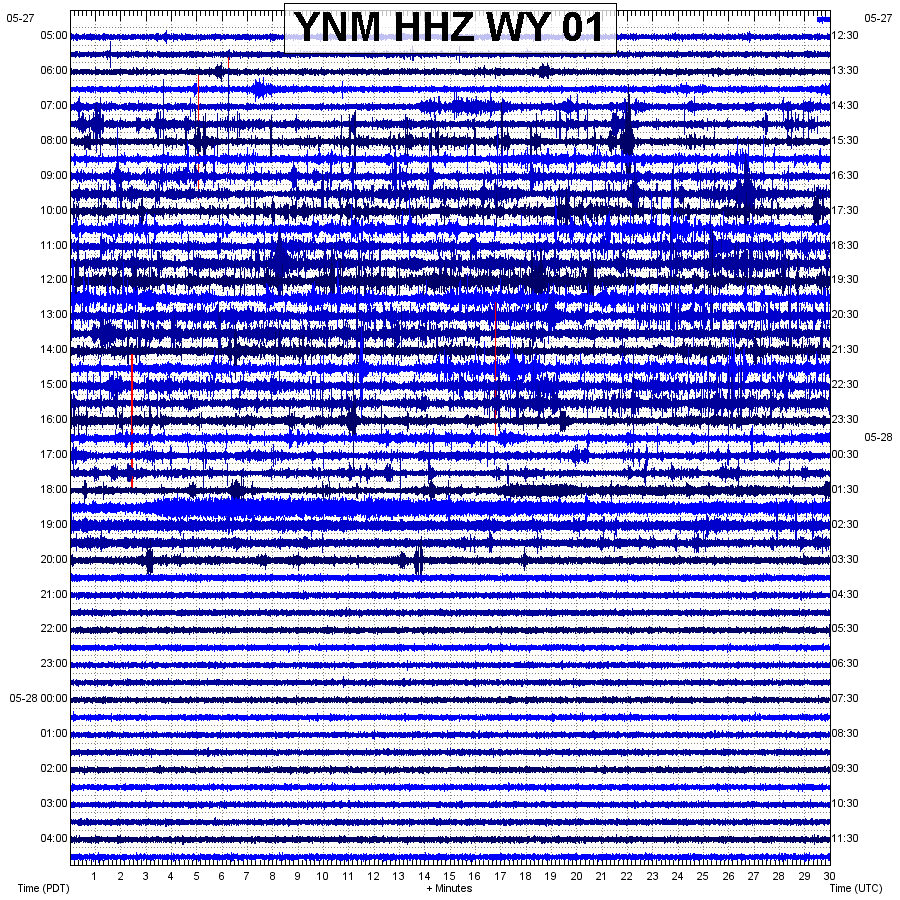
7th eruption of 2018 occurred at 1:33UTC May 28, 2018 (7:33pm MST May 27, 2018; note this eruption was preceded by a small "water burst"):
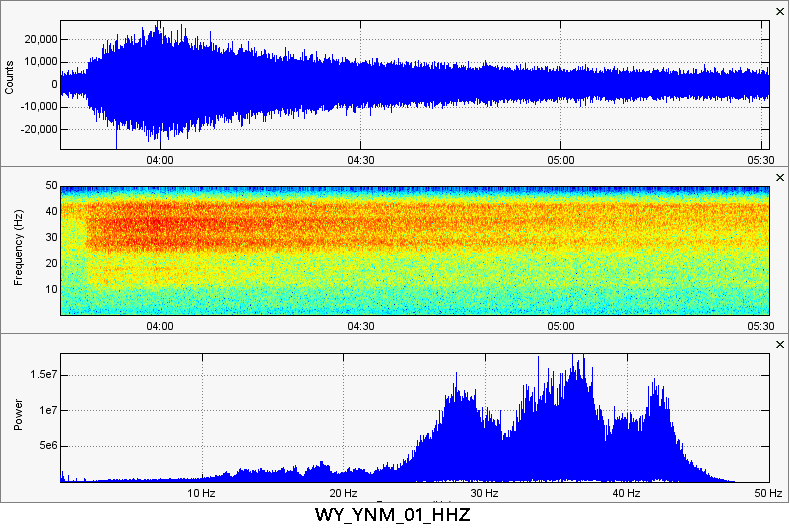
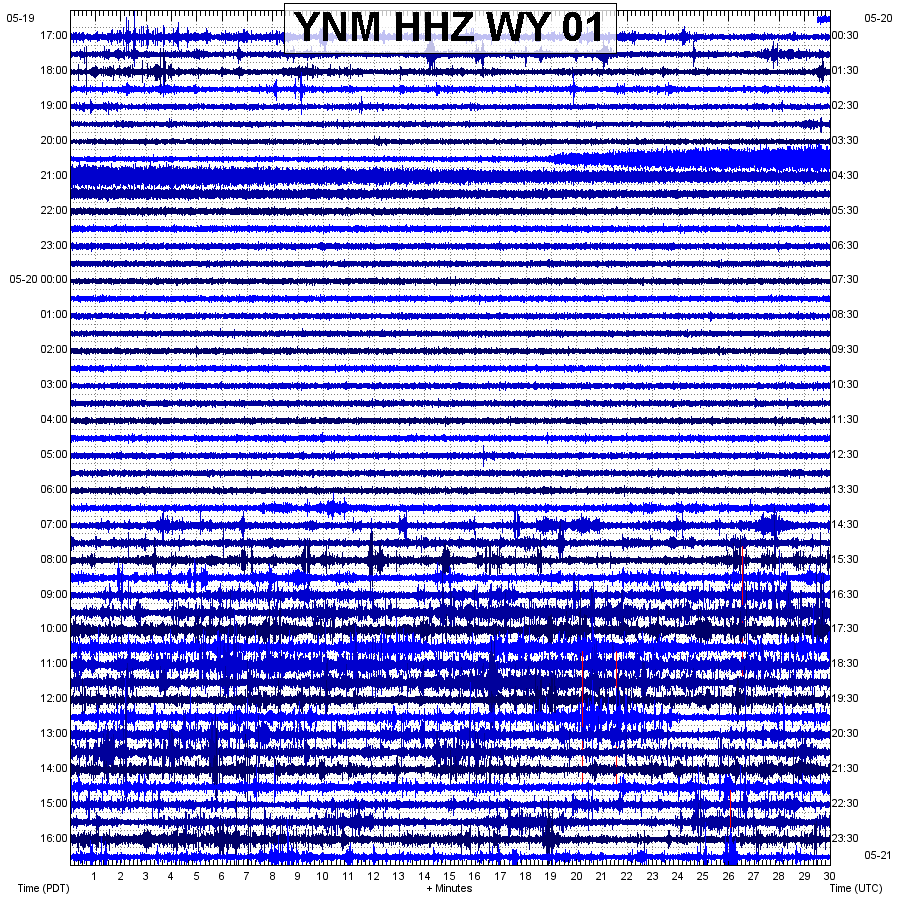
6th eruption of 2018 occurred at 3:49UTC May 20, 2018 (9:49pm MST May 19, 2018):
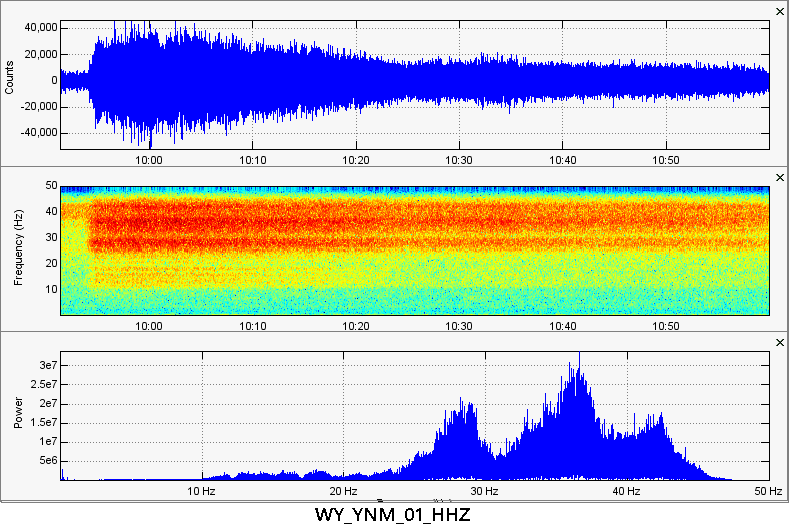
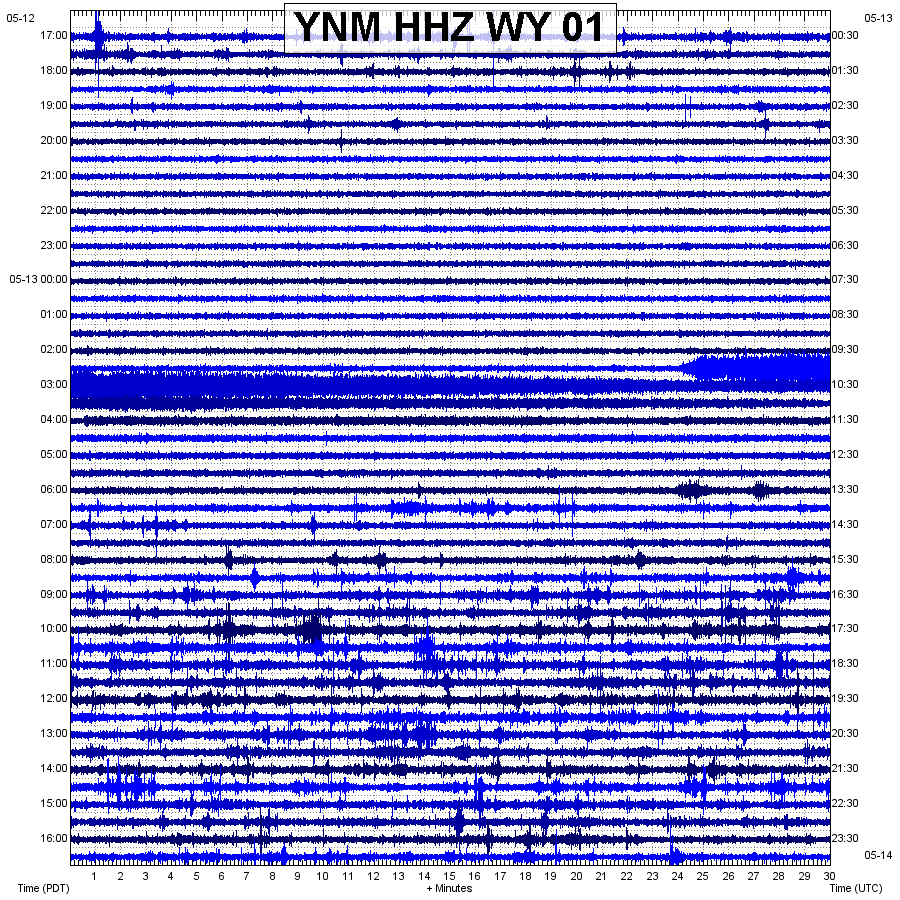
5th eruption of 2018 occurred at 9:54UTC May 13, 2018 (3:54am MST May 13, 2018):
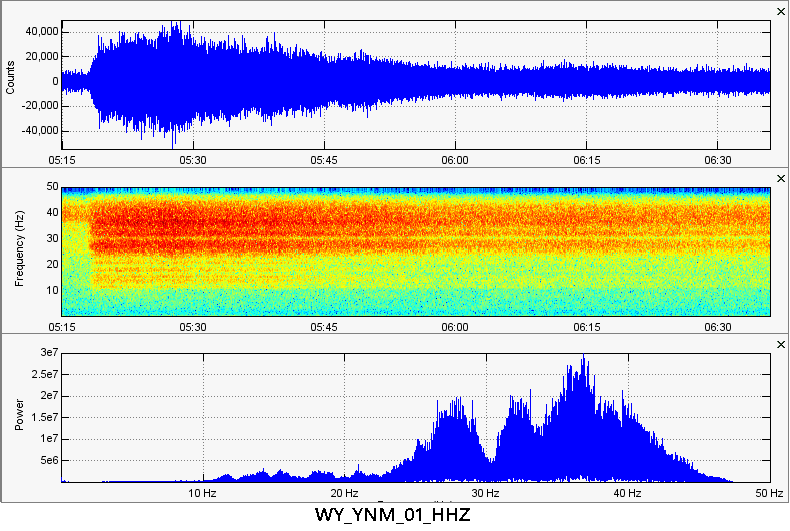
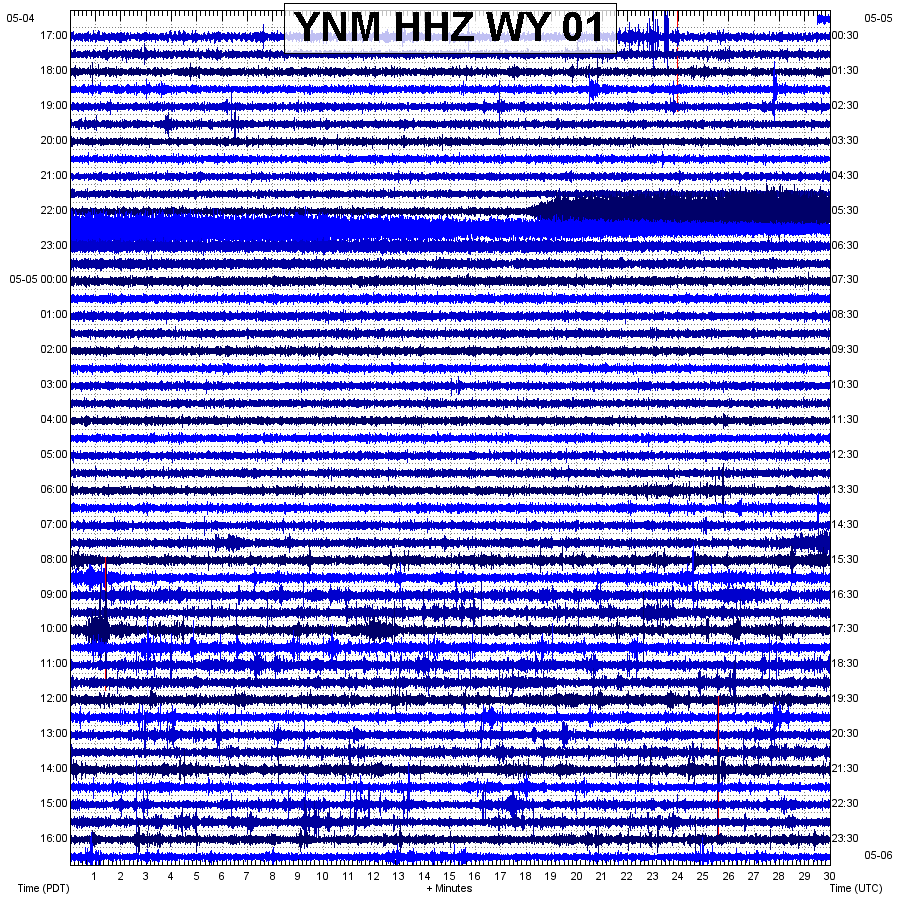
4th eruption of 2018 occurred at 5:18UTC May 5, 2018 (11:18pm MST May 4, 2018; note USGS site says 11:50pm instead of 11:18pm like the data shows):
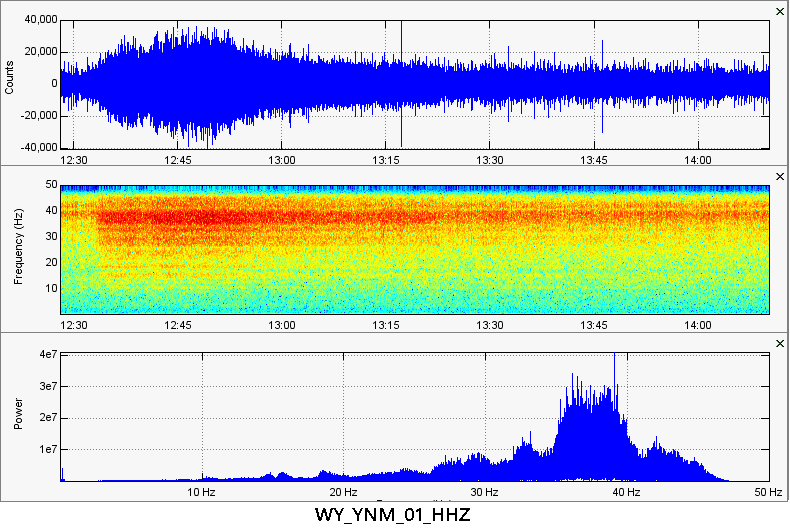
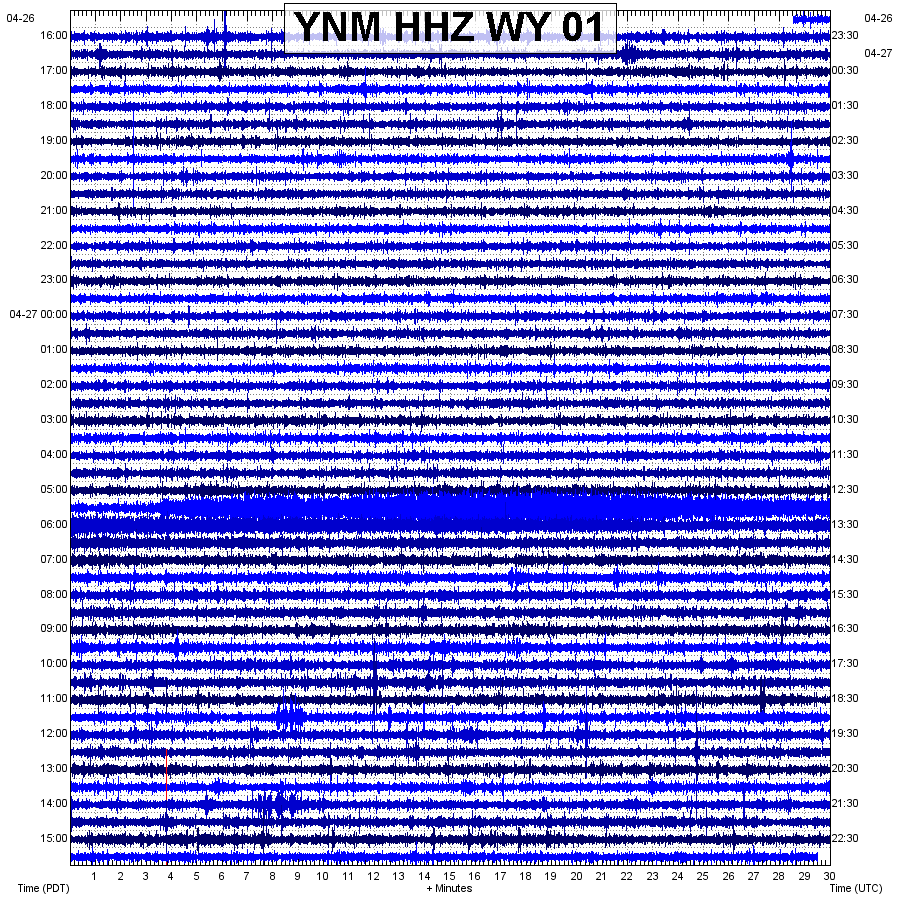
3rd eruption of 2018 occurred at 12:30UTC April 27, 2018 (6:30am MST April 27, 2018):
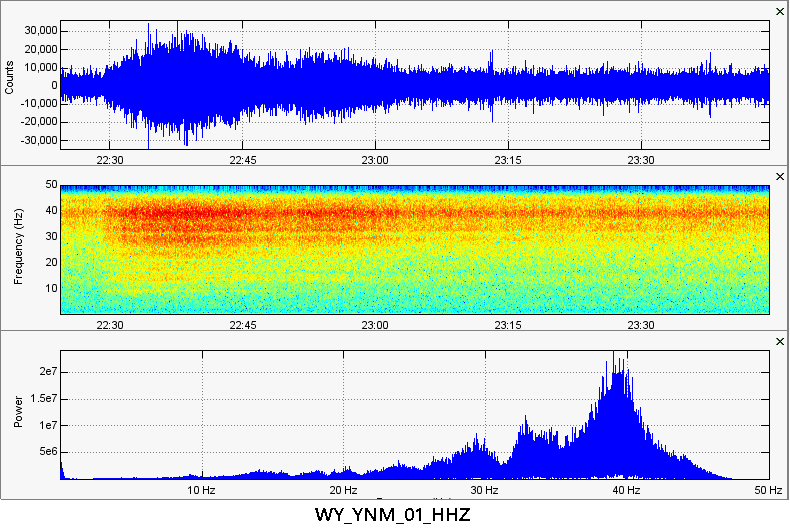
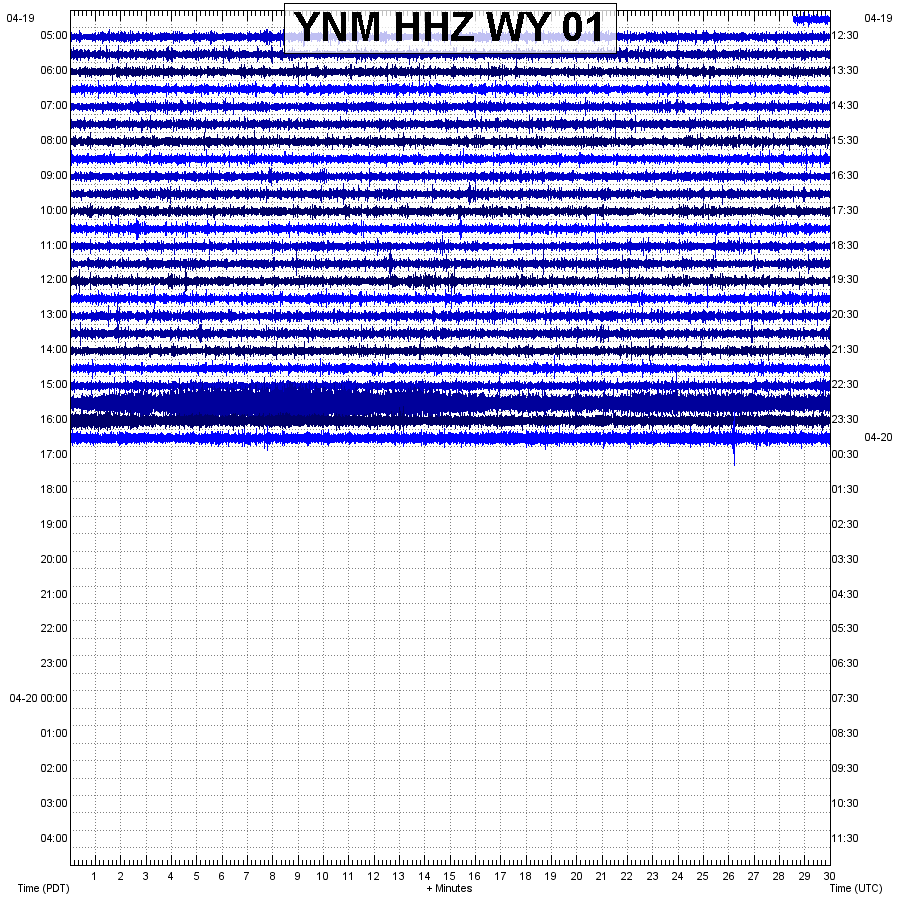
2nd eruption of 2018 occurred at 22:30UTC April 19, 2018 (4:30pm MST April 19, 2018):
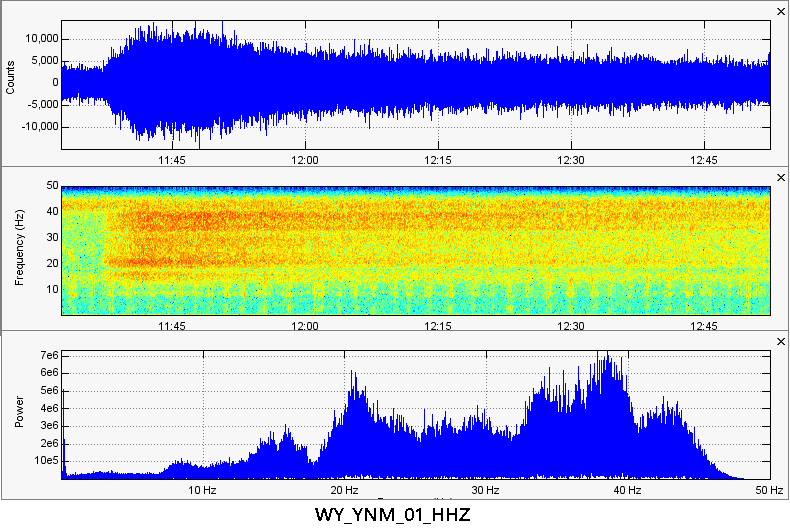
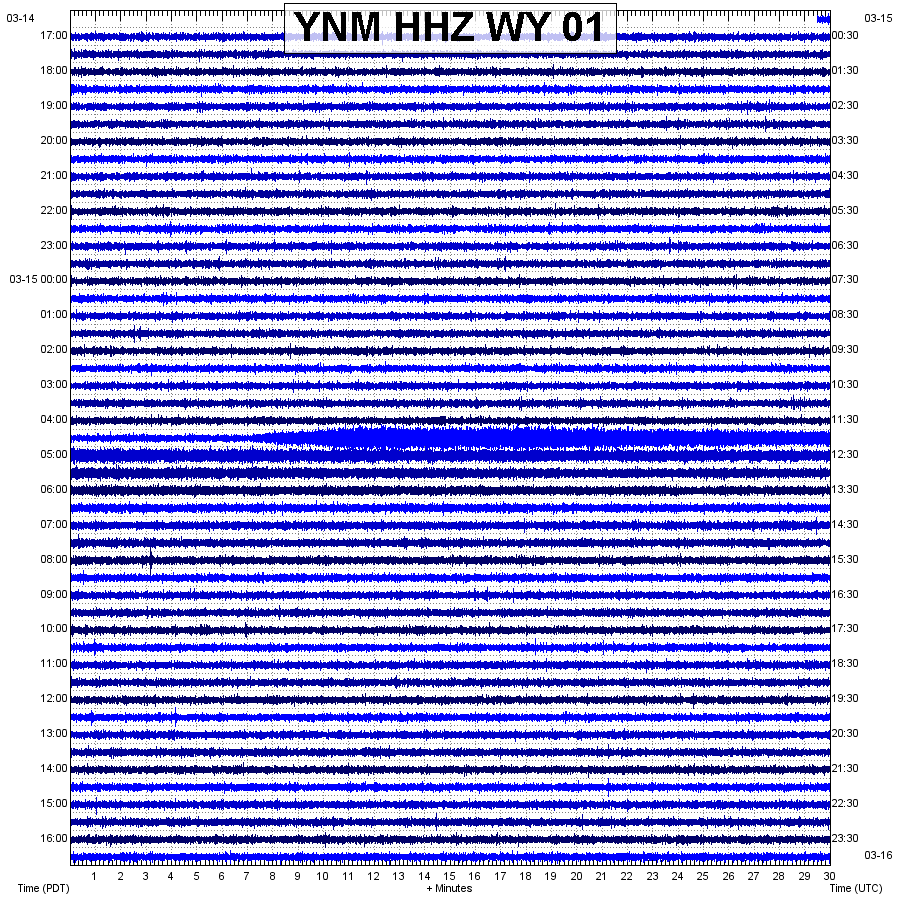
1st eruption of 2018 occurred at 11:37UTC March 15, 2018 (5:37am MST March 15, 2018):