Starting on December 27, 2008, a large earthquake swarm broke out under the northern section of Yellowstone Lake. This swarm started off normal, but preceded to be the most severe short-term earthquake swarm Yellowstone has ever seen (at least in my opinion). About 820 earthquakes were reported, with many unreported events because of data saturation, ranging from M-0.1 to M4.6 within less than a week! Please CLICK HERE to visit the professional publication dedicated to deciphering this crazy swarm. I will reference it a few times.
This earthquake swarm was most likely caused by a quick and intense dike intrusion of magma, or a poro-elastic stress pulse, beneath Yellowstone Lake. That is not just my opinion. The publication, linked above, states a dike intrusion of magma is a likely scenario. They never talked about the low frequency events shown below, which I found odd. But there were many of them along with a low level background tremor that would spike significantly, periodically. It is possible the low frequency background tremor was caused by lake microseisms, but that doesn't seem possible since the lake should have been frozen during this time period. Many strong, and strange, low frequency events were spotted mainly when the swarm was hitting it's peak on December 29, 2008. They say they could not specify the type of fluid (magma or magmatic fluids) but the low frequency events seem to be indicative of a viscous fluid, like magma, resonating through an unknown catalyst (possibly via the dike itself). It does not appear fluids itself could have cause the strange LF events. Many different types of earthquakes occurred during this swarm including typical VT (volcano tectonic) quakes, hybrid quakes, and low frequency earthquakes.
The professionals in the publication even admit the following, "We also note that this unusual earthquake swarm may represent the first geophysical observations of a failed surficial hydrothermal‐volcanic event in Yellowstone. Moreover, the observed temporal‐spatial seismic and deformation pattern reflects the style of volcano‐tectonic activity that can be expected in the Yellowstone volcanic field and that could lead to triggering of larger earthquakes or volcanic eruptions in the future." So... Wow! Definitely the most interesting earthquake swarm Yellowstone has ever seen. Well, at least so far.
First I will show the map of Yellowstone Lake regarding these earthquakes during this swarm. I will then show the helicorders for the UTC days of December 27-30. Sadly, once the strange low frequency background "tremor" started to skyrocket as earthquakes started to decrease, LKWY went offline. However, other stations around the epicenter remained online. But out of all the data available, December 29 proved to be the most concerning day of this swarm. Remember this happened very quickly and also lasted a very short period of time. Can you imagine if this was a larger dike intrusion that could lead to an eruption? This swarm is a perfect example of what to watch out for prior to any type of volcanic eruption within the Yellowstone volcanic field. If this were magma, I doubt the eruption would have been large if it did breach the surface.
For the plots below, please remember to always pay attention to chart labels and any captions beneath any images. To delete background interference of microseisms, I added a high pass filter (all frequencies below the set filter were deleted). The lowest frequency magmatic movement is detected at is usually 0.5Hz and no lower, however low frequency events usually remain between 1Hz and 5Hz. Dates and channel labels will be posted and times are always in UTC. All images below were generated by me UNLESS otherwise specified. Most images will be posted in slide show format. You can pause any slide show in the top right corner and pass through the images one at a time in the top left corner. Please enjoy!
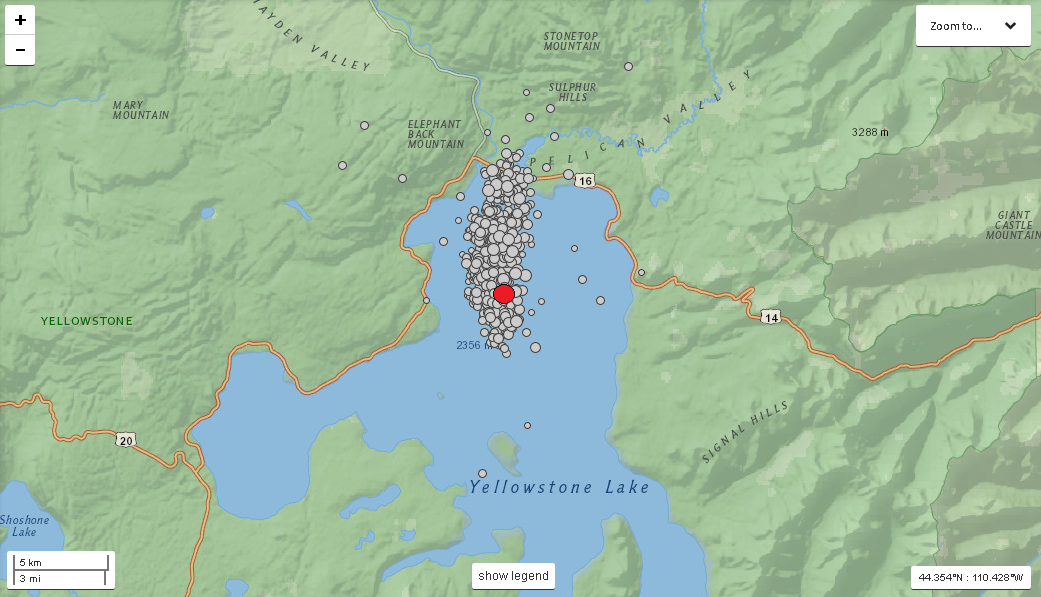
The 820 earthquakes during this swarm occurred in less than 7 days! The largest quake, M4.6, is marked in red. Even by looking at the formation of the earthquakes, it looks like an intrusion event.
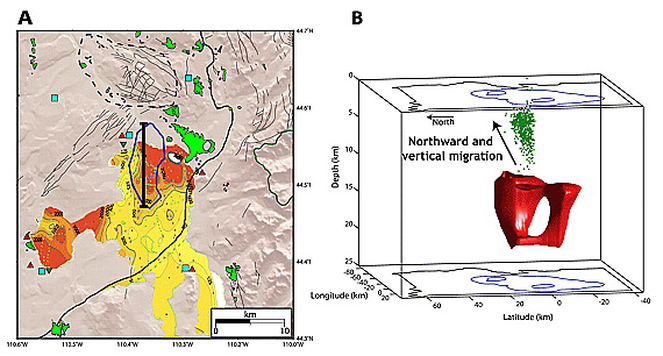
This image was NOT generated by me. This is figure 3 from the publication I linked in the beginning of this post. Notice the northward, and upward, migration of earthquakes? This amazingly visualizes how the dike intrusion was formed and from where. Please visit the publication to learn more about this swarm.
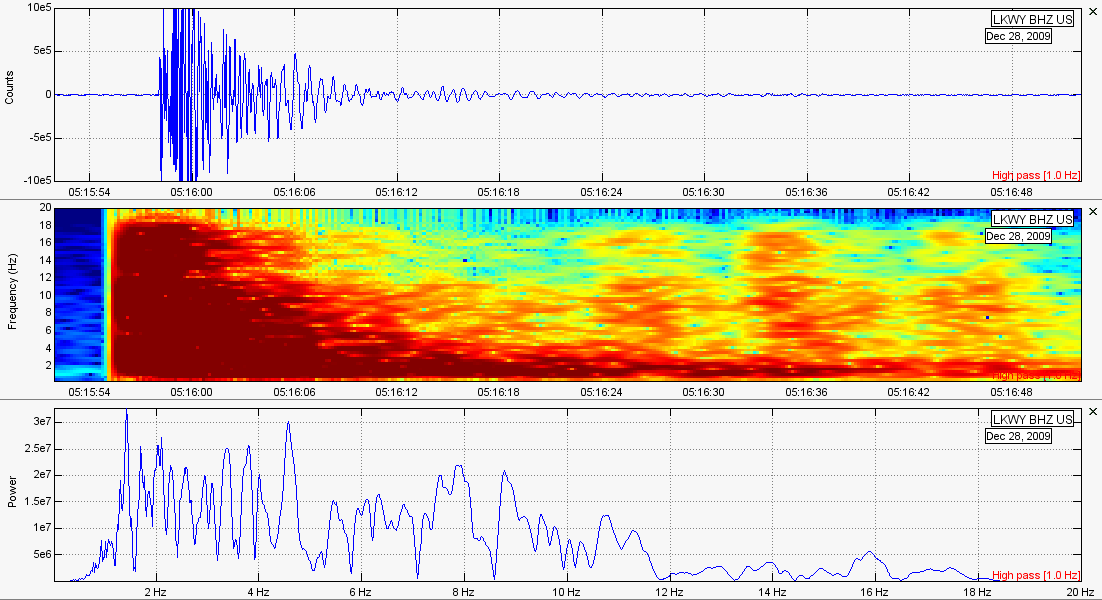
This M4.6 was the largest earthquake in the entire earthquake swarm. In the publication they stated this earthquake had a "50% tensile crack‐opening source determined by a full waveform inversion that we interpret as a magmatic expansion component." This means this earthquake was "explosive" in nature. Interesting to note that after this shallow "explosive" earthquake occurred, strange low frequency earthquakes increased significantly. It didn't increase right away, but I believe the increase was related to this "explosive" earthquake. It was reportedly a M4.6 at 0.3km in depth. USGS also reported a M3.9 at 5.0km in depth at the same exact time this "explosive" earthquake occurred. This plot here shows the two earthquakes that occurred at the same exact time. One was deeper, at 5.0km, and just 1 second later the M4.6 occurred at 0.3km in depth. Again, they state they believe this was a "magmatic expansion component".
RESOURCES:
Here are some resources to this earthquake swarm. First off, the professional publication was the first link on this page (all the way at the top). Below is the link to the USGS EQ map of this swarm. Remember, there were many events that were not reported during this swarm (typically ones smaller than M1.0 because there were simply too many). The data download links below are NOT from my computer. They come straight from the IRIS database and are guaranteed to be virus free. Regardless, you can use the pages under the "How To" menu to learn how to find, access, and download seismic data. You can also use that menu to find out how to use the program SWARM. In my opinion, SWARM is the best tool for analyzing events.
USGS EQ map: CLICK HERE
LKWY data for 2008-12-27: http://service.iris.edu/fdsnws/dataselect/1/query?net=US&sta=LKWY&loc=--&cha=BHZ&starttime=2008-12-27T00:00:00&endtime=2008-12-28T00:00:00&format=miniseed&nodata=404
LKWY data for 2008-12-28: http://service.iris.edu/fdsnws/dataselect/1/query?net=US&sta=LKWY&loc=--&cha=BHZ&starttime=2008-12-28T00:00:00&endtime=2008-12-29T00:00:00&format=miniseed&nodata=404
LKWY data for 2008-12-29 (the day those LF events struck): http://service.iris.edu/fdsnws/dataselect/1/query?net=US&sta=LKWY&loc=--&cha=BHZ&starttime=2008-12-29T00:00:00&endtime=2008-12-30T00:00:00&format=miniseed&nodata=404
LKWY data for 2008-12-30 (most of this day is unavailable since the monitor went down): http://service.iris.edu/fdsnws/dataselect/1/query?net=US&sta=LKWY&loc=--&cha=BHZ&starttime=2008-12-30T00:00:00&endtime=2008-12-31T00:00:00&format=miniseed&nodata=404
Remember the following plots will be shown in slide show format. You can pause/play the slideshows in the top left corner and sift through the images using the arrows in the top right corner. Saving any images will deteriorate the image quality. To gain these images, please feel free to email me at any time.
Helicorder plots for December 27-30, 2008:
For the plots below, remember all times/dates are in UTC. That means you can go to the USGS EQ map linked above under "Resources" on this page and then compare the dates/times of any event to see if they were reported or not.
Very strange low frequency earthquakes (note the high frequency onsets):
Strange emergent tremor events (possible volcanic tremor?):
A few possible hybrid earthquakes from this intrusion event: