CLICK HERE to see an overview of the 2018 Kilauea/LERZ eruptions. LERZ simply means "Lower East Rift Zone", where Leilani Estates and other towns experienced heightened volcanic unrest and, eventually, volcanic eruptions. If you wish to see an in-depth, day by day detail of the eruptions then please CLICK HERE. That will bring you to the archive search for volcano updates issued by volcano observatories. Make sure the observatory is set to Hawaiian Volcano Observatory, make sure the volcano is set to Kilauea, and fill in the appropriate date/time for the time period you wish to see (eruptive changes began late-April 2018 and ended around late-August 2018).
In late-April 2018, volcanic activity at Kilauea Caldera in Hawaii increased significantly. The ever popular lava lake in Halema’uma’u crater, which resides inside of Kilauea, began to overflow. This, along with the large increase of seismicity, was the first signal that something was changing on the Big Island. Late in the day on April 30, the crater of Pu’u ‘O’o, a volcanic cone caused by Kilauea’s eruptive rift zone some time ago, began to collapse (plots shown below). Once the collapse happened, the lava lake at Halema’uma’u also began to drain. It took a few days but it eventually drained out of sight as magma withdrew to the east to feed the coming effusive eruptions at Leilani Estates.
Once that happened, the magma at Kilauea continued to withdraw and started interacting with the water table. According to USGS, this is what caused the explosive eruptions we saw at Kilauea. From late-April 2018 to early-August 2018, around 62 explosive eruptions occurred at Kilauea. Near the end of this page, I show plots for 8 of those eruptions. Seismic activity would build until it reached a critical point releasing the strain via an eruption "earthquake".
Also shown, at the end of the page, are plots proving some of the volcanic eruptions were so strong that they were barely detected by seismic stations along the West Coast of the United States.
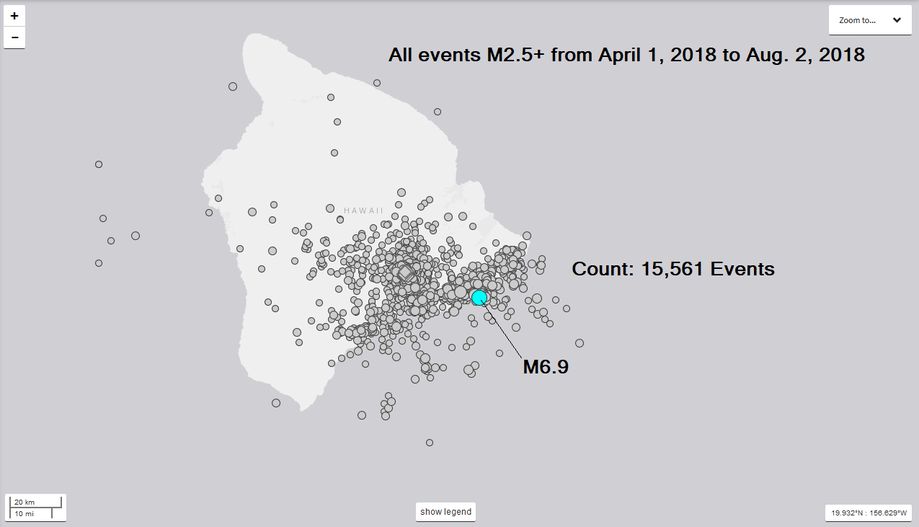
Now, once the magma started shifting towards the LERZ, seismic activity increased. On May 4, 2018, a M5.7 earthquake struck SSE of Pu’u ‘O’o. Only 1 hour later a large M6.9 struck at a shallower depth than the M5.7. These two earthquakes are what kicked everything into motion. Once the earthquakes occurred, massive fissures started opening in Leilani Estates and the surrounding area. Approximately 24 fissures was the total count during all of the eruptive activity. Fissure 8 even reactivated, later creating a very tall cinder cone measuring taller than 180 feet! Many people were displaced and sickened by volcanic gas. As the eruptions calmed, nobody was killed. 24 people were injured and hundreds upon hundreds of homes were destroyed causing around $800 million in damages. It is the most expensive volcanic disaster to strike the United States since the 1980 eruption of Mt. St. Helens in Washington State.
As of early-September 2018, eruptive activity has completely stopped. According to HVO, magma is currently refilling under the Middle East Rift Zone, the Kilauea summit, and the Mauna Loa summit. Mauna Loa is currently experiencing heightened volcanic unrest. Stay tuned to USGS/HVO for important updates regarding potential eruptive activity at Mauna Loa at volcanoes.usgs.gov. Please remember to always read chart labels and pay attention to any captions beneath any images. Any slideshows you see can be manipulated using the arrows in the top right corner.
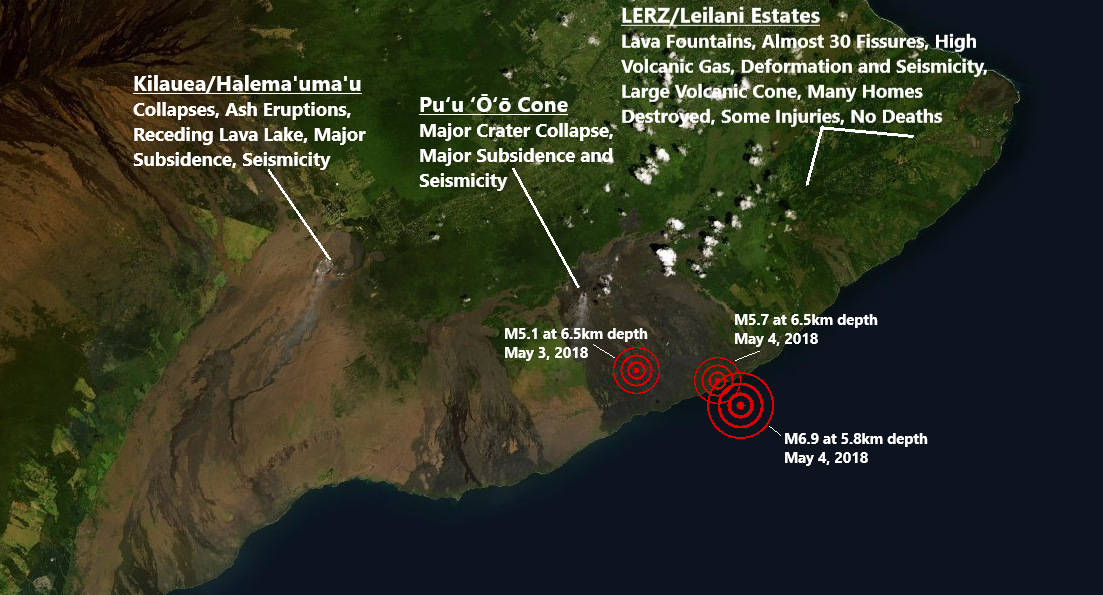
The satellite image directly above shows the east-southeast tip of the Big Island of Hawaii. You can see three volcanic areas of interest labeled: Kilauea Caldera, Pu'u 'O'o, and the LERZ/Leilani Estates area. Also shown in the image above are the locations of the M5.1, M5.7, and M6.9 that occurred during the beginning of the eruptive activity. These were the 3 largest earthquakes of the entire 2018 Kilauea/LERZ eruptions.
Regarding the seismic plots on this page, you can always CLICK HERE to discover the location of any seismic station on the Big Island of Hawaii. Also, I will always attempt to use the closest seismic station possible.
Regarding the seismic plots on this page, you can always CLICK HERE to discover the location of any seismic station on the Big Island of Hawaii. Also, I will always attempt to use the closest seismic station possible.
Three Largest Quakes of the 2018 Eruptions
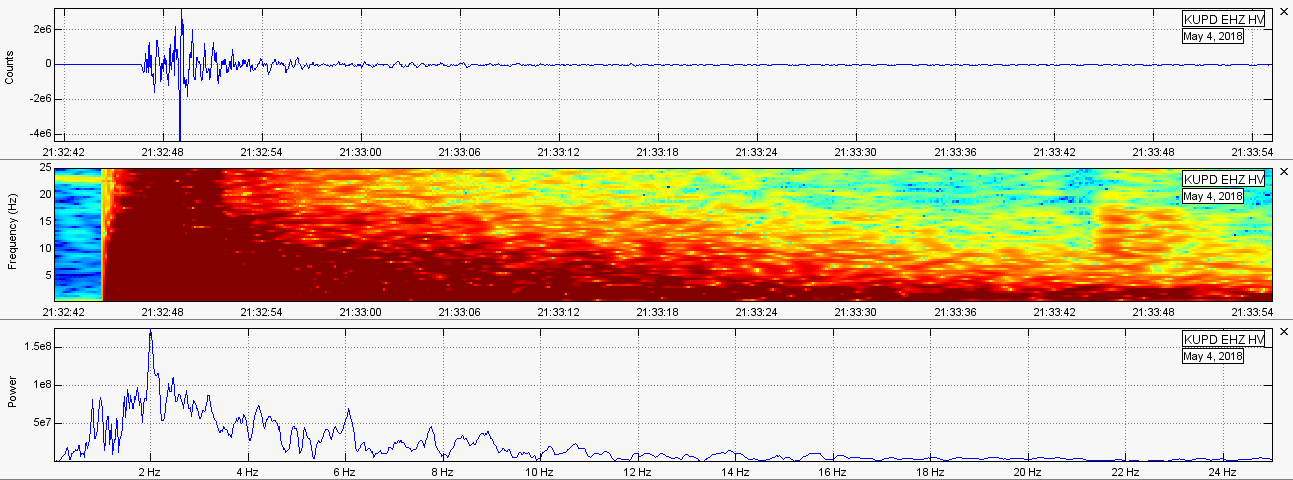
Below is the tectonic summary of the M6.9 earthquake which was updated by USGS/HVO on September 8, 2018:
Crater Collapse at Pu'u 'O'o
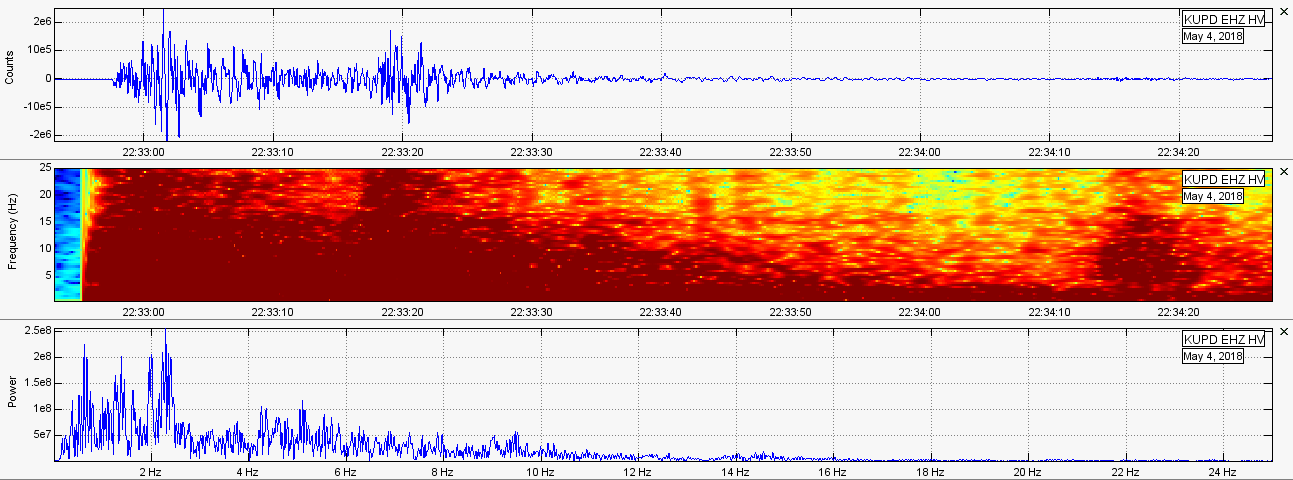
In the evening of April 30, 2018, Puʻu ʻŌʻō began a large collapse sequence. It lasted for many hours and was detected on numerous seismic stations around the area. This collapse was caused by the withdrawal of magma, and the subsequent subsidence, from the Kilauea and East Rift Zone systems which was to feed the LERZ fissure eruptions in the coming days and months.
Below I will show plots of the collapse itself from two stations: JCUZ and NPOC. Both stations reside just a few hundred meters of Puʻu ʻŌʻō, on either side of the cone. But first, take a look at the GIF image directly below. Speed has been enhanced greatly since this collapse occurred over a period of hours. Credit goes to Hawaii247com and USGS/HVO:
Below I will show plots of the collapse itself from two stations: JCUZ and NPOC. Both stations reside just a few hundred meters of Puʻu ʻŌʻō, on either side of the cone. But first, take a look at the GIF image directly below. Speed has been enhanced greatly since this collapse occurred over a period of hours. Credit goes to Hawaii247com and USGS/HVO:
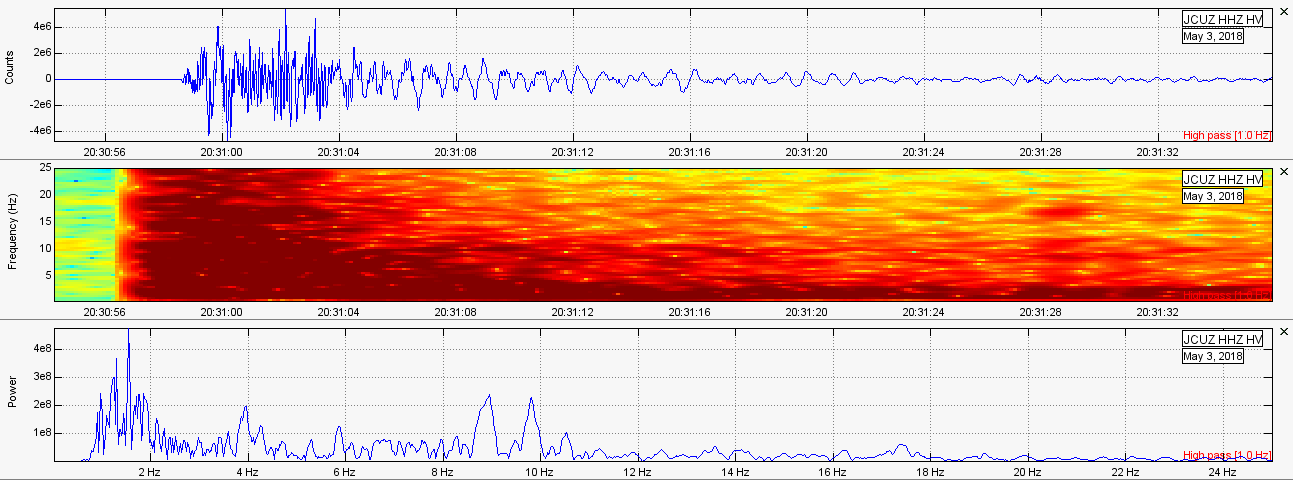
Below you can clearly see the time of increased activity due to the collapse of the floor of Puʻu ʻŌʻō. Times on the left of the heliplots are in Hawaiian Standard Time for easier identification. Notice how it showed on both surrounding stations.
|
Here is the seismic audio of the collapse from station JCUZ. Audio was obtained using the IRIS Time Series tool. The following is 3 hours of seismic data compressed into 2 minutes and 15 seconds of audio. Headphones suggested but be wary of the volume.
|
Plots of Puʻu ʻŌʻō Collapse From JCUZ:
Volcanic Eruptions at Kilauea Caldera
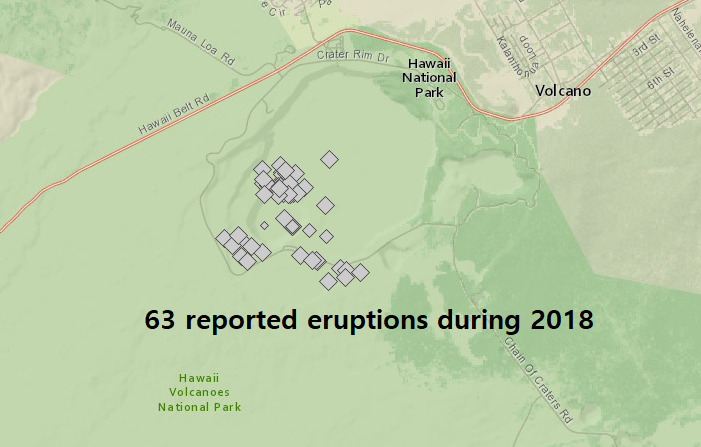
As you can see via the image below, there were numerous volcanic explosions from Kilauea/Halema'uma'u during the 2018 eruption cycle. Almost all of these eruptions were reported by USGS/HVO as volcanic eruptions with the energy being released equal to a M4.7-M5.4 earthquake. These eruption "earthquakes" were caused by magma shifting and interacting with the local water table causing explosions that dispersed ash around Hawaii Volcanoes National Park.
You can see the reported events on the map image below. Click the button directly below the image to see this interactive USGS map yourself.
You can see the reported events on the map image below. Click the button directly below the image to see this interactive USGS map yourself.
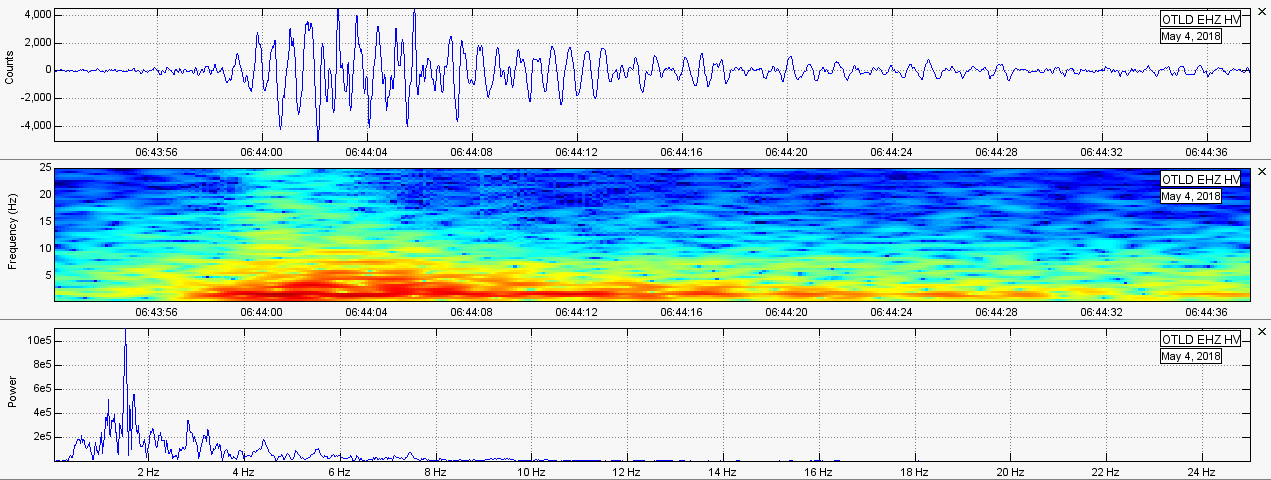
Here will be shown seismic plots and heliplots of 10 select Kilauea eruptions during the 2018 eruption cycle. Station OTLD will be used, which resides right near the rim of Kilauea. Each heliplot and 3-plot image will be numbered to make correlation of these events easier. But first, take a look at the image below. Those are plots of the first reported explosion at Kilauea which occurred at 06:43UTC on May 4, 2018.
This was reported as a M1.9 "Chemical Explosion" within Halema'uma'u Crater. Could this have been the first explosive eruption in 2018? If so, it was very minor compared to those which would follow in the coming days and months.
Seismic Buildup Prior to Eruptions
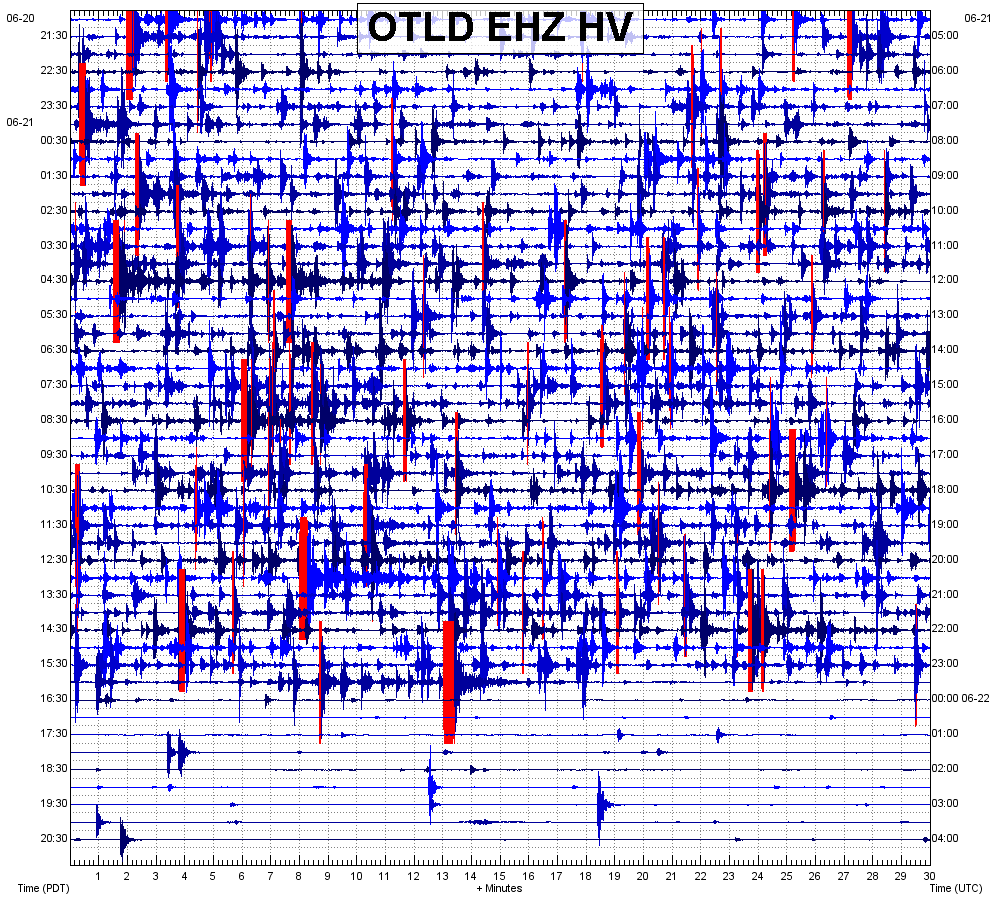
As volcanic activity increased at the Kilauea summit, there was a buildup of seismic activity 24-36 hours prior to each eruption. After an explosive eruption would occur, seismic activity would quiet for a few hours and then pick up again. This cycle continued throughout the 2018 eruptive period.
Below is a helicorder plot from OTLD. You can clearly see the buildup of seismic activity prior to the eruption.
Below the helicorder is the audio from this day. The audio was sped up greatly: 24 hours compressed into 9 minutes and 36 seconds. You can really hear the activity intensify around the 07:20 mark. The eruption is at the 07:41 mark on the audio. Notice how calm it is after the eruption occurs? Please use your headphones for the audio but be wary of the volume just in case!
Below are helicorder plots and seismic plots of 8 select volcanic explosions which occurred within Halema'uma'u at Kilauea. You can clearly see the buildup of seismic activity prior to each eruption. Helicorder plots and seismic plots have been numbered so you can correlate the two.
Kilauea Eruptions Detected Thousands of Miles Away
Surprisingly, some of the volcanic explosion "earthquakes" at Kilauea were strong enough to be detected thousands of miles away. I will show 3 select events from OTLD, near Kilauea, and NLWA, on the West Coast of the USA in Washington State. You can tell these were definitely the Kilauea eruptions based on a few simple characteristics:
1. Whenever a strong eruption "earthquake" occurred at Kilauea, there would be a weak but detectable teleseismic event approximately 18 minutes after each eruption. Each time it would take around 18 minutes to reach the West Coast of the United States.
2. No other global earthquake could account for each and every teleseismic signature during those time frames, initially indicating the source was Kilauea Caldera.
3. Very low frequency activity, within the teleseismic range, would increase 18 minutes after each eruption and rise above the normal background microseisms detected on station NLWA. A clear pattern was starting to emerge.
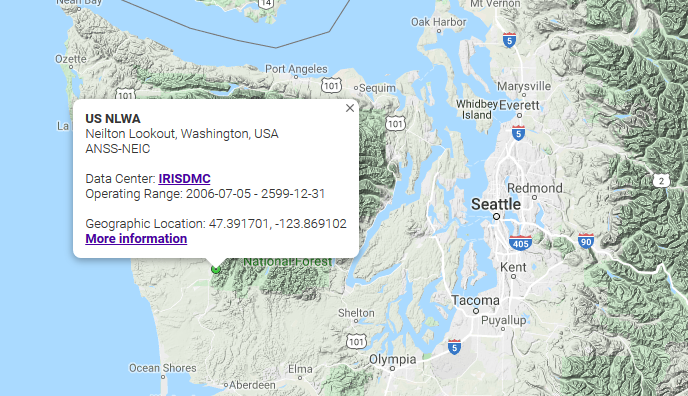
You can see 3 slideshows below. Each one shows the eruption and Kilauea and teleseismic signature of each eruption 18 minutes later on station NLWA. You can also see the location of NLWA in the image below, which resides ~2,620 mi (~4,216 km) from Kilauea Caldera.
