 This M3.2 earthquake was the largest in the swarm. Taken from AHID BHZ. On September 21, 2018 A short lived earthquake swarm broke out near Montpelier and Soda Springs, Idaho. This location is near the epicenter of the massive late-2017 Soda Springs earthquake swarm which I have always theorized to be related to magma in some way. I mean the magnitudes were off the charts! At its peak, multiple 3.0s and 4.0s shook the area frightening all those that live in the area. We will real quick look at today's swarm and show some data. Please click "read more". 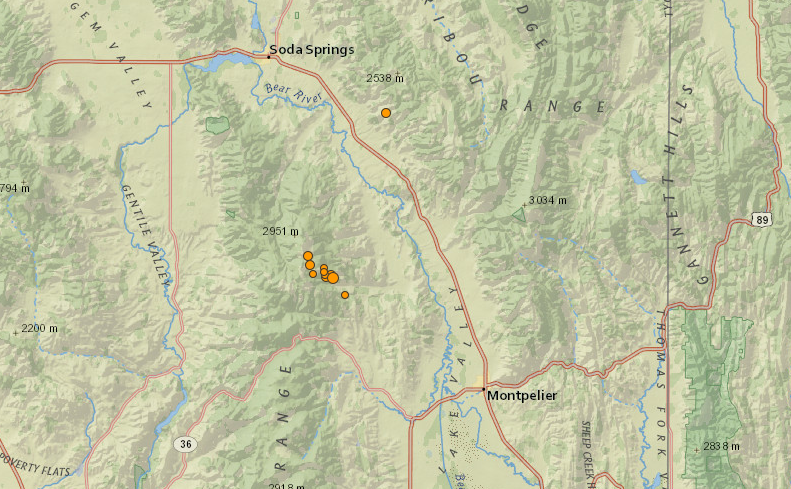 As you can see above, the earthquake swarm today, which lasted from about 5:11UTC to 14:45UTC 2018/09/21, occurred right between Soda Springs and Montpelier, Idaho. Using three seismic stations (AHID BHZ, HWUT BHZ, and REDW BHZ) and cross correlating earthquake arrivals using the program WAVES, I deducted there were a maximum of 17 earthquakes within this time period. So, it looks like whoever located the earthquakes did a pretty good job. Most of the earthquakes were locatable. As I went through the data, some of which you will see in a second, I didn't notice anything indicative of possible volcanic activity. I am not saying I didn't miss something, just that no signals were detected that could indicate possible volcanic activity. However due to the close proximity to the epicenter of the 2017 Soda Springs swarm, one I have always suspected was a case of magma injection, it is good to keep all options on the table until one is disproven. Also, none of the earthquakes in the swarm happened in close rapid succession. Fast paced rapid succession micro quake swarms are something we have been seeing alot over the past few years at West Thumb Lake within Yellowstone caldera. Below is some data from today's Idaho swarm. Since saving images from my website are not the originals, you can email me any time to retrieve this data for yourself. Or you can simply CLICK HERE for a file download of seismic data retrieved from this event. The earthquakes seemed to be typical high frequency earthquakes. Some of the codas (end tail of an earthquake), however, seemed to be elongated just a bit more than usual especially one specific event shown below. The reason for this is unknown. Since station AHID BHZ picked up the arrivals of the earthquakes the best, I will be using that station for any seismogram/spectrogram plots shown below and the analysis images will have a 0.6HZ High Pass filter. Please also remember to read the captions of the images! All images were created by me using data from IRIS/USGS and the seismic program SWARM. Goto the "more" drop down menu to find the downloads and "how-to's" of seismic programs I use everyday. The "how to" menu even shows you how to download seismic data. Remember you can always email me if you need anything! 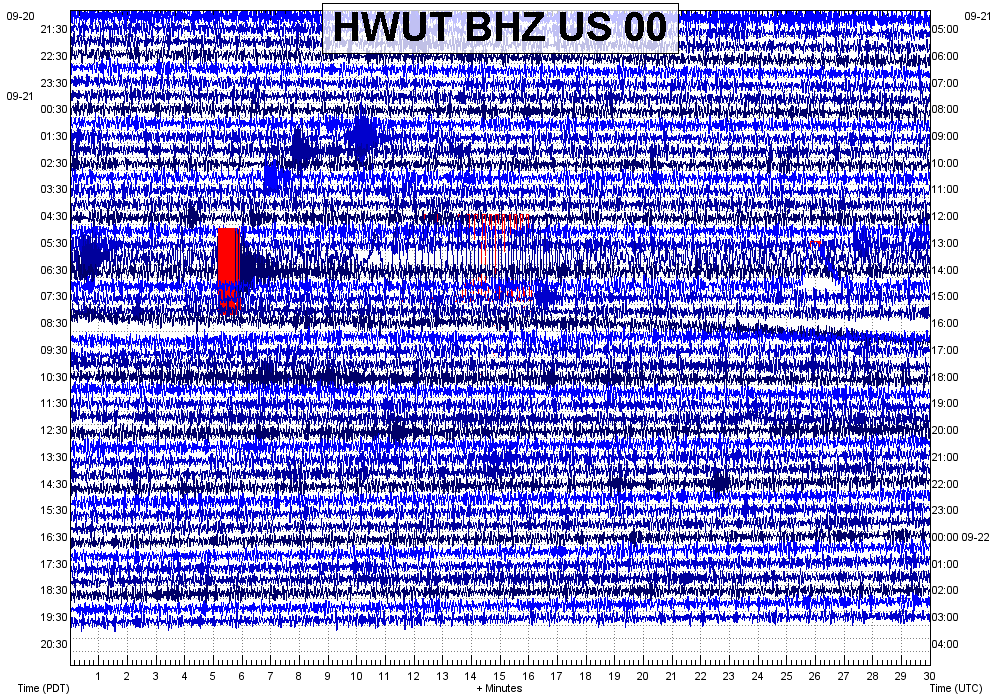 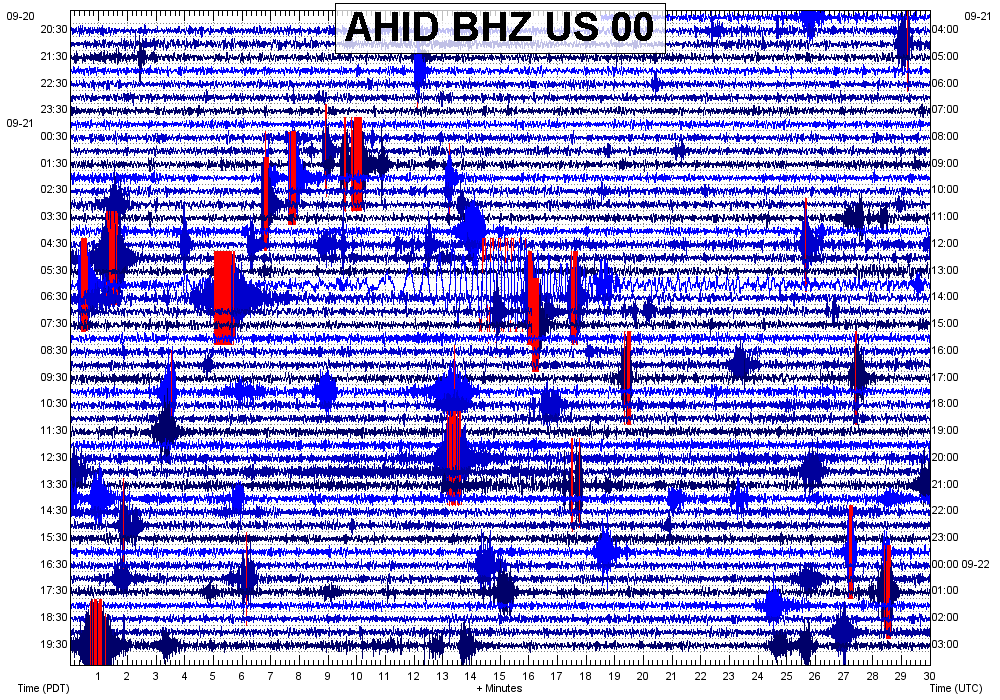 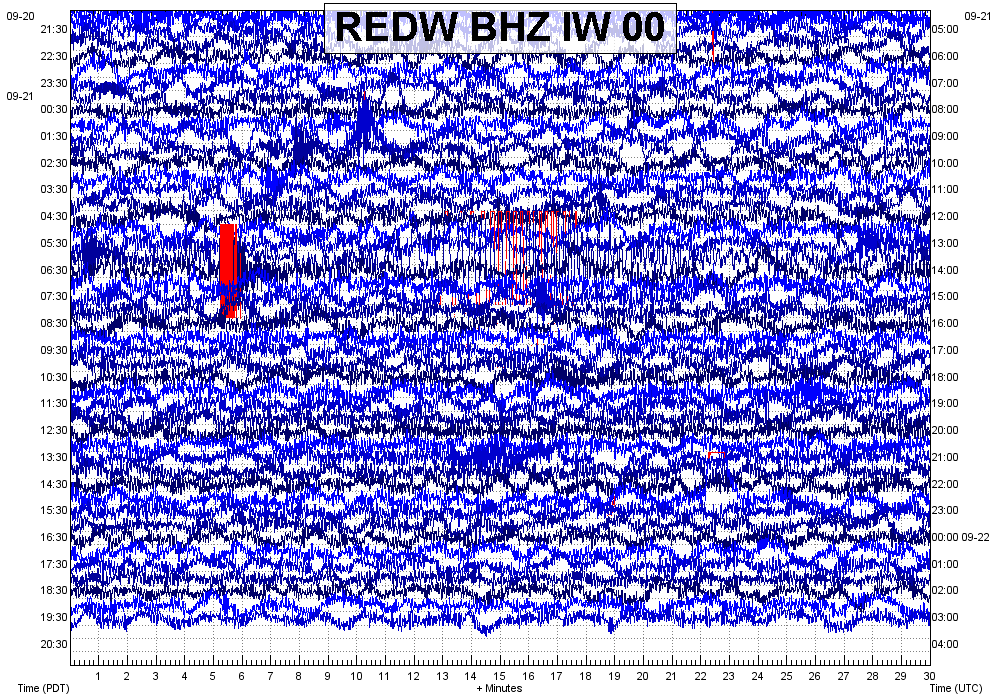 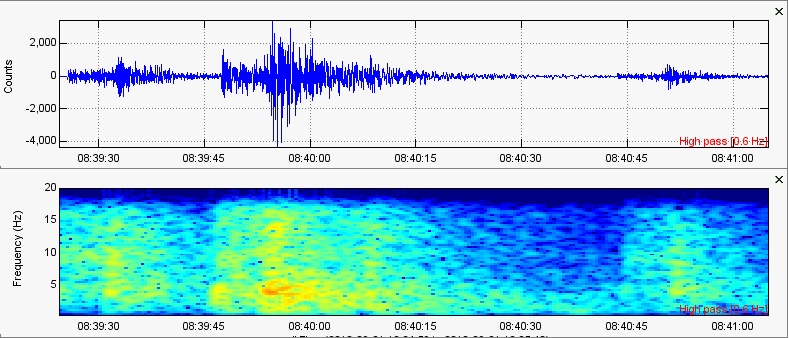 AHID BHZ: 3 earthquakes in 1 1/2 minutes. The fastest pace during this swarm. Still doesn't come close to the fast paced swarms West Thumb, Yellowstone is capable of!!! 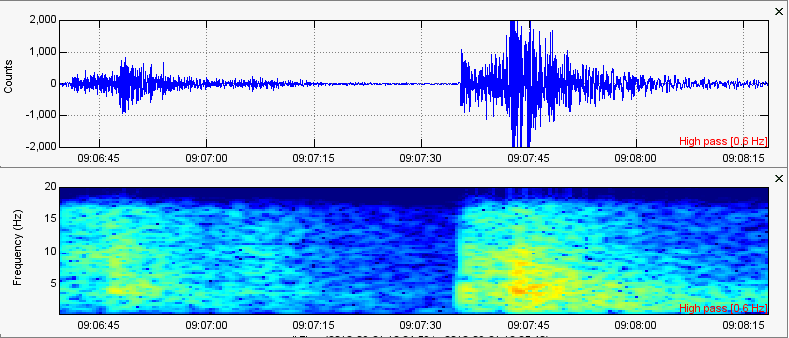 AHID BHZ: Two earthquakes appear in about a 1 1/2 minute time frame. Still carry high frequency characteristics. 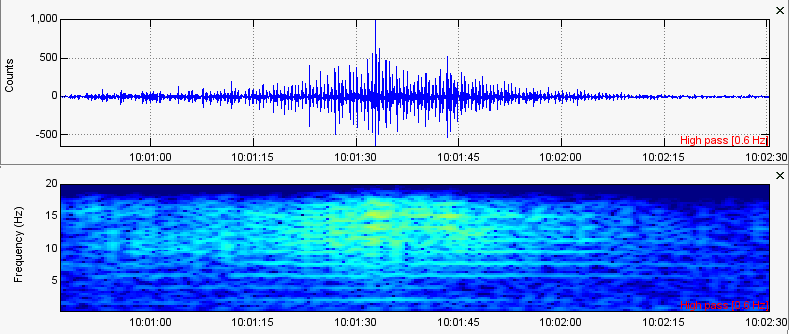 I know this is not an earthquake, but even though it barely shows on the surrounding stations you can tell it has high frequency harmonic characteristics shown on the spectrogram. Very odd!!! 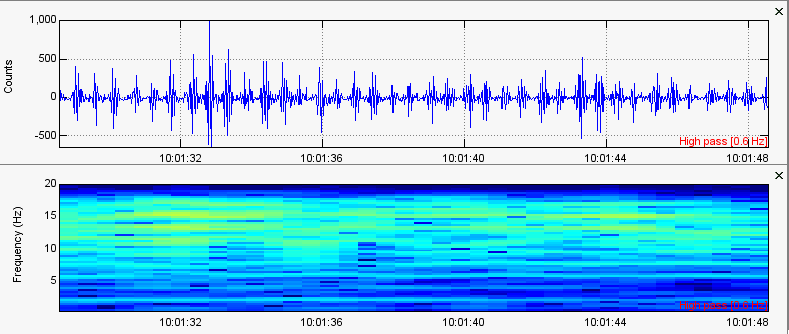 A closer "zoomed-in" look at this very peculiar event. Almost looks like a heartbeat, doesn't it? 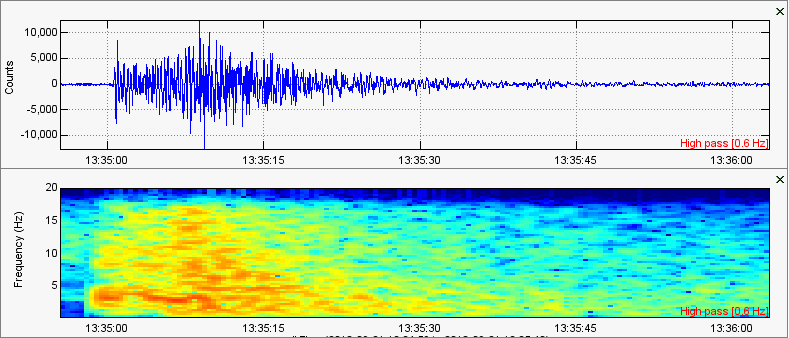 The largest event in the swarm was this one, a magnitude 3.2 earthquake at 11km in depth. 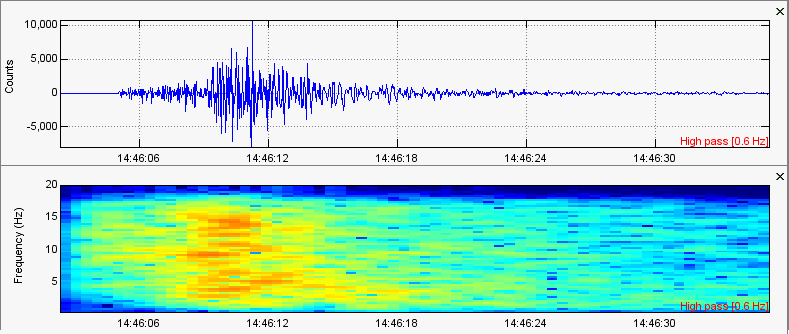 And here is the last earthquake of the swarm. It was reported to be a magnitude 2.3 at 1.9km in depth.
0 Comments
Leave a Reply. |
AuthorBen Ferraiuolo is a fast learner and someone who will always stand for the truth. Visit "About Me" for more! Archives
November 2019
Categories |
 RSS Feed