This page is an updated version of my old "Earthquake Examples" page. This page will show you one example for almost every type of seismic event you will come across to sort of help you understand what to expect and what to look for when analyzing events. I will show the examples via the main seismic plots people use: seismogram, spectrogram, and spectra plots. Please keep in mind that the characteristics of these events vary from event to event, station to station. Don't forget the pages under the "How To" menu which will teach you everything you need to know.
When reading the plots below, please always pay attention to time period and frequency range. In other words, always read labels first before reading the data.
Descriptions are given above each image. All plots were created by me using data from either the IRIS or NCEDC DataSelect URL builders and with the seismic program SWARM. Date/time code is in UTC format for the plots.
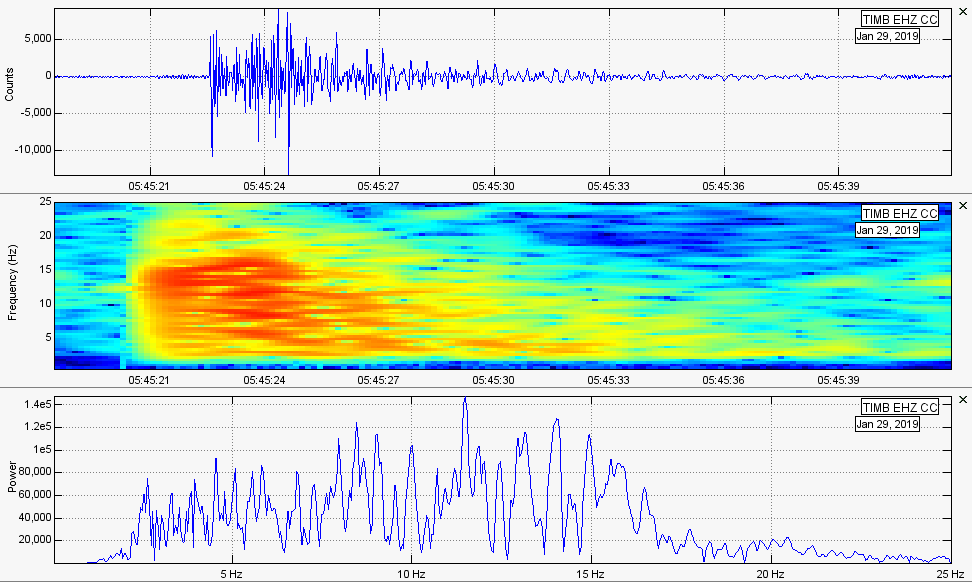
-High frequency VT (volcano-tectonic) earthquake: These are earthquakes that appear to be "normal" tectonic events, but occur directly under or very near volcanoes. They can be caused by volcanic, hydrothermal, or tectonic processes (sometimes even rock fractures or failures within the volcano). These are usually the #1 most common earthquake you will run across while monitoring volcanoes. These events are part of normal background seismicity for volcanoes worldwide. This event was a magnitude 1.8 VT quake at 3.1km in depth directly under Mount Hood in Oregon (2019-01-29 at 5:45UTC).
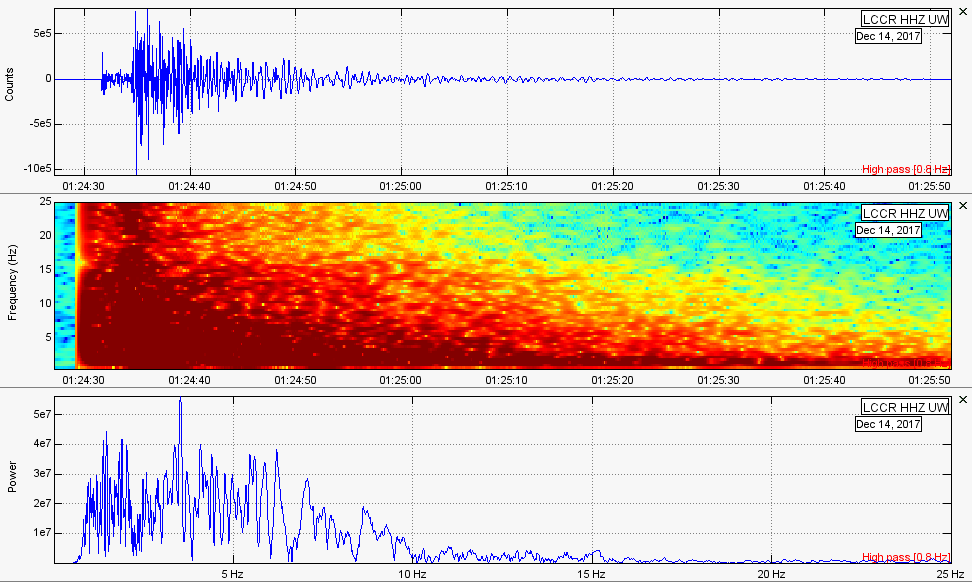
-High frequency tectonic earthquake: These events are "normal" tectonic events. They occur no where near volcanoes, otherwise they would be labeled as VT quakes. These are caused by failures and ruptures along tectonic faults. This type of event is the most common earthquake in the world. Just like VT quakes, tectonic quakes have strong frequencies higher than 10Hz. If you see an event occur with most frequencies resting below 5Hz-10Hz, it is likely a low frequency event (next event shown) or a teleseismic signature. This earthquake shown here is a magnitude 4.0 at 17.4km in depth just 12km S of Molalla, Oregon (2017-12-14 1:24UTC). Although it shows dominant frequencies below 10Hz, we see some very strong frequencies surpassing even 25Hz.
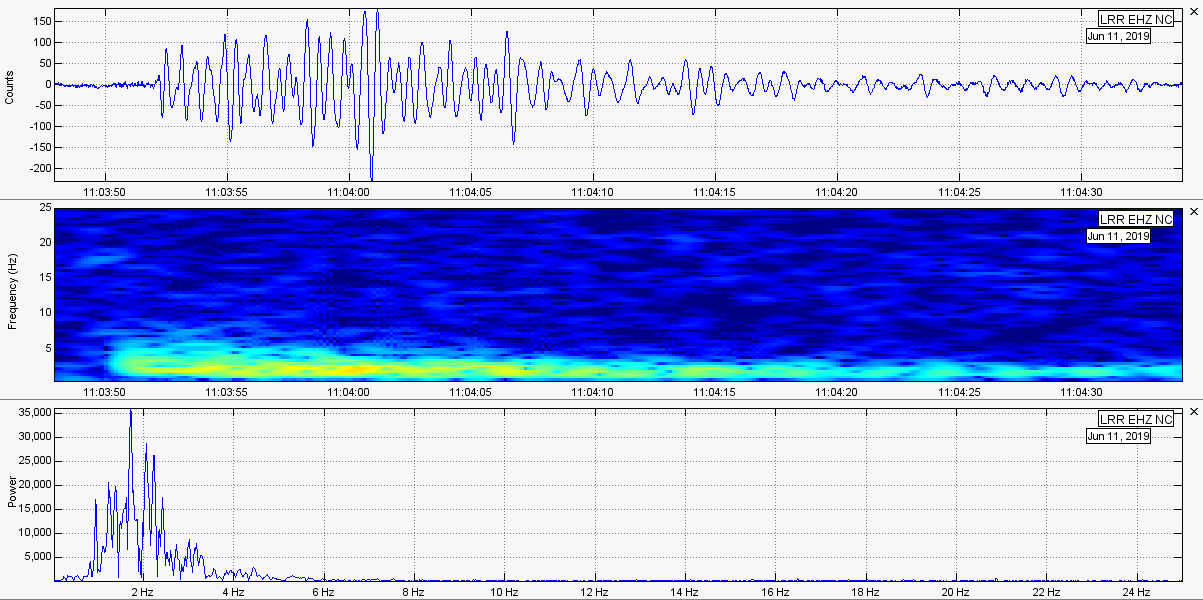
-Low frequency earthquake: These are one of my favorite seismic events to analyze. Low frequency earthquakes, also referred to as long period earthquakes, typically have dominant frequencies below 5Hz, with weaker frequencies showing strength to 10Hz or so (depending on the process). Low frequency earthquakes can be caused by a multitude of processes but are usually caused by volcanic processes. Newberry Caldera in Oregon has been notorious for these low frequency events the past couple years, with a few of these popping up around Lassen Volcanic Center in June 2019. The following is a M1.7 low frequency earthquake at 15.7km in depth just barely to the west of Lassen Volcanic Center in Northern California. Note the much lower frequencies shown on the spectrogram and spectra plots compared to the high frequency events previously shown. Dominant frequencies are between about 1-2Hz, with some weak frequencies not surpassing 6-7Hz.
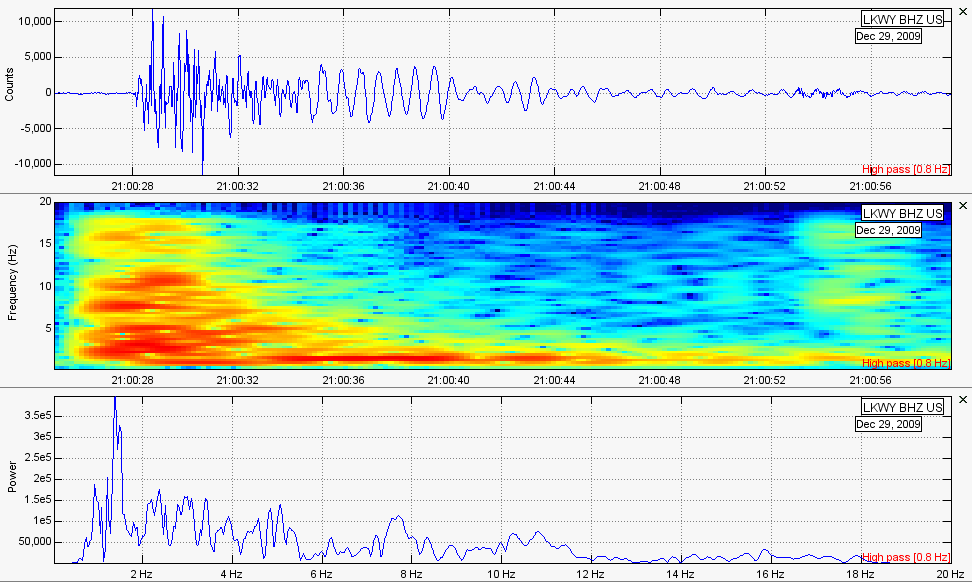
-Hybrid earthquake: Now this type of event is odd and, at least in my experience, does not happen as often as low frequency and high frequency events. Hybrid events usually contain normal high frequency characteristics at the beginning, just like a tectonic event, but also contain very strong lower frequencies near the end of the event (usually too low, too soon, and too strong to be due to simple Love or Rayleigh waves). I had a hard time trying to find an example, but I found a good one. This was taken on December 29, 2009 during the infamous 2008-2009 dike intrusion of magma under the northern tip of Yellowstone Lake (page under "Seismic Events" menu). The station which recorded this event, LKWY, is right at the epicenter of this event.
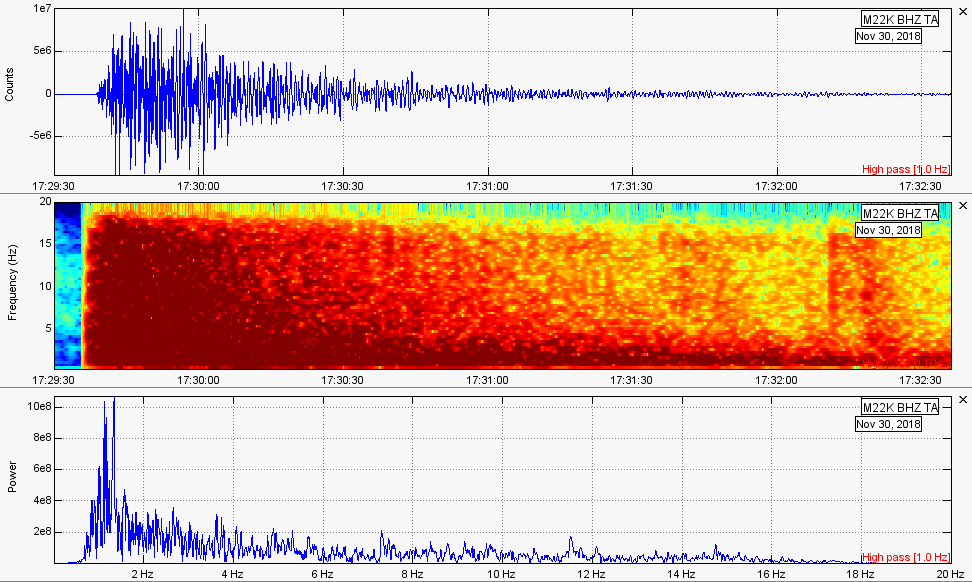
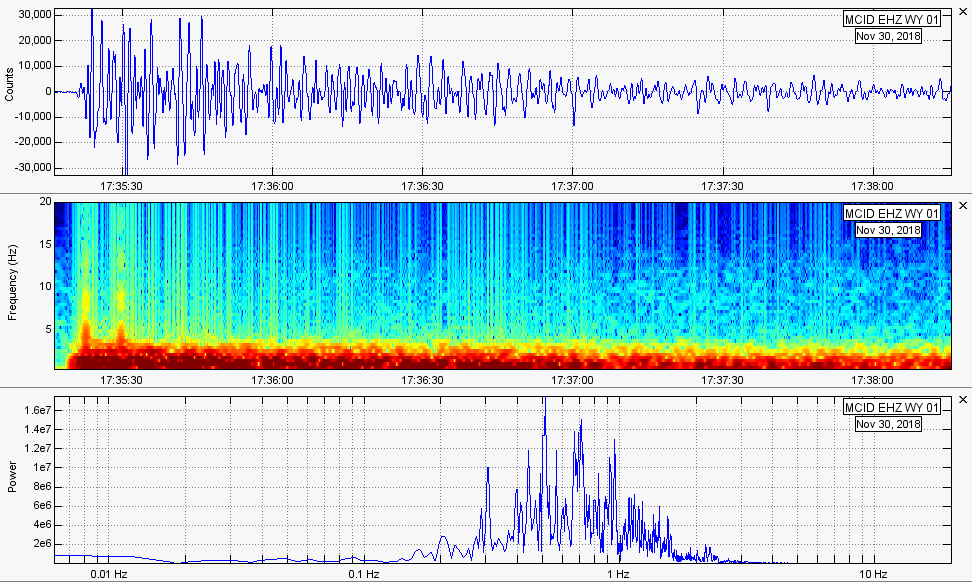
-Teleseismic signature: Now this one is tricky and can fool people into thinking a low frequency earthquake occurred. However characteristics are usually different but can trick the eye. A teleseism is a seismic signature recorded on a seismic station at a distance of 1,000km or more from the epicenter of the earthquake in question. It typically only occurs with magnitudes exceeding M5.0 and above. Frequencies are usually quite low, with the onset of frequencies beginning much lower than actual local low frequency events. For this example, I had to pick a large earthquake and then find it's signature on a station at a distance of 1,000km or more from the epicenter. Remember, local earthquakes are those that occur no more than 100 miles or so from the station that recorded it (rough estimate). Regional earthquakes are those that occur farther away, but still less than 1,000km away. So it goes like this: Local > Regional > Teleseism. For this example, I used the M7.1 at 46.7km in depth that struck just 14km NNW of Anchorage Alaska on November 30, 2018 at 17:29UTC. The earthquake from one of the closest stations is shown first and then the teleseism is shown after.
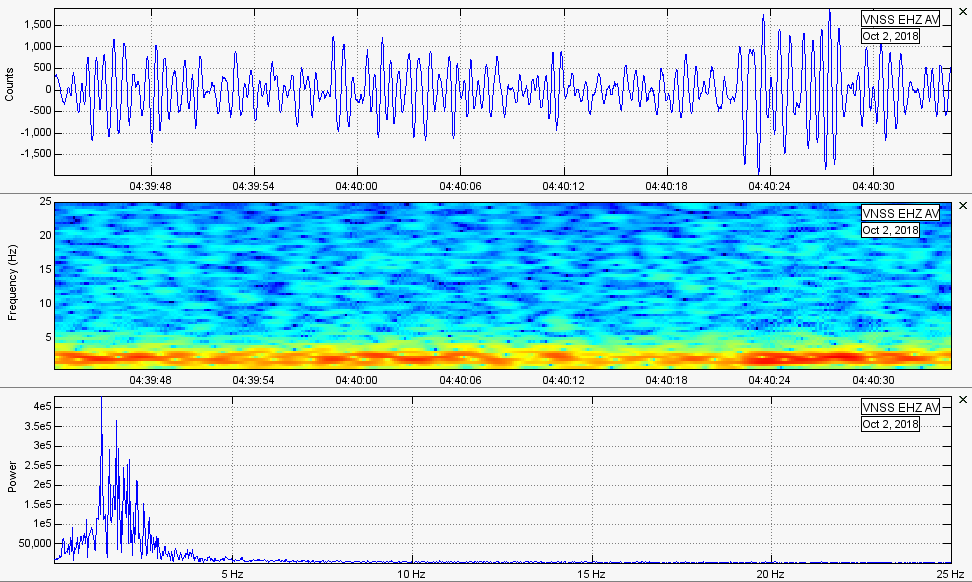
-Volcanic tremor: Harmonic tremor is likely the most well known volcanic signal that people talk about. It is important, yes. However, I have seen volcanoes erupt without moderate to severe harmonic/volcanic tremor. Harmonic tremor is a type of volcanic tremor, and seems to be related to the underground movement of magma, possibly detecting the free flow of unrestricted magma either in a lava tube or underground "tunnel". Volcanic tremor carries frequencies almost exactly like that of low frequency earthquakes, but is usually emergent and can last days, months, or even in rare cases years! Harmonic tremor also carries very rhythmic waveform oscillations. Volcanic tremor is theorized to be caused by low frequency earthquakes occurring so fast that they cannot be separated by the eye. However, many other causes remain and volcanic/harmonic tremor causes are still greatly debated to this day. Regardless of this, here is an example of volcanic tremor and what it usually looks like. Dominant frequencies of volcanic tremor usually are between 0.5Hz and 5Hz. However, 0.5Hz is pretty low for any harmonic/volcanic tremor to start at. This example was taken from the Veniaminof volcano in Alaska during eruptive activity on October 2, 2018.
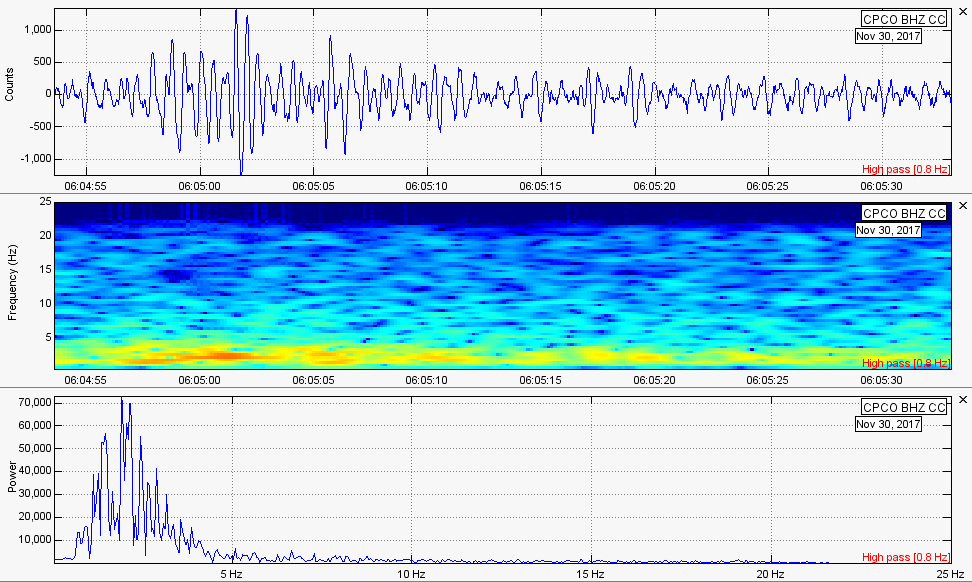
-Deep long period events: Now these events are absolutely amazing to study. First off, CLICK HERE to visit an amazing publication about DLP events. DLP events, as stated in the publication, were not detected at Newberry during the time of research conducted. However, the following example is from 2017 and is definitely a DLP event. DLP events typically occur near volcanoes and are always associated with the underground movement of magma, possibly horizontally along local fault systems. They usually occur deeper than ~18km in depth and sometimes have slight high frequency onsets (beginnings), but still are very similar to low frequency earthquakes. Remember, low frequency earthquakes can also sometimes be referred to as long period events. These DLP events are very fun to analyze! This DLP, reportedly a M1.0 at 23.4km in depth, occurred only 3km north of Newberry Caldera in Oregon on November 30, 2017 at 6:04UTC.
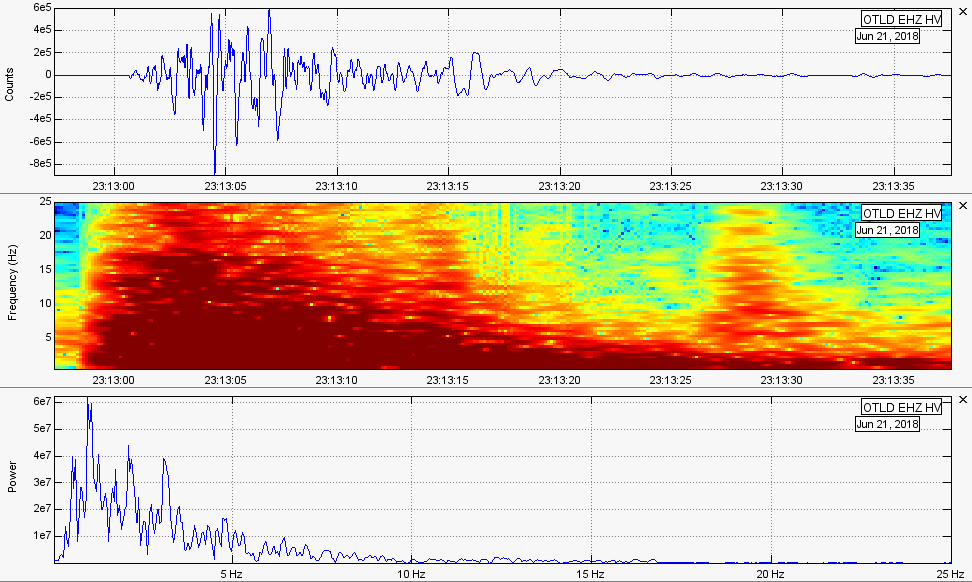
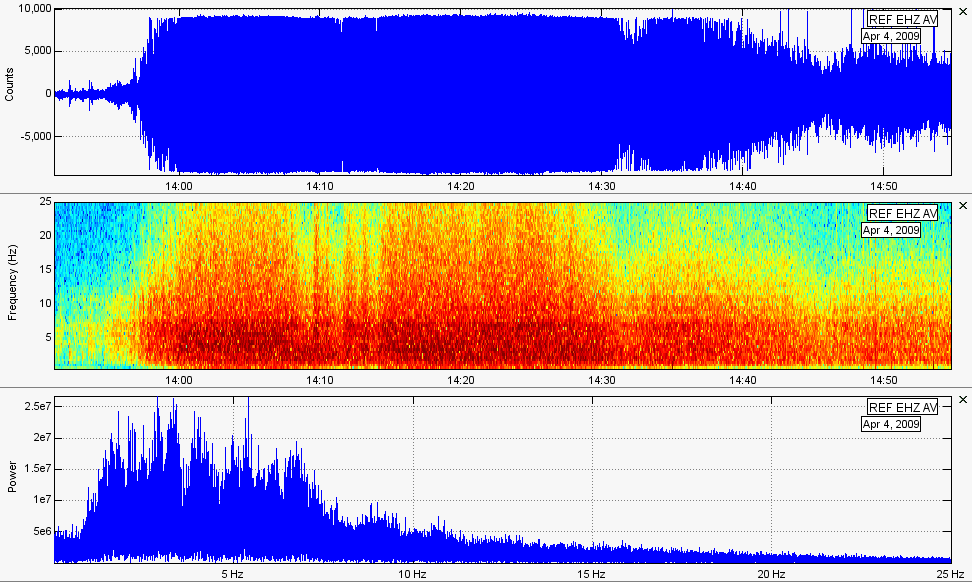
-Volcanic eruption: For the following example, I will show 2 distinctly different volcanic eruptions. Volcanic eruptions and explosions can look drastically different from volcano to volcano, as seen below. The first example I will show is one of the volcanic eruptions at Kilauea during the 2018 Kilauea/LERZ eruptions. For the Kilauea example, this one eruption took place on June 21, 2018 at 23:12UTC. During the 2018 Kilauea/LERZ eruptions, over 60 of these eruption "earthquakes" took place with each eruption releasing enough energy to be detected as a M5.3 or M5.4 earthquake. Surprisingly, some were even strong enough to be detected on broadband stations on the west coast of the United States! The second example is of the large eruption at Mt. Redoubt on April 4, 2009. Notice how both events look drastically different, but both are still volcanic eruptions?
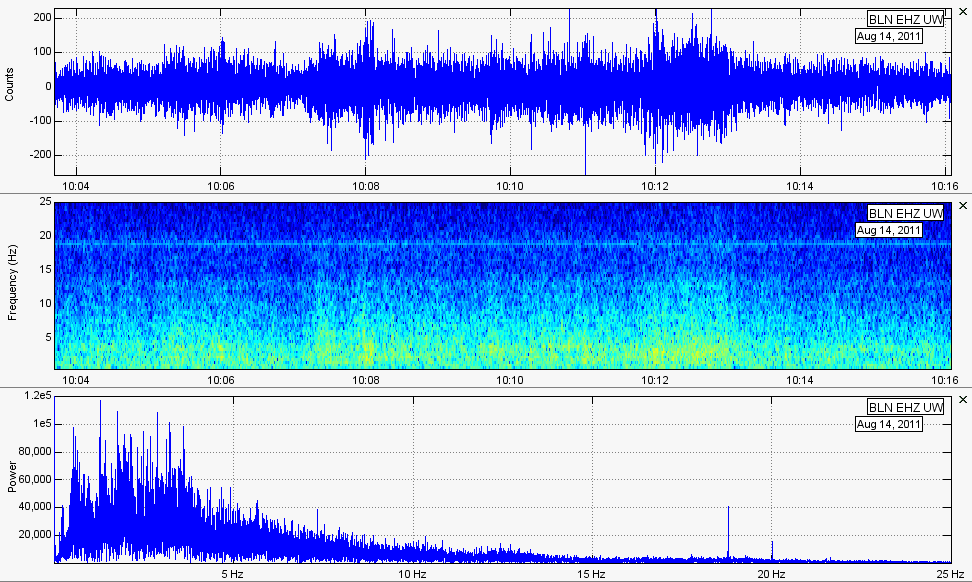
-Low frequency, non-volcanic tremor (tectonic tremor): Low frequency tectonic tremor is similar to low frequency volcanic tremor, but the process that causes it is much different. ETS, episodic tremor and slip, is an occurrence commonly seen along subduction zones worldwide, most notably the West Coast of the United States. If you goto pnsn.org, they have a great deal of information regarding ETS tremor. Tremor is recorded by seismic stations and slip is detected by GPS deformation stations. The following low frequency tectonic tremor was from a large ETS event under the Olympic Peninsula in Washington State in late-2011. You can tell characteristics do look kind of similar to low frequency volcanic tremor. However, you can tell there is a slight difference. Although frequencies are low, it seems tectonic tremor has a higher residual frequency effect than volcanic tremor. It is highly unlikely anyone can actually feel these tremor events, even though the energy released can be anywhere from a M0.0 to a M2.2 earthquake. The reason for this is because the energy is released over a much longer period of time, thus it is likely no one will ever feel these.
For a few more examples of tectonic tremor and what to watch out for, please CLICK HERE.
For a few more examples of tectonic tremor and what to watch out for, please CLICK HERE.
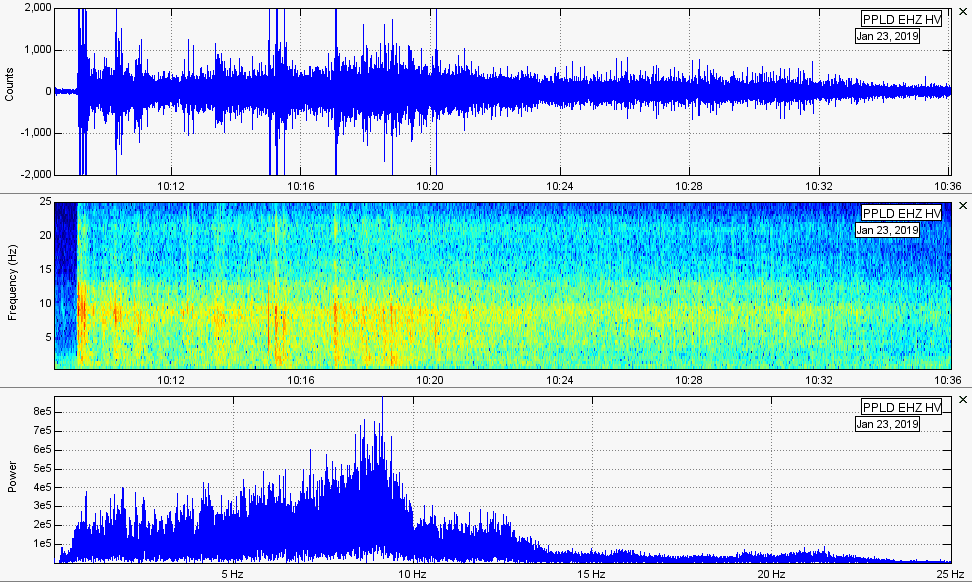
-Spasmodic tremor: These events are somewhat rare, but have been spotted at volcanic areas throughout the world. They are usually associated with volcanic activity. Most notably, especially as of recently, the Big Island of Hawaii has been seeing a large resurgence of these events since late-January 2019. I barely could find any examples of these events elsewhere but I did find two examples (not done by me). Please CLICK HERE and CLICK HERE for two other examples of spasmodic tremor. However, Hawaii lately has been seeing them occur in "swarms" with sometimes over 5 events occurring in one day's time. In the case of the Hawaii spasmodic tremor, they usually occur deeper than 20km in depth and can last anywhere from 10 minutes to 1 hour and 11 minutes! They seem to be occurring within the mantle plume's conduit itself. Basically, these events are showing us magma coming from deep within the earth to refill volcanoes on the Big Island.
Now PNSN states that sometimes tectonic tremor caused by slow slip can be put into the category of spasmodic tremor. However, for these examples, I am referencing deep volcanic spasmodic tremor. These events do vary from location to location, event to event. Sometimes they show obvious earthquakes that are stronger than the background tremor. Other times, earthquakes almost appear non-existent when the tremor episode itself is at it's strongest. I am still conducting a huge amount of research about these events. However, if you wish to see my current observations of spasmodic tremor in Hawaii, then please CLICK HERE.
Now PNSN states that sometimes tectonic tremor caused by slow slip can be put into the category of spasmodic tremor. However, for these examples, I am referencing deep volcanic spasmodic tremor. These events do vary from location to location, event to event. Sometimes they show obvious earthquakes that are stronger than the background tremor. Other times, earthquakes almost appear non-existent when the tremor episode itself is at it's strongest. I am still conducting a huge amount of research about these events. However, if you wish to see my current observations of spasmodic tremor in Hawaii, then please CLICK HERE.
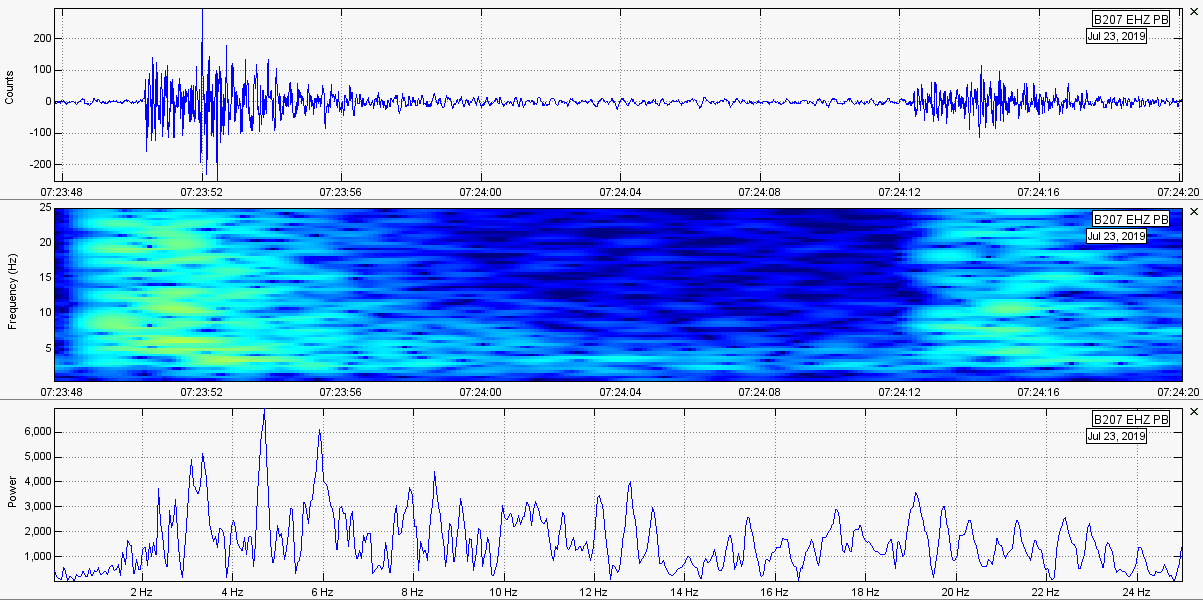
-Hydrothermal eruption: Just like many other seismic events, hydrothermal eruption signatures can vary from location to location, station to station. I thought it was wise to use the best known hydrothermal eruption signature: the eruptions of Steamboat Geyser in the Norris Geyser Basin at Yellowstone Caldera. Steamboat Geyser is one of the largest geysers in the world and is currently the largest active geyser on the planet. The following signature is of the surface vibrations from the eruption itself, and maybe some very minor and very shallow upper crustal vibrations from the fast pace of hydrothermal fluids charging forward. This is the 20th eruption of 2019, which occurred at 07:13UTC June 7, 2019 (1:13am Mountain Time, same date).
Don't forget to check out the two Steamboat Geyser pages under the "Seismic Events" menu to see every Steamboat eruption since it reactivated in early-2018!
Don't forget to check out the two Steamboat Geyser pages under the "Seismic Events" menu to see every Steamboat eruption since it reactivated in early-2018!
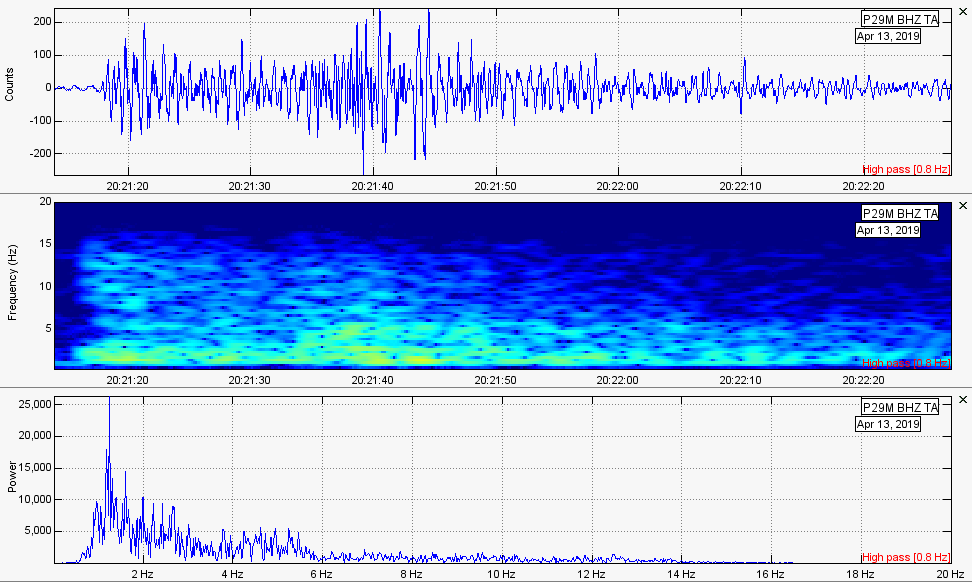
-Cryoseism (ice earthquake): An ice earthquake, also know as a cryoseism, is an event caused by the sudden fracture or failure of frozen soil or rock saturated with water or ice. It typically occurs only in cold climates. In the United States, it most notably occurs in Alaska. However, cryoseisms have been reported from many states during long durations of cold temperatures such as Michigan, Wisconsin, Maine, and even as far south as Tennessee. These events do not happen often, except for in Alaska. However, places such as Northern Canada and Russia likely see these events almost every day. The following cryoseism (ice quake) occurred 108km W of Haines, Alaska and reportedly carried a magnitude of M2.5 striking at 5.9km in depth (2019-04-13 20:21UTC).
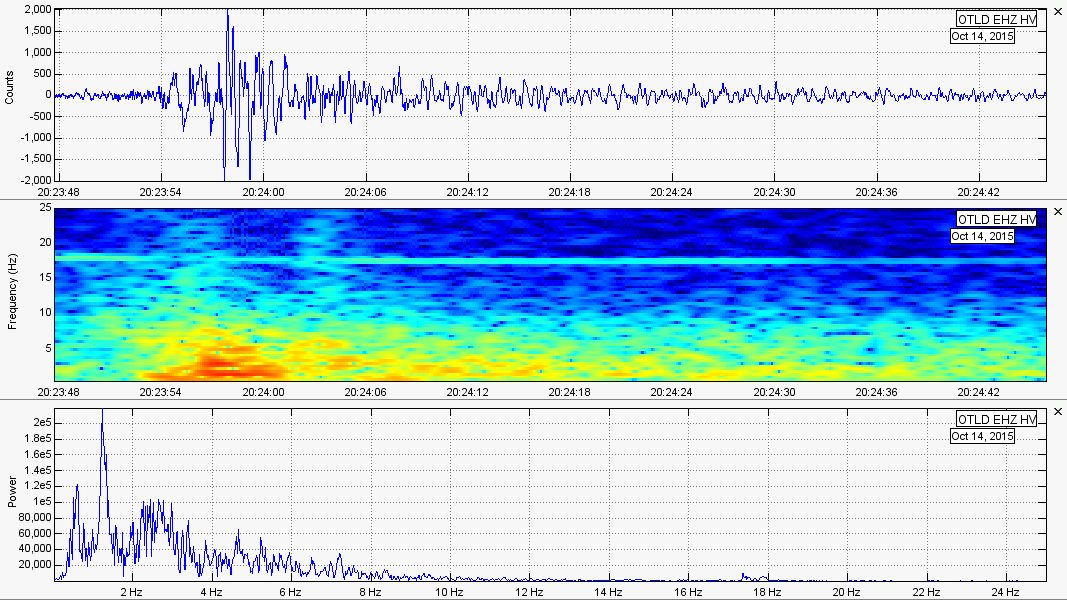
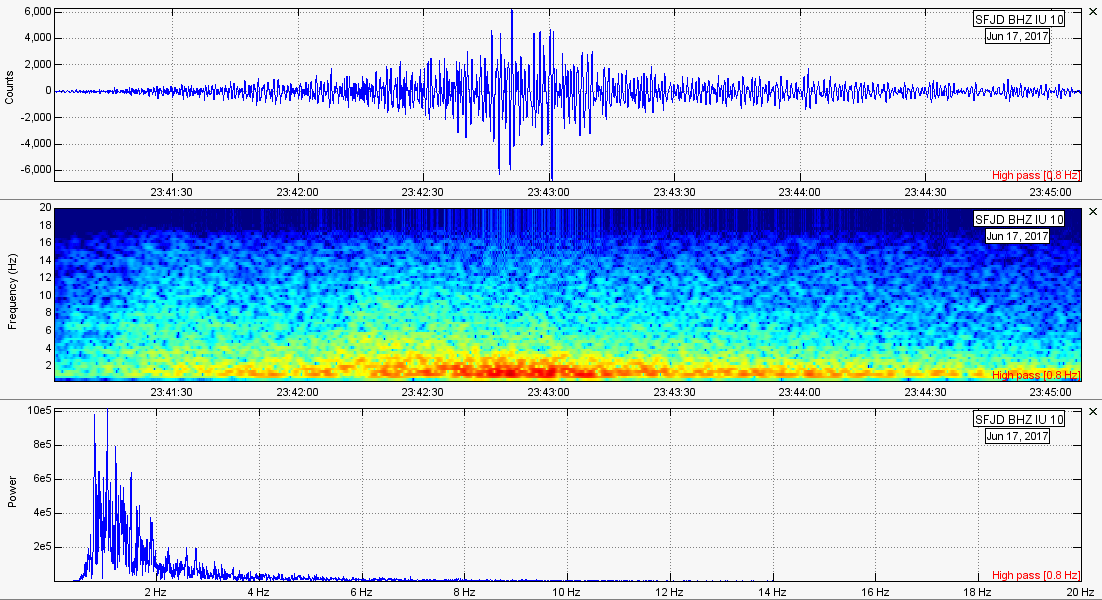
-Landslide/rockfall: Now these are one of the events that really can vary from location to location. These types of surface events all depend on the size, the type of rockfall or landslide, and the type of soil leading from the epicenter to the seismic stations in question. This example shown is of a M2.2 rockfall at Kilauea Caldera on October 14, 2015 at 20:23UTC. The event shown right after the Kilauea event is of the M4.2 landslide in Greenland that occurred on June 17, 2017.
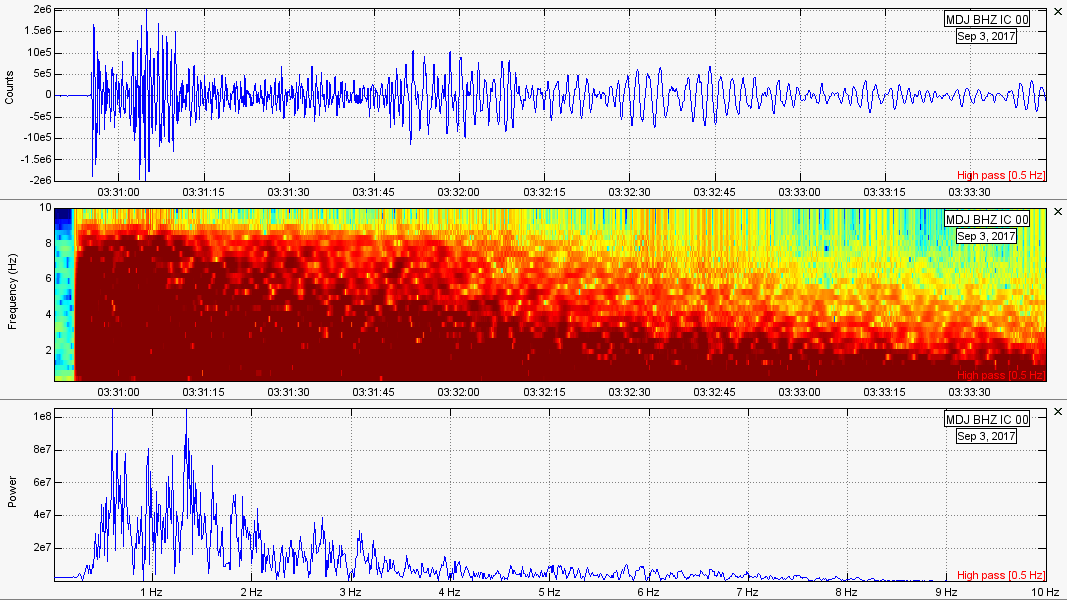
-Nuclear explosion: This following example is of the nuclear test conducted by North Korea on September 3, 2017 at 3:30UTC. It was likely at, or slightly greater than, 300 kilotons while registering as a M6.3 earthquake! It was such a powerful nuclear test that it was detected on seismic stations thousands of miles away, even in the United States!
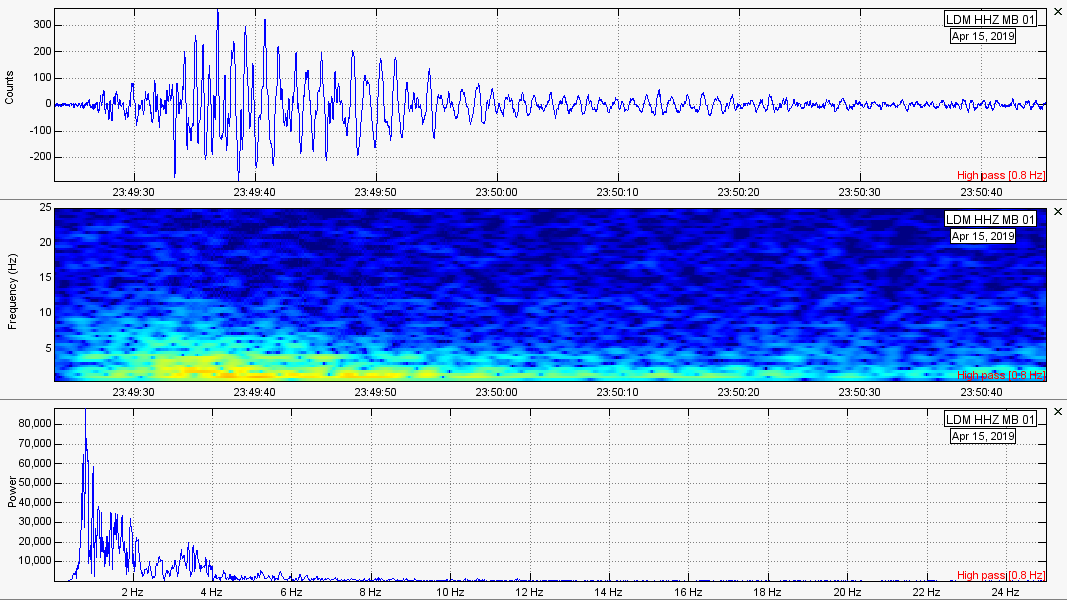
-Mine collapse/underground collapse: Underground collapses of mines or unstable geological features happen from time to time. Some may look different to other collapse events, so don't use this as a perfect template for underground collapses. This example is of a supposed mine collapse in Northwest Montana just 26km WSW of Libby, MT. It was reported as a M2.7 Mine Collapse supposedly at 0.0km depth (depth could be wrong; 0.0km is sea level). It occurred on April 15, 2019 at 23:49UTC.
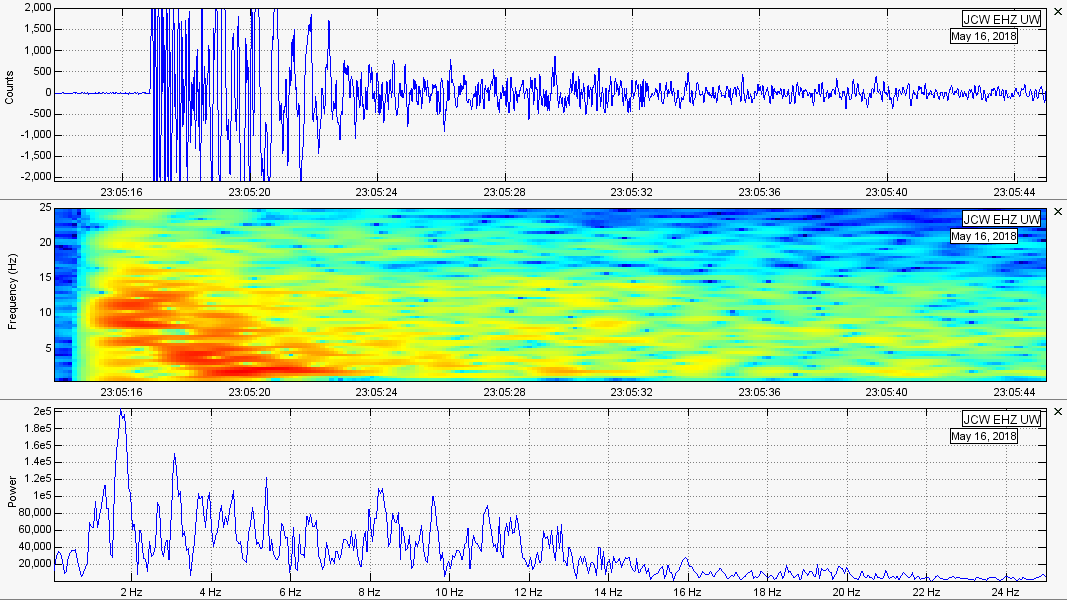
-Quarry blast (surface explosion): Quarry blasts occur many, many times everyday all throughout the United States. They can look similar to low frequency earthquakes, but quarry blasts usually only occur during daylight hours due to local laws and regulations. Quarry blasts are considered surface events since quarries are on top of the surface. Mine blasts, the type of event shown next, usually occur underground. Quarry and mine blasts are very similar to each other. However, one occurs below the ground (mine blast) and the other occurs on the surface (quarry blast). Although quarry blasts can trick people into thinking a low frequency earthquake has occurred, their characteristics can sometimes be easily distinguishable. Since they are surface events, many of the quarry blasts I see do not travel as far as real seismic events of the same magnitude. However, they can if they are strong enough. This quarry blast example occurred in Granite Falls, WA, a location notorious for quarry blasts. It registered as a M1.8 event on May 16, 2018 at 23:05UTC. Although this event shows high frequency ranges, stations farther from the epicenter usually show much lower frequency onsets, again sometimes tricking people into thinking a low frequency event occurred.
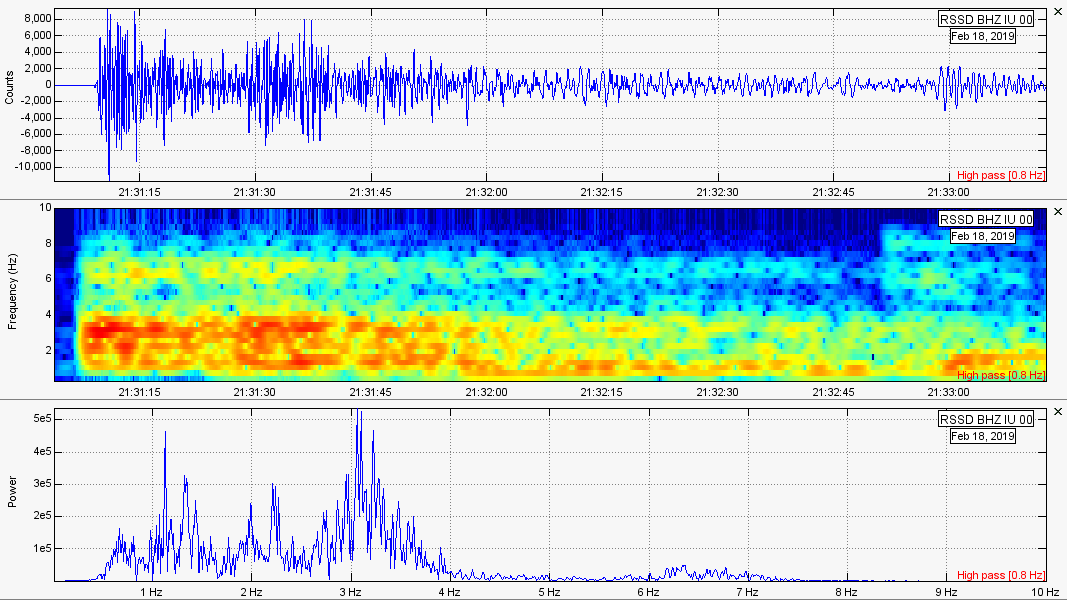
-Mine blast (underground explosion): Here is an example of a mining explosion or mine blast. These events are the siblings of quarry blasts, however mines are underground so these events occur underground as well. This example is from NE Wyoming where extreme mine blasts occur quite frequently. Sometimes the mine blasts register as a M4.0 earthquake and many people in the area have reported feeling them from time to time. So many of them have occurred over the past 5 years that there must be a massive cavern down there! Sometimes they blast many, many times in one day. I don't know exactly what they are doing in NE Wyoming, but the blasts are pretty big and occur probably around 1 mile or so underground (open to additional interpretation). This mine blast occurred in NE Wyoming on February 18, 2019 at 21:30UTC. It was recorded as a M3.5 event. I believe the largest ever recorded in this area was a M4.1 mine blast. That is pretty big!
Non-Seismic Events
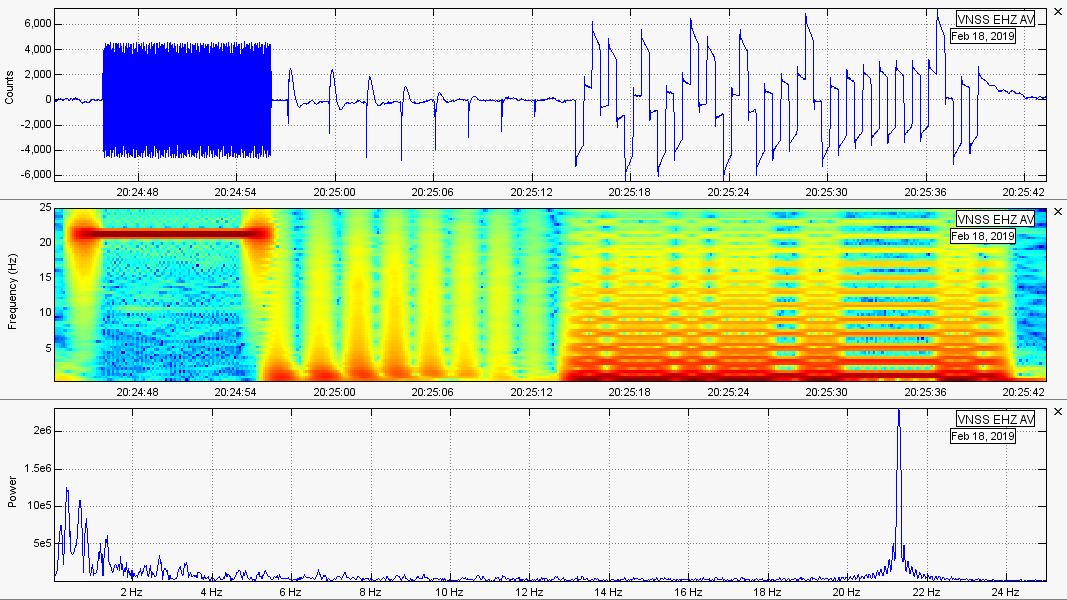
-Calibration pulse: These can look quite different from station to station. However, you can obviously tell these are not real seismic events. These are sometimes done once or twice a day and are conducted to re-calibrate the instrument to account for possible errors, or to keep the station in tip-top shape. As you can tell, these look very funny!
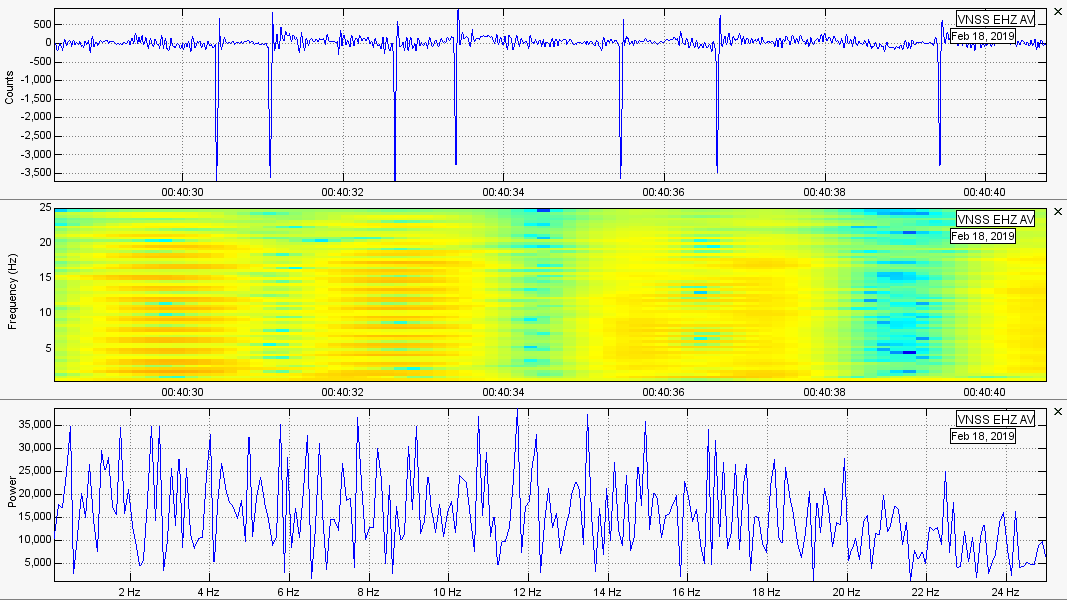
-Instrument malfunction/glitch: This happens a great deal and I run across this problem a lot. Keep in mind these glitches can look drastically different from station to station, but these are typically what they look like. You can tell these are not real seismic events. Sometimes it is either the instrument that glitches, or the transfer of data glitches along transfer routes due to storms, faulty wiring, or simply outdated instrumentation.
Any mistakes? Please email me at [email protected]
