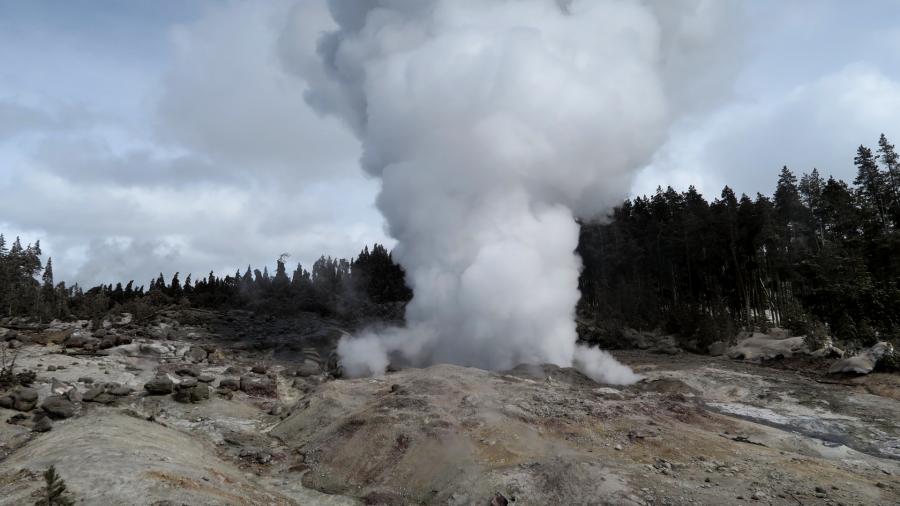
 Steamboat geyser is a very large geyser situated in the Norris Geyser Basin in the north section of Yellowstone National Park and Caldera. It has entered a very frequent water eruption phase since March 15, 2018, when its first eruption of 2018 occurred. It has erupted large amounts of super-heated water and blown rocks into the sky a total of 24 times so far this year, at the time of writing this. In this blog post we will take a quick and simple seismological look at Steamboat geyser and the seismic signals it creates. Steamboat needs to erupt 6 more times to beat the record, or 5 more times to match the record, of 29 eruptions in one year. That year in question was 1964. Will she make it? PLEASE CLICK THE TITLE OF THIS POST OR "READ MORE" TO READ THE REST OF THIS BLOG POST! Image courtesy of USGS. Steamboat's 24th eruption of 2018 occurred at 7:29pm Mountain Time October 23, 2018, which is also 01:29UTC October 24, 2018 (since UTC is ahead of the time zones in the United States). The statement on volcanoes.usgs.gov about this last eruption is incorrect. They said it occurred at 9:29pm Mountain Time but someone really screwed up! 1:29UTC is 7:29pm Mountain Time, not 9:29pm. First I will show the two helicorders that recorded this eruption: YNM and YNR. But the first image below is to show you the location of the three seismic stations that reside at the Norris Geyser Basin. Steamboat resides literally right next to the YNM station at the Norris Museum. Also, the seismic trace from the steamboat eruption can be seen at the beginning of the helicorders shown below. YNM showed it stronger than YNR. I will explain why that is in just a second. 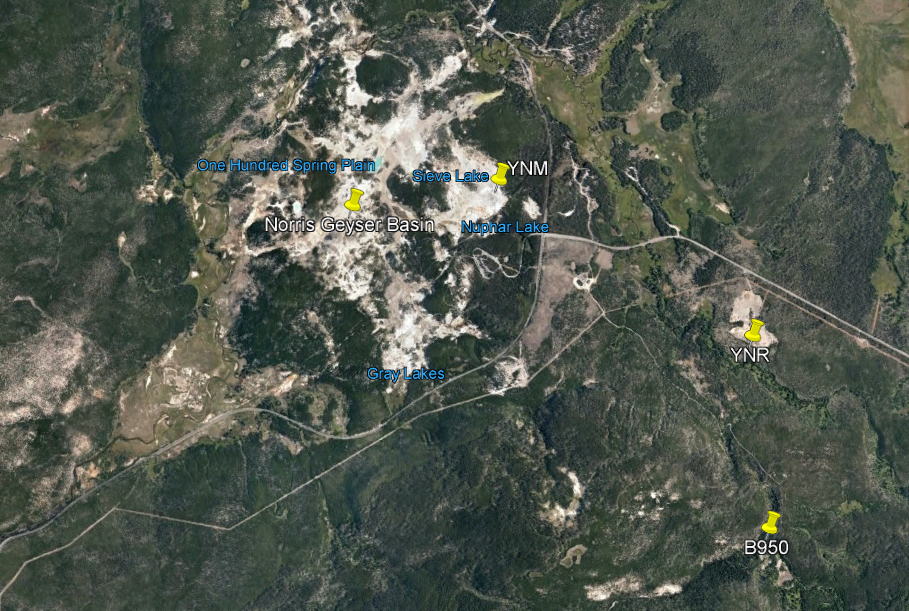 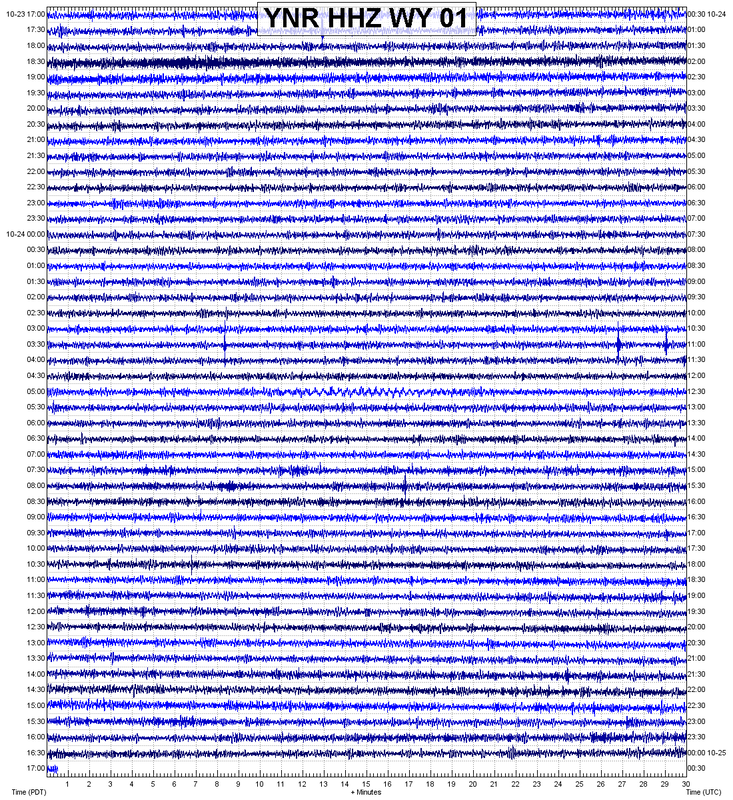 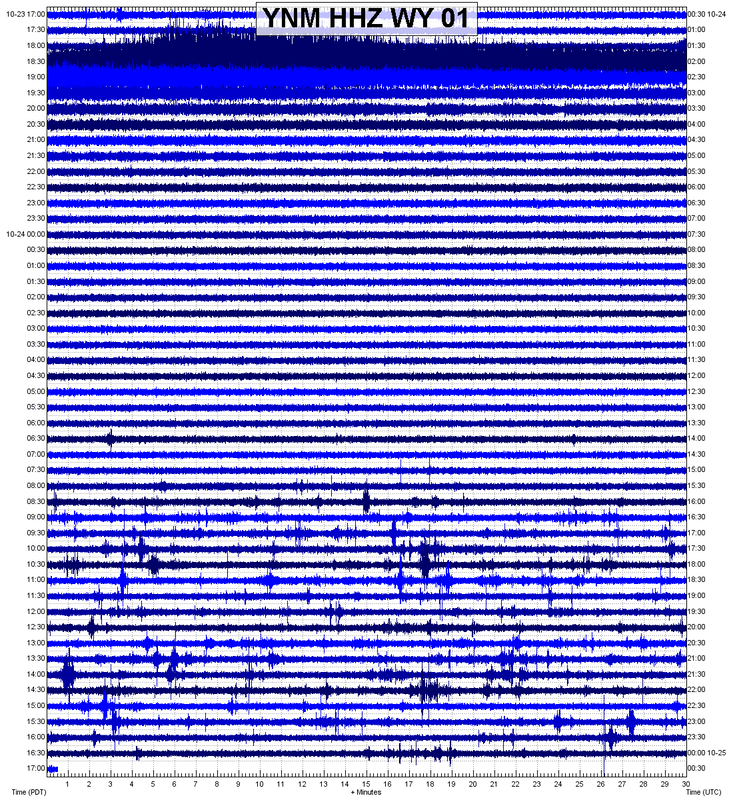 Now, you can clearly see the seismic trace showed up better on YNM's helicorder. Want a better look? Well you are about to get one! The two images directly below are the seismogram/spectrogram/spectral plots for YNM and YNR. Now these are slightly different than the normal plots I usually generate for seismic activity. First off, I added a complete spectral plot along with the seismogram/spectrogram plots. If any of you wish to understand how to read any of these plots, please go into the "more" dropdown menu above, goto "How To..." and please click "...Read Spectrograms, Seismic Plots, and More". Another reason why these plots I am about show are different is that the spectrogram frequency range (remember frequency range is always labeled on the left for spectrograms) has been extended all the way to 50HZ! That is a very high frequency range! Now, why would I do that? I did it because the steamboat eruptions, especially closer to the source, contain extremely high frequency ranges. So to show all of the activity I changed the maximum frequency on the spectrograms to 50HZ. Another reason how these will be different is the time period. Remember, just like in math, you must read ALL chart labels FIRST before you read any data given. The time period of these plots (not the eruptions themselves) is a two hour period, which is pretty long for any plot! Also, please read any captions beneath the images. They contain important information! 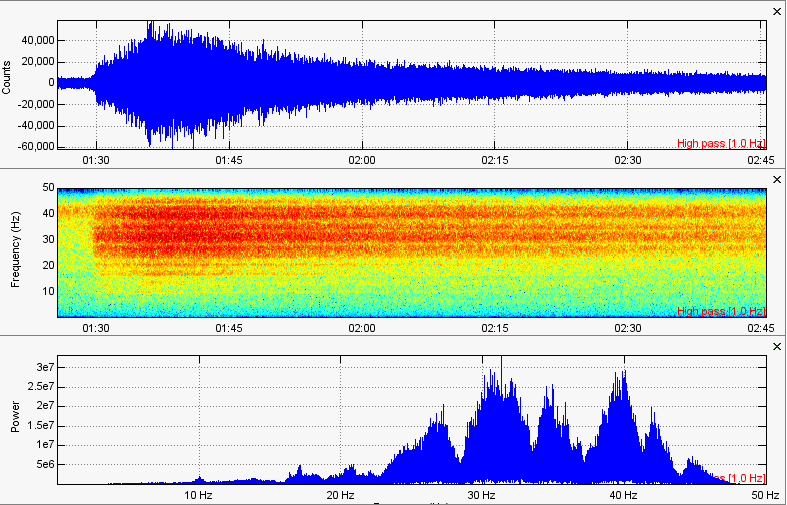 This is taken from seismic station YNM. Please note the dominant frequency range on the spectrogram of this eruption is between about 20HZ-45HZ. The spectral plot at the end of this image confirms it. The high frequency led me to believe the entire seismic trace of any steamboat eruption you see is only the surface waves. Want more proof that these are only surface vibrations? Check out the seismogram plot, also can be called a waveform plot, that is shown first in the image. Notice how the amplitude of the event goes a little bit beyond 40,000 count? Well please look at the image directly below: 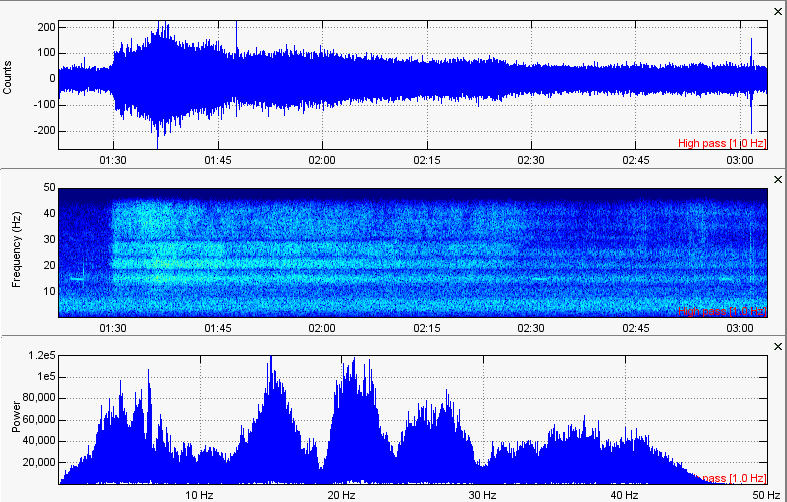 This is taken from seismic station YNR which resides just a couple miles east of YNM, so it is pretty close. Even though seismic station YNR is pretty close to Steamboat, though not as close as YNM, the amplitude of this event is drastically reduced! Notice in the seismogram plot here, shown first before the spectrogram and spectral plots, the amplitude barely goes past 200 count? Well that is drastically reduced compared to the 40,000 count shown on station YNM. You can also tell, using the spectrogram and spectral plots, that the frequencies dropped as well. So both the frequencies and the amplitude of the eruption dropped like crazy only a few miles from the source, indicating what we are seeing is only the eruption on the surface. Another tell tale sign of these stations only detecting the surface eruption, not the freeflow of super heated water underground, is the fact that the seismic trace always starts when the surface eruption starts. Now if that is not enough proof for my theory, why don't we take a look at this same exact time period but on Borehole 950? 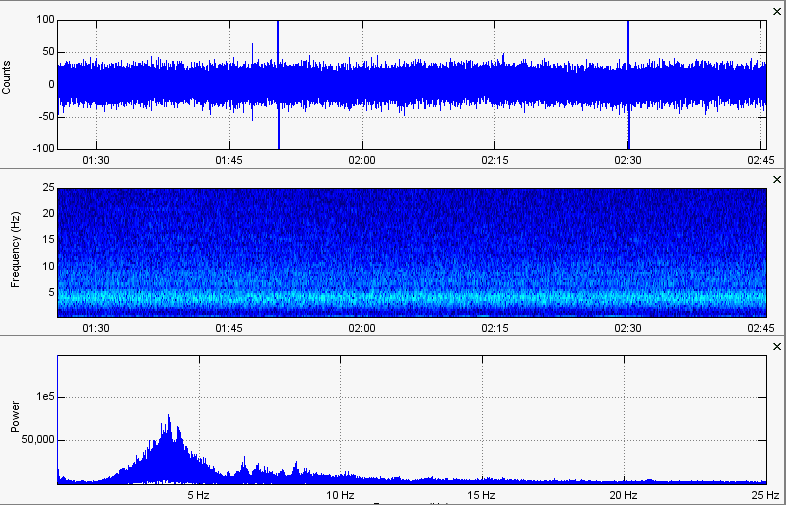 The spectrogram, seismogram, and spectral plots above are from B950. Now if you didn't notice, the time/date period for the plots above are exactly the same as the plots for YNR and YNM I just showed. Notice how there is no noticeable eruption trace? Even though B950 is very close to YNR and YNM? That is because the surface vibrations weakened too much before reaching B950. You can even see this in the helicorder shown directly below (even though the helicorder is not as accurate as using actual plots): 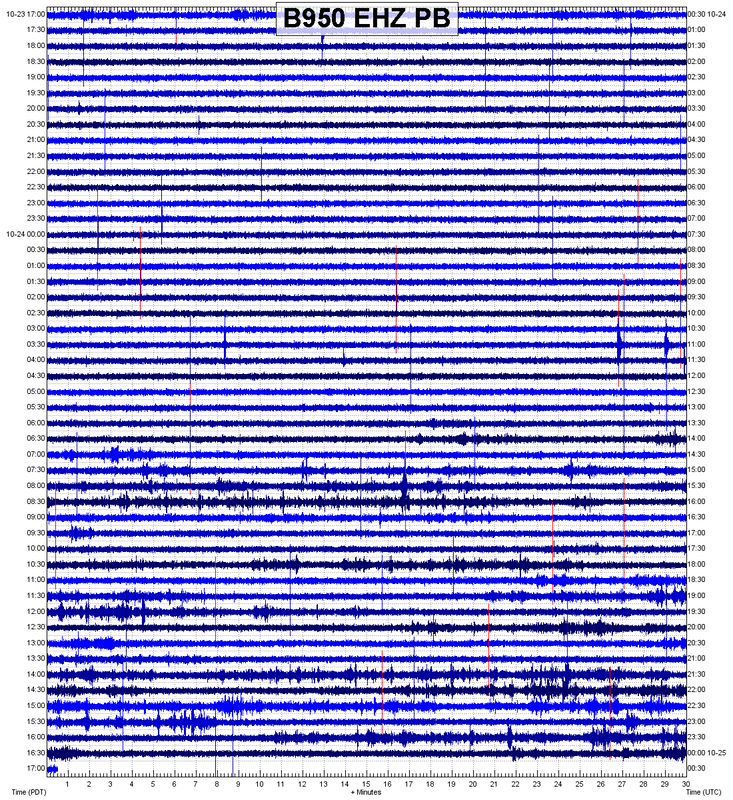 So wans't that interesting? Now you know what the spectrogram, seismogram, and spectral plots look like for Steamboat hydrothermal eruptions. Very strong surface vibrations with very high frequencies. If you wish to see what the actual waveforms look like for the steamboat eruption, please look at the last image directly below. The eruptions contain such a high frequency that I had to zoom in very far to even simply spread out the waveforms! Please notice in the seismogram plot directly below that each vertical tick mark is only 1 second! That means the whole plot below, from start to finish, is only 5 seconds long! Wowza!!! Thank you for your time and have a good day! Check back soon for a new blog post! 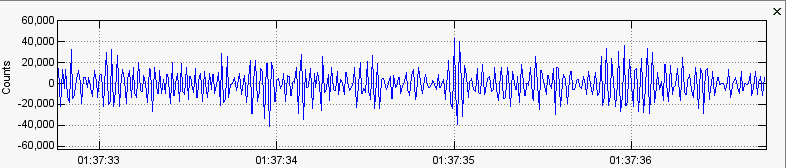
1 Comment
Muhammed
7/6/2019 08:54:55 am
Please send me the link of yolleston earthquake Leave a Reply. |
AuthorBen Ferraiuolo is a fast learner and someone who will always stand for the truth. Visit "About Me" for more! Archives
November 2019
Categories |
 RSS Feed