THE BEST SWARMS HAVE THEIR OWN DEDICATED PAGE! CLICK THE IMAGE ON THE RIGHT OF ANY TEXT IF TOLD SO.
So that means if you wish to skip the minor swarms below and go straight to the most impressive swarms, please click the following dates:
-December 31, 2018
-August 26, 2018
-July 5, 2018
-May 18, 2018
-April 11, 2018
-October 31, 2017 (does NOT have its own dedicated page; please look below)
-November 25, 2016
-January 31, 2016
-July 21, 2015
-August 16, 2014
As you will see below, the first thing I show on this page is a video of the seismic audio to ALL of the swarms noted on this page. Although I describe this below, the following dates are the best swarms to listen to via the video I provided. Beneath the video I provide the parts section to quicken swarm selection. Please refer to the number of earthquakes in text format, not what I state in the video. I had to redo some of the swarms' earthquake counts. The dates that "sound" the best are:
-July 5, 2018
-May 18, 2018
-April 11, 2018
-October 31, 2017
-July 21, 2015
This is the seismic events page that is dedicated to the rapid fire, energetic earthquake swarms that occur in and around West Thumb and Yellowstone lakes, within Yellowstone National Park and Caldera, WY. Sometimes they occur in other areas, but this type of seismic swarm seems to be more prevalent around those two major lakes at Yellowstone. First off, I highly suggest you read all of this text first before analyzing the events below. However if you wish to skip this text, you may. Many seismic helicorder charts and seismic plots will be shown below. For the larger swarms, please click the image to the right if shown. Don't worry. If you have to click it, it will say "Click Image". To save room on this page, I had to create additional pages for the larger swarms.
One of the most important points of my research is understanding why the area in and around West Thumb Lake, and Yellowstone Lake as well, sees earthquake swarms occur at a much more rapid pace than any other location within the Yellowstone National Park boundary (rapid, energetic swarms do strike other areas at times). If you don't already know, Yellowstone is a super-volcanic system caused by a mantle plume, not by normal subduction forces. All of the geysers and hot springs gather their heat and energy from the massive magma system that lies just below the surface. Now these earthquake swarms near West Thumb Lake are not major all of the time. However, there have been multiple instances, such as the April 11, July 5, and December 31, 2018 swarms, that signify there may be multiple causes to many of these swarms. I do believe the majority of the causes for swarms occurring around West Thumb Lake is connected to underground hydrothermal activity. However, I must say some of the major swarms, like the ones just mentioned, may have deep roots in small amounts of magma quickly intruding into the upper crust, trying to reach the surface (as is the traditional behavior of magma). But this theory needs to be put to the test.
There are too many people out there who claim "magma intrusion" is occurring all the time. It is not. However, it should occur every now and then. For example, the 2008-2009 dike intrusion at Yellowstone Lake was theorized by professionals to be caused by magma or a "poro-elastic stress pulse along a pre-existing fracture zone". I do truly believe that the 2008-2009 swarm was caused by magma itself. Especially since this dike intrusion caused an "explosive" earthquake and many low frequency and hybrid earthquakes were also detected. According to the professionals, the largest earthquake of that swarm had a 50% tensile crack opening source which they determined to be a magmatic expansion component. If you wish to learn more about this 2008-2009 dike intrusion, please CLICK HERE. That page shows many seismic plots to the most interesting events and contains the link to the professional publication. Just know there are many causes of earthquake swarms. It is likely we have not seen a magma intrusion event since 2008-2009, though I still believe there have been small intrusion events here and there since possibly 2014 at Norris.
Now you may be wondering, while looking at the info below, how I am able to determine approximate earthquake counts for any given swarm (especially when a swarm generates hundreds of earthquakes and only 20 or so are reported). I download the data to the 4 closest seismic stations. Surface noise/events almost always ONLY occur at the station the noise/events was closest to. Armed with that knowledge, and the data of the surrounding stations, you can determine how many earthquakes occurred within a swarm. How is that possible? Well it all has to do with P wave arrivals. Everything has a P wave. Yes, even sometimes surface noise/events. But if those P waves correlate, within a few seconds or so, to the neighboring stations, then you have got yourself an earthquake (or a surface blast in some cases). Please understand I am NOT trying to accurately locate these earthquakes. Accurately locating them down to the Latitude/Longitude requires you to use trigonometry and utilize the time difference between the P and S wave arrivals. However, you can judge the approximate number of earthquakes in any swarm just by comparing the P wave arrivals on surrounding stations (especially cross correlating how long they traveled to other stations). It is called P wave cross correlation. For me to count it as one earthquake, it must show on 3 surrounding stations. However, if a station is down, or the amplitude of the event is too small but carries the P/S wave characteristics of an earthquake, 2 stations will do just fine (as long as the stations are not directly next to each other). I then take the closest station to the swarm and double check my findings via spectrogram plots (spectrogram plots make it very easy to pick out events).
Regarding what you just read, many of the swarms below are under-reported. I do acknowledge the fact that some earthquakes cannot be located due to 3 factors: 1. They are too small and only show on 2 stations but still carry earthquake characteristics (in which case that means they still happened, but couldn't be located). 2. The P wave is far too close to the coda (end tail) of a preceding earthquake (in which case that means they still happened, but couldn't be located). 3. The event is emergent, meaning it slowly builds rather than starts immediately. Now #1 and #2 are understandable, in some cases. However many of the unreported events do not fall under those 3 factors. Even the professionals admit they cannot report all earthquakes, especially during a rapid-fire swarm (especially with the December 31, 2018 swarm). That means when viewing the total earthquake count for Yellowstone rapid-fire swarms, know that the count is usually higher than the reported count. Now. large magnitude swarms matter greatly, yes. However, many volcanic/hydrothermal processes, linked directly to magma, cause earthquakes under what the average human can feel. In all reality, you are far more likely to feel a swarm of tectonic events than volcanic events. Earthquakes caused by magma usually do not go beyond M5.5, though they probably can during rare events. However, earthquakes caused by tectonic activity can reach all the way to M9.5 (even theoretically larger)!
Below you will first see a video which I will talk about in a second. However, after the video, the data and info will be shown for every rapid fire swarm the Yellowstone Caldera interior has ever seen from 2014 through 2018. First off, I will NOT be able to show the plots of every single event of every single size. If it is a smaller swarm, then yes. I will be able to. But the swarms that contain over 100 earthquakes will not be detailed as greatly. However, keep in mind I will try my best! I encourage you to download this data yourself and analyze these events yourself. Do not just rely on this page, but rely on the number one source to listen to: THE DATA.
If I have missed an earthquake swarm or I am incorrect about something, please do not hesitate to let me know. For each swarm I will post the date of the swarm (UTC date/time) and then any relevant information. The list of information can be deciphered as follows:
-To start off, this symbol: ~ means "approximately", "about", or "around". Please remember this whenever you see it.
Now to the info I provide for each swarm:
-Start of swarm: This is the start time I have personally picked for the swarm in question.
-End of swarm: This is the end time I have personally picked for the swarm in question.
-Note: This option gives me the ability to add any additional details to this swarm that is not readily noticeable or known.
-Total earthquake count (includes even the tiniest events): This will contain the ~ symbol. Remember, it means "approximately" or "about". This is the total count of earthquakes that occurred of all sizes, even events that were not locatable.
-Magnitudes/Depths of reported events for this swarm from newest to oldest (showing magnitude/depth): This part will show all of the earthquakes that were reported for any given swarm. Most of the time I will just refer you to click on the USGS EQ map.
-Largest reported earthquake(s) of this swarm: This will contain the largest reported event for any given swarm.
-Largest amplitude: This will show the largest amplitude (strength) of the entire swarm from the closest 2 or 3 seismic stations. Remember, this shows the highest "spike" of any earthquake within any given swarm. The highest spike is the highest amplitude. This can be used to judge the size of any swarm, however it is not supposed to be relied upon much! Keep in mind broadband channels are usually more sensitive so they might show higher amplitudes than what short period channels show.
-USGS EQ map of this swarm: This section will show the USGS earthquake map for the swarm in question. Remember it will only show the earthquakes reported, not the actual number of earthquakes. Many swarms at Yellowstone only see about 5%-15% of the events reported, depending on the swarm. Please support me in supporting others to accurately monitor Yellowstone!
-Severity: Now this does NOT by any means have anything to do with every other swarm within the Yellowstone Park boundary, let alone swarms at other volcanoes. This simply gives me the ability to let you know which ones were larger and more important than others on this page. It is entirely my opinion and is open for interpretation. The scale goes from minor, to moderate, to major. The baseline is the April 11, 2018 swarm which, so far, is the only one I am labeling as "crazy". For example, 100 earthquakes in one day is alot right? However, if 100 quakes occurred in one hour, it would be more important than 100 earthquakes in one day. Well, most of the time. So this scale is dependent on multiple factors.
-# of 3-plot images: This has nothing to do with the helicorder charts below (the images with the many "blue lines"). This ONLY deals with the 3-plot images I show for each swarm (seismogram/spectrogram/spectra). This number contains how many 3-plot images are in the slideshows beneath the info, even where I have two slideshows (again, not counting the helicorders). I try to show the majority of activity via these 3-plot images. Knowing the number of images allows you to know when the slide show restarts. Also pay attention to the times beneath the plots (all times in UTC).
The following video is of the seismic audio for every swarm shown on this page. Below the video is the parts section, so you can skip to a certain swarm, and also the source I used to generate the seismic audio. It is best to use headphones for the seismic audio but be careful! Sometimes the audio can get kind of loud.
Unlike YouTube, you cannot click the time tags shown below. Just press play on the video and skip to a part you want. I suggest using headphones for this audio but if so, please be wary of the volume! The time tags are as follows:
03:36 – December 25, 2018 swarm audio, 04:21 – December 23, 2018 swarm audio, 05:11 – December 18, 2018 swarm audio, 06:32 – December 14, 2018 swarm audio, 08:23 – October 16, 2018 swarm audio, 08:57 – August 26, 2018 swarm audio, 10:09 – August 21, 2018 swarm audio, 11:42 – July 27-28, 2018 swarm audio, 14:52 – July 5, 2018 swarm audio (ONE OF THE BEST TO LISTEN TO!), 16:12 – May 18, 2018 swarm audio (ONE OF THE BEST TO LISTEN TO!), 18:19 – April 11, 2018 swarm audio of 1st episode (ONE OF THE BEST TO LISTEN TO!), 19:12 – April 11, 2018 swarm audio of 2nd episode (ONE OF THE BEST TO LISTEN TO!), 20:44 – February 26, 2018 swarm audio, 23:38 – October 31, 2017 swarm audio (ONE OF THE BEST TO LISTEN TO!), 24:43 – June 6, 2017 swarm audio, 25:39 – November 25, 2016 swarm audio, 32:24 – January 31, 2016 swarm audio, 34:55 – July 21, 2015 swarm audio (ONE OF THE BEST TO LISTEN TO!), 35:56 – August 16, 2014 swarm audio
Source: IRIS Time Series URL Builder
December 31, 2018
|
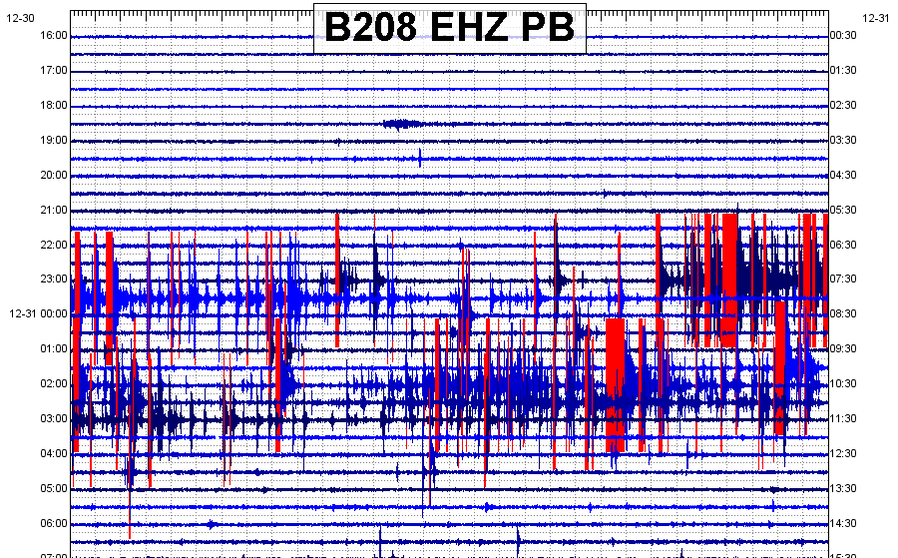
The December 31, 2018 earthquake swarm struck just west of the northern tip of Yellowstone Lake. There were approximately 255 earthquakes, within two episodes, within about 5 hours and 35 minutes. I already have a page dedicated to this swarm, so please click the image on the right to visit that page. It also contains the video about this swarm and also contains the seismic audio video. The severity of this swarm (remember to look at the text above to discover what "severity" means here) was major. This is an old post and new interpretations are needed for this swarm.
|
Please click the image.
|
December 25, 2018
|
Start of swarm: 10:29UTC
End of swarm: 10:41UTC Total earthquake count (includes even the tiniest events): ~20 Reported count: 2 Magnitudes/Depths of reported events for this swarm from newest to oldest: 0.9 at 4.3km, 0.3 at 3.6km Largest reported earthquake of this swarm: M0.9 at 4.3km Largest amplitude: 24,000 (YLT) USGS EQ map for this swarm: CLICK HERE Severity: Minor # of 3-plot images: 6 |
|
December 23, 2018
|
Start of swarm: 14:18UTC
End of swarm: 15:19UTC Total earthquake count (includes even the tiniest events): ~22 Reported count: None! Magnitudes/Depths of reported events for this swarm from newest to oldest: None reported Largest reported earthquake of this swarm: None reported Largest amplitude: 13,442 (B944), 5,440 (YLT) USGS EQ map for this swarm (though surprisingly none were reported): CLICK HERE Severity: Minor # of 3-plot images: 7 |
|
December 18, 2018
|
Start of swarm: 10:36UTC
End of swarm: 13:52UTC Total earthquake count (includes even the tiniest events): No more than 30 Reported count: 3 Magnitudes/Depths of reported events for this swarm from newest to oldest: 0.5 at 3.7km, 0.8 at 3.8km, 1.9 at 3.7km Largest reported earthquake of this swarm: 1.9 at 3.7km Largest amplitude: 3,072 (B944), 3,346 (YLT) USGS EQ map for this swarm: CLICK HERE Severity: Minor # of 3-plot images: 8 |
|
December 14, 2018
|
Start of swarm: 10:17UTC
End of swarm: 13:29UTC Total earthquake count (includes even the tiniest events): ~73 Reported count: 6 Magnitudes/Depths of reported events for this swarm from newest to oldest (showing magnitude/depth): 0.8 at 5.1km, 0.9 at 2.1km, 1.5 at 2.4km, 0.8 at 3.9km, 0.8 at 0.1km, 1.4 at 1.9km Largest reported earthquake of this swarm: 1.5 at 2.4km Note: This swarm contained many emergent, tremor-like events. The count may misrepresent the importance of this swarm. It is likely these emergent, tremor-like events were not tremor episodes at all. They instead could have been caused by many, many identical earthquakes occurring in such rapid succession you cannot tell them apart. Largest amplitude: 2,782 (YML), 7,720 (YLT) USGS EQ map for this swarm: CLICK HERE Severity: Moderate # of 3-plot images: 12 |
|
October 16, 2018
|
Start of swarm: 1:03UTC
End of swarm: 1:07UTC Note: This burst in seismicity was preceded by one earthquake and followed by two earthquakes. I will show the plots for those 3 separate events as well, however the main burst in seismicity lasted only 4 minutes! The 3 separate events will be calculated into the total earthquake count, seeing they are likely to be related to the main swarm. No earthquakes within the main burst were reported. Total earthquake count (includes even the tiniest events): ~15 (total of ~18 if you count the 3 separate quakes) Reported count: 2 Magnitudes/Depths of reported events for this swarm from newest to oldest (showing magnitude/depth): 1.2 at 5.5km, 1.3 at 4.8km Largest reported earthquake of this swarm: 1.3 at 4.8km Largest amplitude: 578 (YML), 2,725 (YLT) USGS EQ map of this swarm: CLICK HERE Severity: Minor # of 3-plot images: 4 |
|
August 26, 2018
|
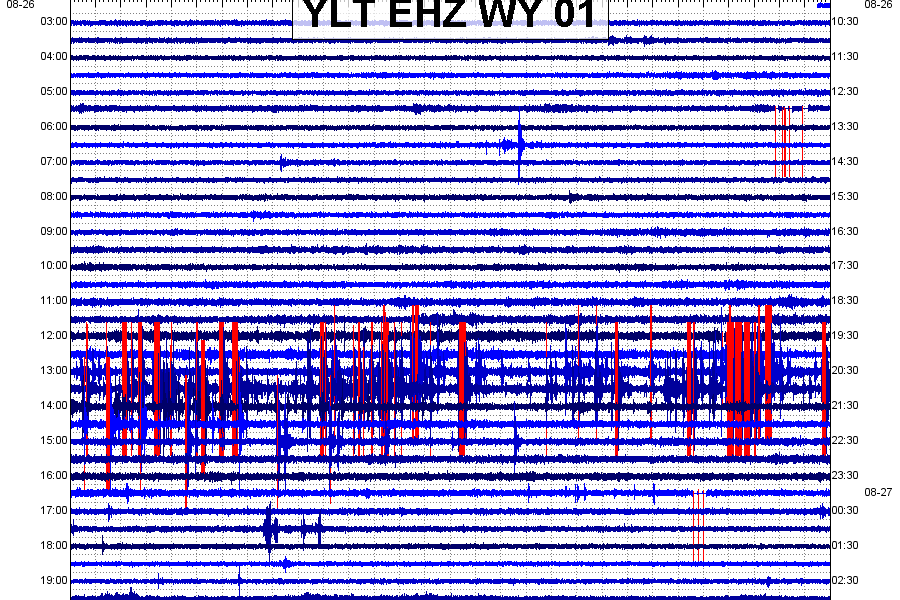
This swarm was ranked by myself as a moderate-major rapid fire swarm near West Thumb Lake. This event contains many plots so I had to create its own page, as usual when dealing with the larger earthquake swarms. As always, please click the image on the right to analyze the August 26, 2018 rapid fire swarm.
|
Please click this image.
|
August 21, 2018
|
Start of swarm: 7:53UTC
End of swarm: 8:34UTC Total earthquake count (includes even the tiniest events): ~30 Reported count: 3 Magnitudes/Depths of reported events for this swarm from newest to oldest (showing magnitude/depth): 0.1 at 3.3km, 1.8 at 5.5km, 1.4 at 3.9km Largest reported earthquake of this swarm: 1.8 at 5.5km Largest amplitude: 15,120 (B944), 29,063 (YLT) USGS EQ map of this swarm: CLICK HERE # of 3-plot images: 10 |
|
July 27-28, 2018
|
Start of swarm: 11:38UTC July 27, 2018
End of swarm: ~1:00UTC July 28, 2018 Note: This swarm did contain a long time period, yes. However, most of the seismicity occurred in a very close time frame therefore classifying this swarm as another one of the rapid fire swarms near West Thumb Lake. This swarm occurred at West Thumb lake, but just barely to the southwest. Usually I use YLT for the plots below. However, since B944 was obviously much closer to this swarm, I will use B944. Also, there were a few more events in the location of this swarm about 18 hours or so after the main swarm ended. To save on time, I will not show those events right now. Total earthquake count (includes even the tiniest events): ~110 Reported count: 5 Magnitudes/Depths of reported events for this swarm from newest to oldest (showing magnitude/depth): 1.6 at 1.6km, 1.1 at 6.7km, 1.8 at 3.9km, 1.8 at 3.9km 0.9 at 8.7km Largest reported earthquake of this swarm: 1.8 at 3.9km, 1.8 at 3.9km Largest amplitude: ~11,600 (B944), ~10,800 (YLT) USGS EQ map of this swarm: CLICK HERE Severity: Moderate # of 3-plot images: 18 |
|
July 5, 2018
|
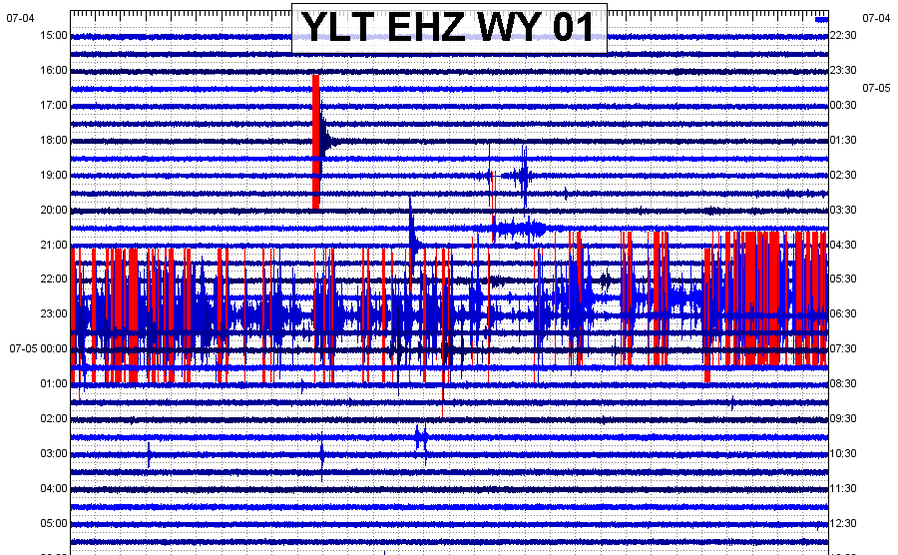
Please click the image to the right to visit the page dedicated to this very energetic swarm that struck on July 5, 2018. Over 160 earthquakes struck in only 52 minutes! WOW! I highly suggest taking a look at this swarm. Even the April 11, 2018 and October 31, 2017 swarms are cool too!
|
Please click this image.
|
May 18, 2018
|
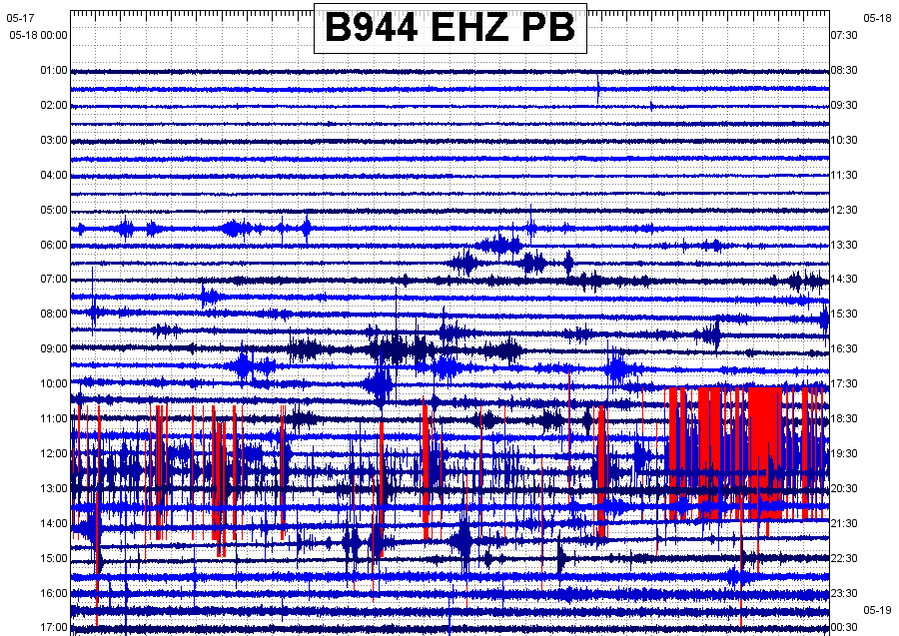
Please click the image on the right to visit the page dedicated to the May 18, 2018 rapid fire earthquake swarm.
|
Please click the image above.
|
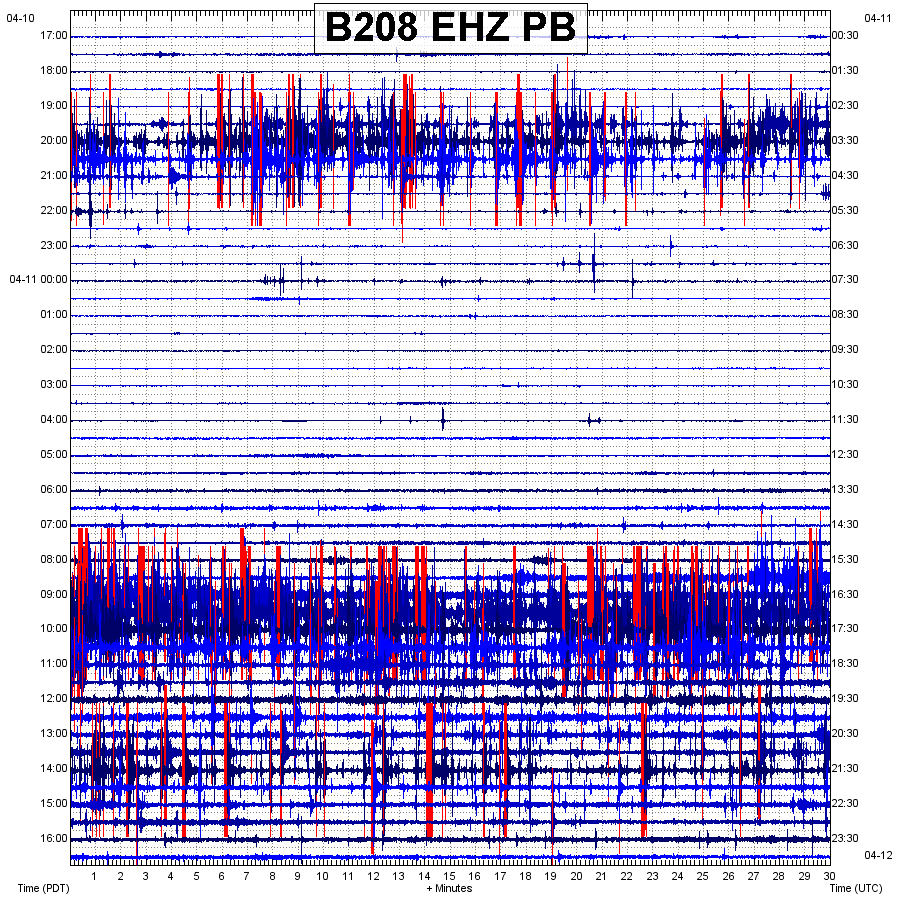
April 11, 2018
|
Please click the image on the right to visit the page dedicated to the most energetic swarm on this page! Within two episodes, in about 24 hours, over 955 earthquakes of all sizes struck the southwest portion of Yellowstone Lake. It was by far the most energetic swarm of 2018. Of course the February 2018 swarm near Maple Creek probably contained more earthquakes than this swarm, however that was spread out over days and days. This seismicity for April 11 occurred in only one day! Definitely the most energetic swarm of 2018 for Yellowstone!
|
Please click the image above.
|
February 26, 2018
|
Start of first burst in seismicity: 3:46UTC
End of first burst in seismicity: 3:54UTC Start time of main swarm: 9:35UTC End time of main swarm: 13:38UTC Start time of after-swarm burst in seismicity: 17:03UTC End time of after-swarm burst in seismicity: 18:36UTC Note: The earthquakes within this swarm occurred along a larger patch of land than what we have seen in the past. It appears to have occurred near the southwestern tip of West Thumb lake spreading all the way to the southeast as well, about 10 miles or so. Again, I will use the closest seismic station to this event: B944. Before and after the main swarm there was a short burst in seismicity which I already noted above. As you will see in the data below, this is another one of West Thumb’s rapid fire swarms. As usual I will not show all of the events within the plots below. However I will try to show the majority of them! Total earthquake count (includes even the tiniest events for all three episodes for this day): ~190 (though many events were much smaller than usual) Reported count (for entire day, for all three episodes): 4 Magnitudes/Depths of reported events for this swarm from newest to oldest (showing magnitude/depth): 0.5 at 8.0km, 1.8 at 11.7km, 1.4 at 4.2km, 1.5 at 4.7km Largest reported earthquake of this swarm: 1.8 at 11.7km Largest amplitude: ~24,300 (B944), ~17,000 (YLT) USGS EQ map for this swarm: CLICK HERE Severity: Moderate # of 3-plot images: 29 |
|
October 31, 2017
|
Start of swarm: 4:56UTC
End of swarm: 5:48UTC Note: This earthquake swarm occurred under the surface below the water, right in the center of the northern tip of West Thumb Lake. October 31, 2017 saw many other small earthquakes after the main swarm. To save on time and space I will NOT show those but will focus on the main burst in seismicity which lasted around 52 minutes but contained a crazy amount of earthquakes for that short period of time! This swarm was very similar to the one seen on July 5, 2018 and the earthquakes appear very identical and even struck in virtually the same location. Also there was another rapid fire swarm the next day on November 1st, not shown, but that swarm was extremely minor compared to this one. Total earthquake count (includes even the tiniest events): ~160 (And that does NOT count the micro quakes that occurred later in the day!) Reported count: 21 Magnitudes/Depths of reported events for this swarm from newest to oldest (showing magnitude/depth): 1.4 at 3.8km, 0.4 at 2.3km, 2.2 at 4.0km, 1.2 at 3.5km, 1.2 at 1.8km, 0.7 at 2.1km, 0.3 at 3.1km, 1.6 at 3.1km, 1.4 at 2.2km, 1.9 at 3.9km, 1.7 at 3.5km, 1.3 at 3.7km, 1.9 at 2.0km, 0.7 at 2.0km, 0.1 at 2.1km, 0.1 at 2.2km, 1.5 at 3.5km, 1.6 at 3.1km, 1.2 at 2.3km, 1.3 at 3.5km, 1.2 at 3.3km Largest reported earthquake(s) of this swarm: 2.2 at 4.0km Largest amplitude: ~32,800 (YLT), ~43,700 (B944) USGS EQ map of this swarm: CLICK HERE Severity: Major # of 3-plot images: 21 |
|
June 6, 2017
|
Start of swarm: 4:20UTC
End of swarm: 4:34UTC Note: This earthquake swarm was extremely minor but occurred in the same location as many rapid-fire swarms at West Thumb Lake, directly under the northern tip. This swarm occurred in the same exact location as the October 31, 2017 swarm. This swarm was better reported than many of the other rapid-fire swarms at West Thumb Lake at Yellowstone, although it was much smaller. Total earthquake count (includes even the tiniest events): ~24 Reported count: 7 Magnitudes/Depths of reported events for this swarm from newest to oldest (showing magnitude/depth): 0.1 at 2.9km, 1.1 at 4.1km, 1.1 at 3.4km, 0.4 at 4.2km, 1.6 at 3.1km, 0.3 at 2.3km, 0.8 at 2.4km Largest reported earthquake(s) of this swarm: 1.6 at 3.1km Largest amplitude: ~19,600 (YLT), ~4,400 (B944) USGS EQ map of this swarm: CLICK HERE Severity: Minor # of 3-plot images: 6 |
|
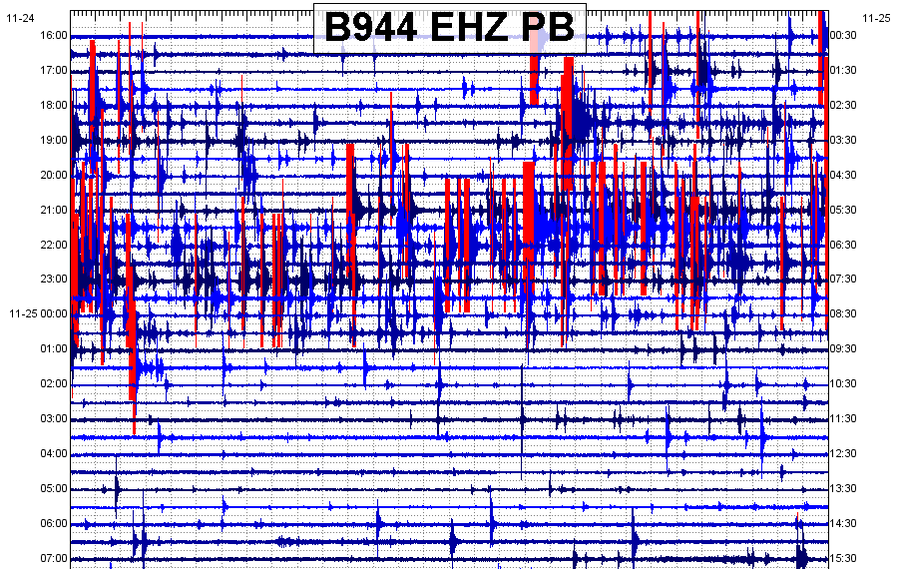
November 25, 2016
|
Click the image on the right to visit the page dedicated to the November 25, 2016 earthquake swarm. This swarm did not carry as much of a rapid pace as some of the other swarms on this page, seeing the earthquakes were drawn out over a longer period of time. However it was a great swarm to analyze!
|
Please click the image above.
|
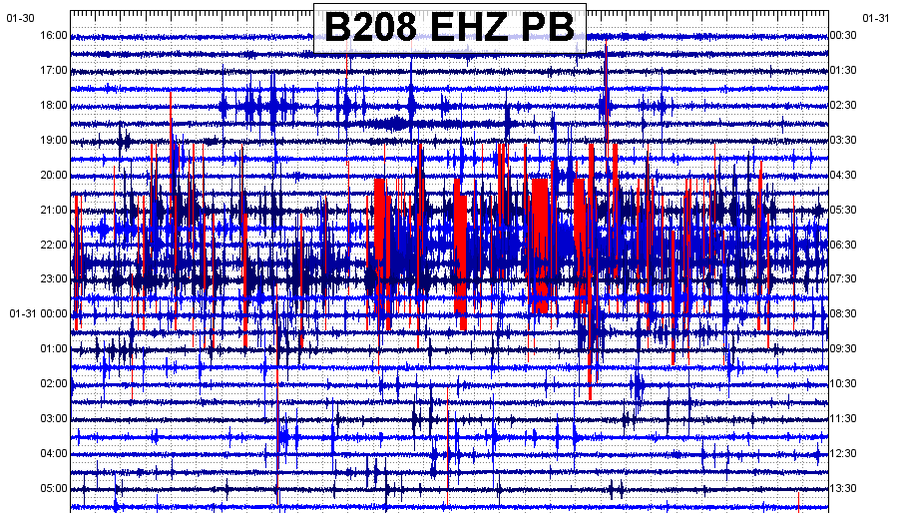
January 31, 2016
|
Please click the image on the right to visit the page dedicated to the energetic January 31, 2016 earthquake swarm.
|
Please click the image above.
|
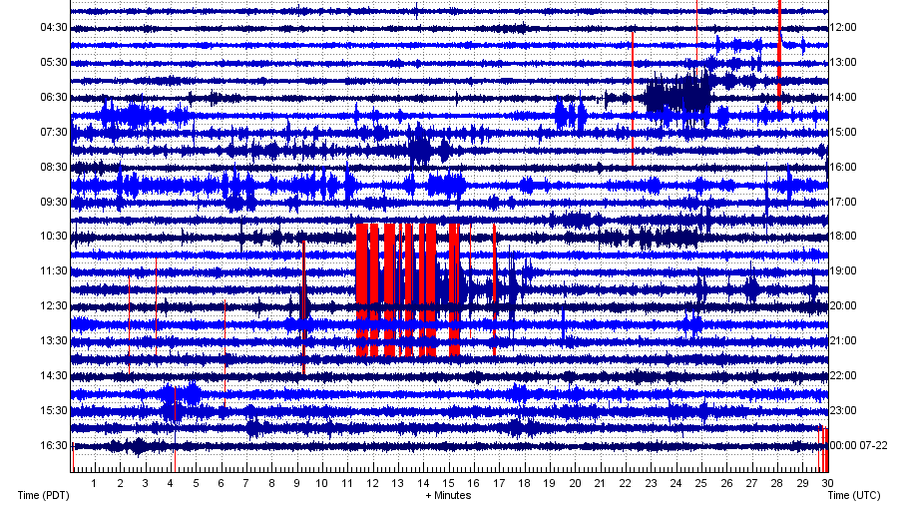
July 21, 2015
|
Please click the image on the right to visit the page dedicated to the July 21, 2015 rapid fire swarm. Although the total earthquake count was minimal, the magnitudes were pretty large for how fast the earthquakes occurred.
|
Please click the image above.
|
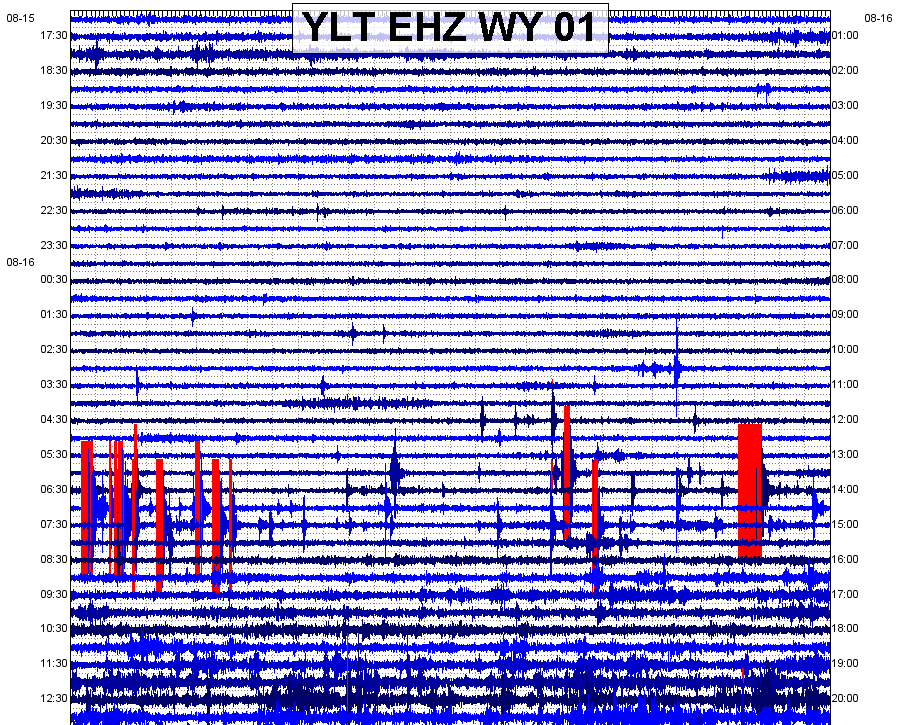
August 16, 2014
|
Please click the image on the right to visit the page dedicated to the rapid fire August 16, 2014 swarm. Prior to this date, it was hard to find these "rapid fire" swarms. It looks like 2018 saw the highest intensity and count of these "rapid fire" swarms. Why is that?
|
Please click the image above.
|