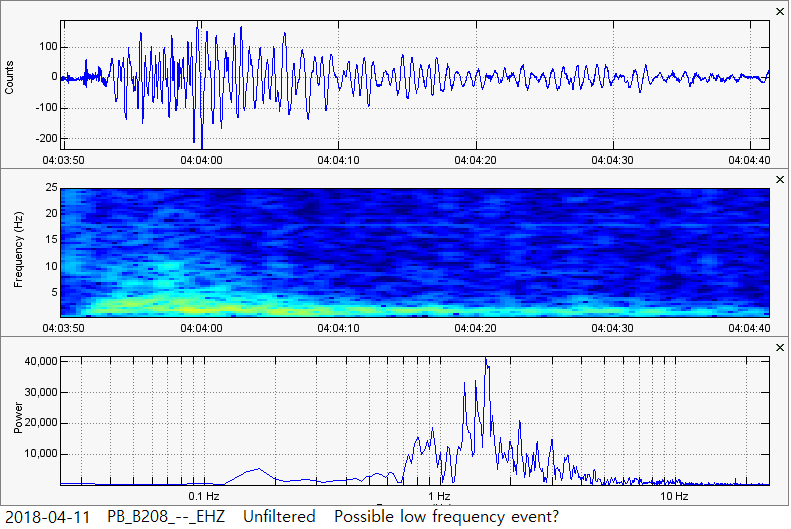
Possible low amplitude, low frequency earthquake at 04:03:52UTC.
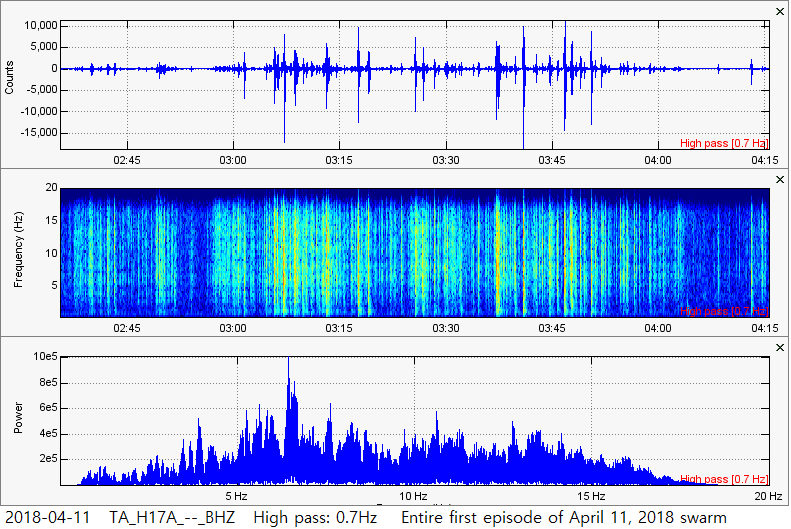
Start of first swarm episode: 2:37UTC
End of first swarm episode: 4:15UTC
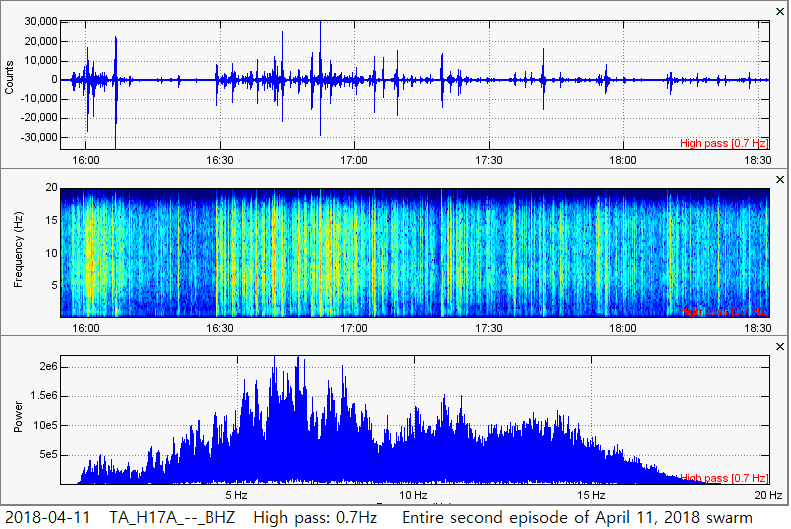
Start of second swarm episode: 15:56UTC
End of second swarm episode: 18:50UTC
Note: To the unaided eye, some of the earthquakes in this swarm appear to be along the lines of surface activity. However, all of the events in the plots below are actual seismic events due to how far they traveled vs. strength. Plus, even many of the earthquakes that look like surface activity were actually reported by USGS. Now, this earthquake swarm is one of the most interesting swarms that I have ever seen at Yellowstone. As shown in the time frames stated above, this swarm occurred in two episodes. Both episodes occurred on the same date so just look at the times beneath each plot, within each 3-plot image in the slideshow. This earthquake swarm seems to be more in line with some type of small dike intrusion. The estimated total earthquake count below is the total for both episodes of seismicity. Please also note that there were more earthquakes that occurred AFTER the second episode of seismicity was over. To save on space and time they will not be shown. Just know the estimated count below is probably higher. Not just due to the extra events a few hours later, but also because the swarm occurred at a very rapid pace. Although I show H17A’s data, B208 is another great station to show these events, since it helps filter the rapid events a little bit showing the true count. This was the first rapid fire swarm I ever studied and continues to fascinate me. It seems the closest station to the swarm was station H17A in the TA network. I will use that station for the plots below. The plots do not show every single event in both episodes, however I try to show most of them.
Total earthquake count (includes even the tiniest events): The first episode contained about 400 earthquakes and the second episode contained around 555 earthquakes. Those estimates are most likely lower than the actual count of earthquakes due to the sheer number of events in such a close time period. Using those numbers, however, we see a total of about 955 earthquakes of all sizes for this whole swarm.
Reported count: 105 (highest reported count for any of the swarms on this Seismic Events page)
Magnitudes/Depths of reported events for this swarm from newest to oldest (showing magnitude/depth): Too many! Please click the button below that says “Click Here” to open the USGS earthquake map for this swarm.
Largest reported earthquake of this swarm: 2.4 at 6.7km Depth
Largest amplitude: ~35,000 (H17A), ~40,300 (B208)
USGS EQ map for this swarm: CLICK HERE
Severity: CRAZY
# of 3-plot images: 19 images for the first episode and 26 images for the second episode
End of first swarm episode: 4:15UTC
Start of second swarm episode: 15:56UTC
End of second swarm episode: 18:50UTC
Note: To the unaided eye, some of the earthquakes in this swarm appear to be along the lines of surface activity. However, all of the events in the plots below are actual seismic events due to how far they traveled vs. strength. Plus, even many of the earthquakes that look like surface activity were actually reported by USGS. Now, this earthquake swarm is one of the most interesting swarms that I have ever seen at Yellowstone. As shown in the time frames stated above, this swarm occurred in two episodes. Both episodes occurred on the same date so just look at the times beneath each plot, within each 3-plot image in the slideshow. This earthquake swarm seems to be more in line with some type of small dike intrusion. The estimated total earthquake count below is the total for both episodes of seismicity. Please also note that there were more earthquakes that occurred AFTER the second episode of seismicity was over. To save on space and time they will not be shown. Just know the estimated count below is probably higher. Not just due to the extra events a few hours later, but also because the swarm occurred at a very rapid pace. Although I show H17A’s data, B208 is another great station to show these events, since it helps filter the rapid events a little bit showing the true count. This was the first rapid fire swarm I ever studied and continues to fascinate me. It seems the closest station to the swarm was station H17A in the TA network. I will use that station for the plots below. The plots do not show every single event in both episodes, however I try to show most of them.
Total earthquake count (includes even the tiniest events): The first episode contained about 400 earthquakes and the second episode contained around 555 earthquakes. Those estimates are most likely lower than the actual count of earthquakes due to the sheer number of events in such a close time period. Using those numbers, however, we see a total of about 955 earthquakes of all sizes for this whole swarm.
Reported count: 105 (highest reported count for any of the swarms on this Seismic Events page)
Magnitudes/Depths of reported events for this swarm from newest to oldest (showing magnitude/depth): Too many! Please click the button below that says “Click Here” to open the USGS earthquake map for this swarm.
Largest reported earthquake of this swarm: 2.4 at 6.7km Depth
Largest amplitude: ~35,000 (H17A), ~40,300 (B208)
USGS EQ map for this swarm: CLICK HERE
Severity: CRAZY
# of 3-plot images: 19 images for the first episode and 26 images for the second episode