 Please click the title of this post or "read more" to view the analysis page for the minor 6-minute rapid-fire swarm that broke out near West Thumb Lake at Yellowstone on May 4, 2019 (seismic audio included)... 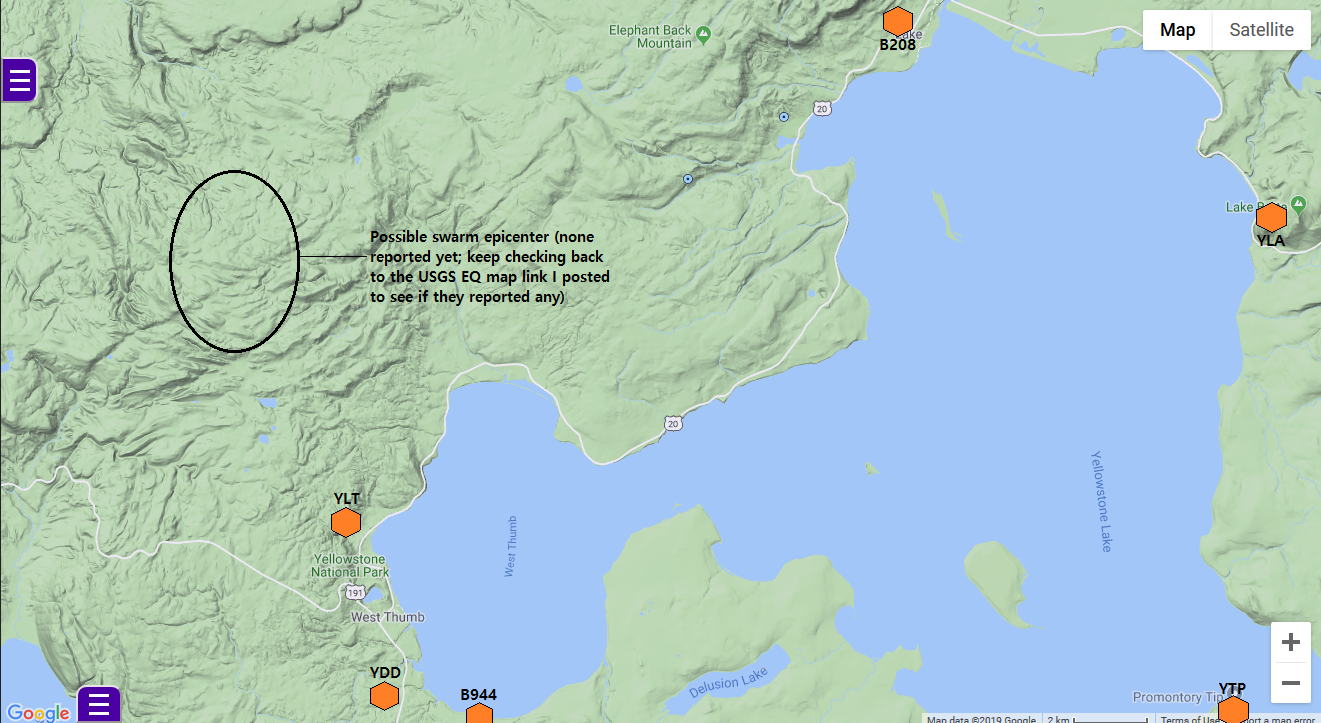 First off, if you wish to see the USGS earthquake map for this swarm, please CLICK HERE. None have been reported yet, as of 8:33pm PST May 4, 2019 (3:33UTC May 5, 2019), but they may be reported soon so continue to check the map if you wish. Also, if you wish to see the station locations at Yellowstone, please CLICK HERE. UPDATE AS OF MAY 9, 2019 19:00UTC: Two earthquakes in this swarm have been reported. I was so close to the correct epicenter, though I was off a bit. That shows I am getting closer and closer to actually being able to locate events on my own! On May 4, 2019 at 7:25am Mountain Time, a minor rapid fire swarm broke out near West Thumb Lake. No earthquakes have been reported as of yet, however I analyzed some of the P and S wave arrivals and the circle on the map above shows the likely epicenter of this 6-minute swarm. The largest event was likely no larger than M1.8 or so, likely occurring around 3km to 5km in depth. No more than 21 events occurred during this swarm. Doesn't seem like much, especially since the magnitudes are low, but 21 events in 6 minutes is pretty fast! It is hard to tell exactly how many events occurred, especially since many of the events slowly build (are emergent) and occur so fast that, at times, it blends to create a tremor-like event. Here is the swarm via 5 spectrogram plots. If you wish to hear the seismic audio now, skip to the end of the post. 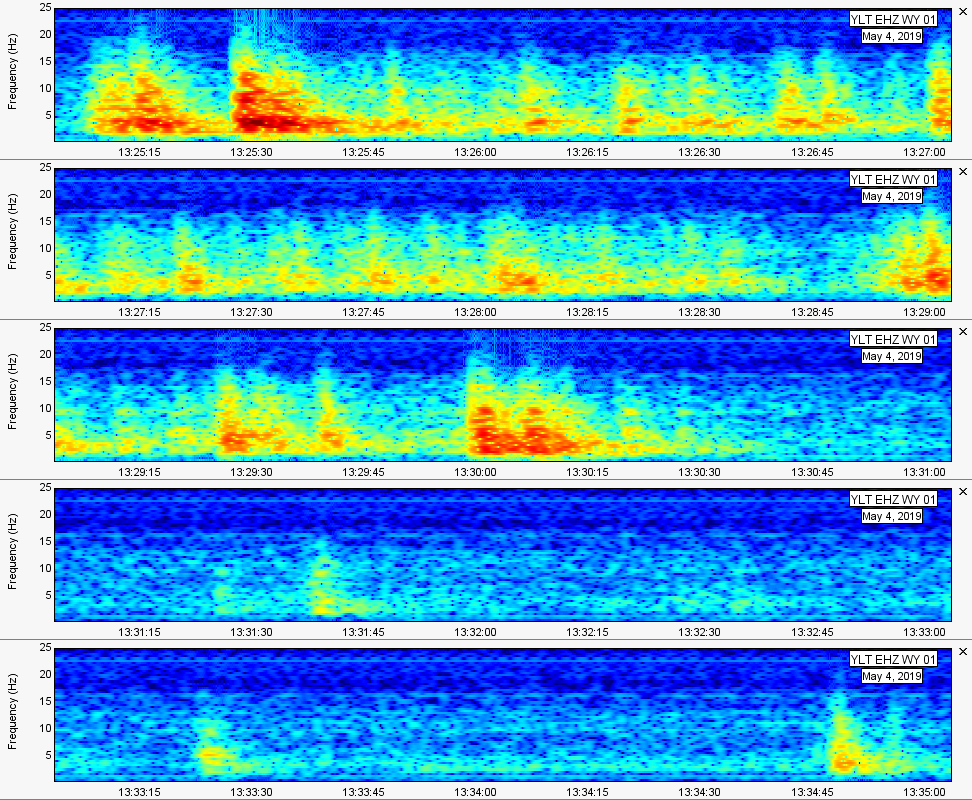 And here are the P and S wave arrivals for the largest event of the swarm (via WAVES): 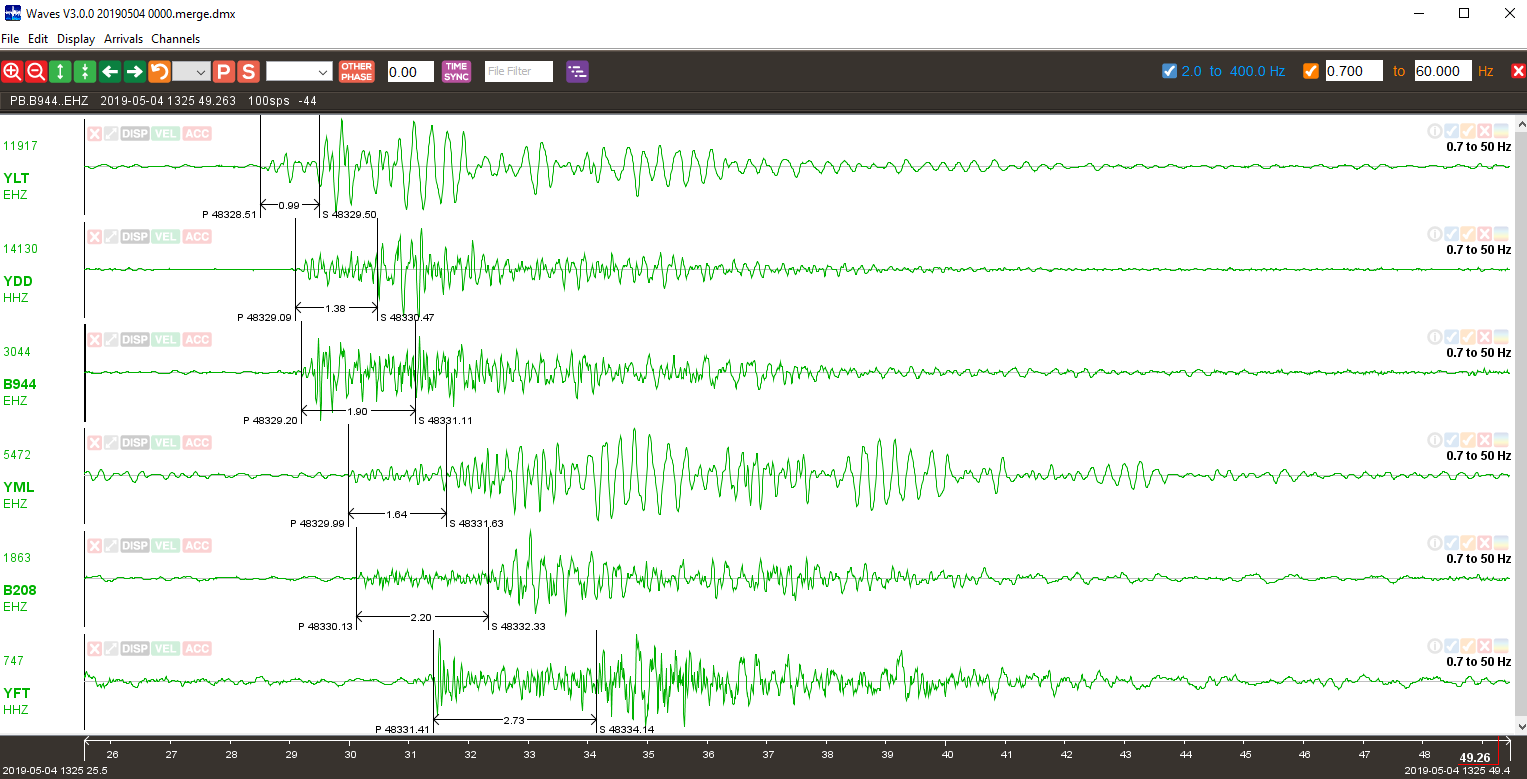 May 4, 2019 swarm Start of swarm: 13:25UTC End of swarm: 13:31UTC (a few stragglers occurred a few minutes later; those are not counted here) Total earthquake count (includes even the tiniest, unreported events): ~21 events Reported count: 2 Largest reported earthquake of this swarm: M2.4 at 3.1km depth Largest amplitude: ~14,100 (YDD-HHZ), ~11,900 (YLT-EHZ) Severity: Minor Below I will show helicorder plots from 6 select stations closest to this swarm. I will then show the seismogram, spectrogram, and spectra plots detailing almost all of this swarm. If you wish to hear the seismic audio of this swarm now, simply skip to the end of this post. Seismic Audio Here is the seismic audio of the swarm. Headphones are highly suggested, but be wary of the volume just in case. To view this video on my YouTube channel instead, please CLICK HERE.
2 Comments
Matthew Martin
5/5/2019 10:50:29 am
Hi is the caladara staring to collapse?
Ben
5/6/2019 11:54:54 am
Well, in a way, subsidence (deflation) is the slow, long, and drawn out collapse of any area of the ground. It isn't fully considered a real collapse, but whenever an area subsides (like Yellowstone is doing right now) it does sink. But on the order of a few millimeters per month, at least so far. Might cause some swarms here and there but I do believe uplift will begin again soon, as is the norm for Yellowstone. God bless! Leave a Reply. |
About
Please click a post title to view the data pertaining to that event! Archives
February 2020
Categories |
 RSS Feed