|
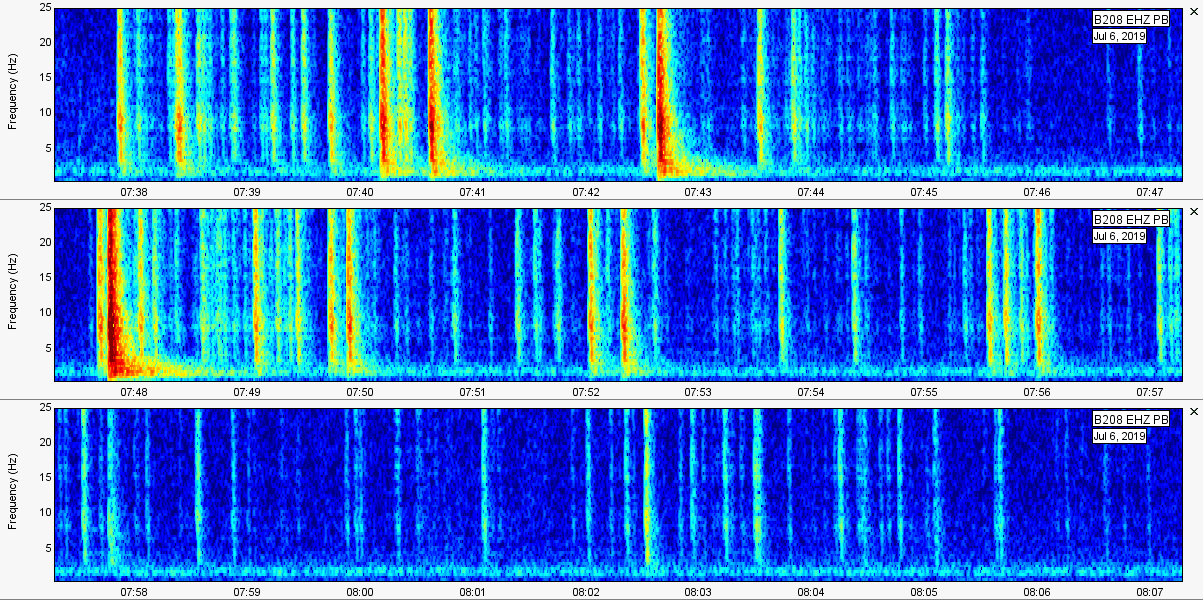
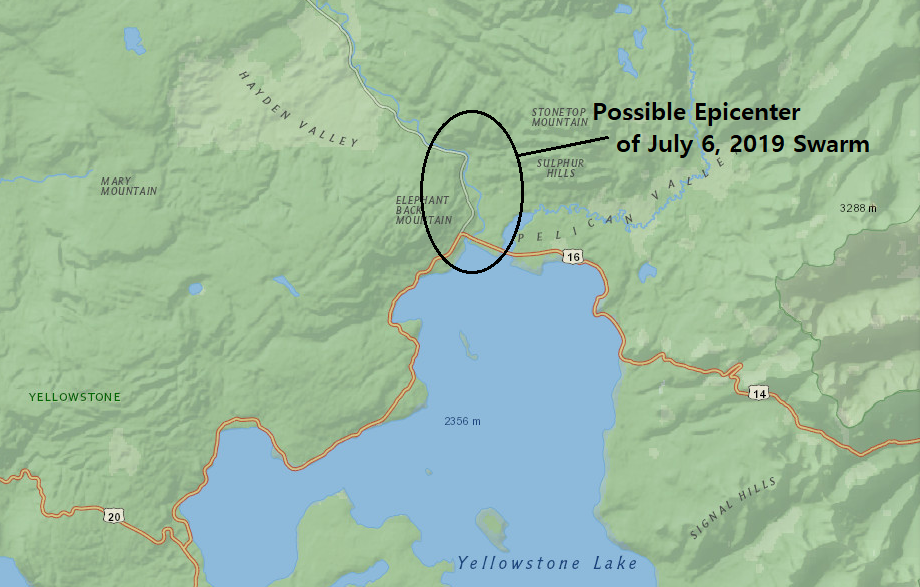
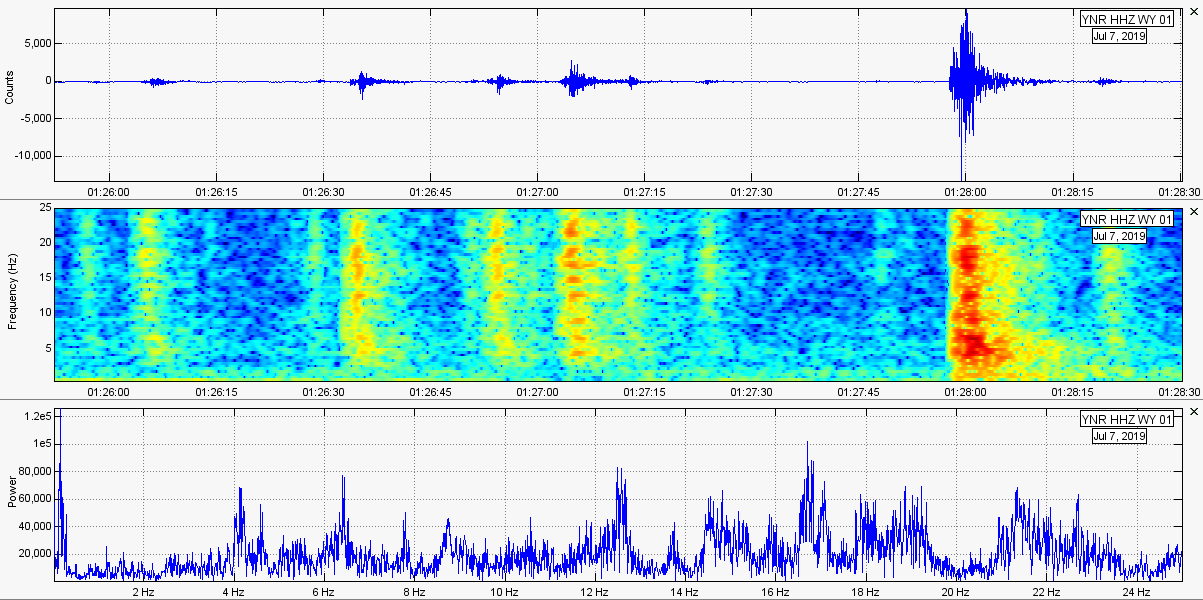
In this post I will show the usual seismic data and seismic audio pertaining to the small rapid-fire swarm at Yellowstone Lake on July 6, 2019. Please click the title of this post or "read more" to continue... First off, please click the USGS EQ map button above to see any reported earthquakes by USGS for this location and time period. Also, there is another button which will show you the location of every single seismic station in the Yellowstone National Park region. On July 6, 2019, a small rapid-fire swarm broke out likely under the northern tip of Yellowstone Lake. The actual earthquake epicenters have not been reported yet (as of 9:22pm PST July 7, 2019), however some likely will be in the next 1-2 days. The map above only shows a possible epicenter for these events and is likely incorrect. I used P wave cross correlation to try to determine the possible epicenter, though I am still far from being able to accurately locate earthquakes. Here are some details about this swarm: July 6, 2019 swarm: Start of swarm: 07:37UTC End of swarm: 08:08UTC (Total of 31 minutes.) Total earthquake count (includes even the tiniest, unreported events): ~80 events of all sizes, though most were extremely tiny. Reported count: None yet. Keep checking the USGS EQ map. Largest reported earthquake of this swarm: N/A (Although the largest was likely a shallow M2.5) Largest amplitude: ~125,000 (PB_B208_--_EHZ), ~3,700 (WY_YLA_01_EHZ) Severity: Minor DISCLAIMER: If you wish to see which earthquakes in the plots below were reported, simply go to one of the buttons I provided somewhere above that shows you the USGS earthquake map for Yellowstone during this time period. Earthquakes are reported in UTC and the times on the plots are in UTC as well. Also, I do not detail every single event of the swarm in the plots below. However, I do try to show most of them. Severity is a personal determination, with the April 11, 2018 swarm acting as a sort of baseline for a major rapid-fire swarm. Severity ranges from minor, to moderate, to major. In rare cases, “extreme” will be used. However, I have not seen a rapid-fire swarm that could ever be labeled as such, except for the April 11, 2018 swarm. But you never know what will happen in the future! Helicorder Plots Note: You can see the strong signature from the M7.1 in California appear just a few hours before the rapid-fire swarm occurred. Seismic Plots Seismic Audio The following is the seismic audio to this earthquake swarm, taken from the seismic station used for the plots above. All seismic audio is best heard when it is sped up. Please use your headphones but be wary of the volume! Every pop or crack you hear is an earthquake. Enjoy! Also, less than 24 hours later, an extremely tiny burst in seismicity broke out very close to the Norris area (possibly between YNR and YML). Here are the plots showing this baby of a swarm:
0 Comments
Leave a Reply. |
About
Please click a post title to view the data pertaining to that event! Archives
February 2020
Categories |


 RSS Feed