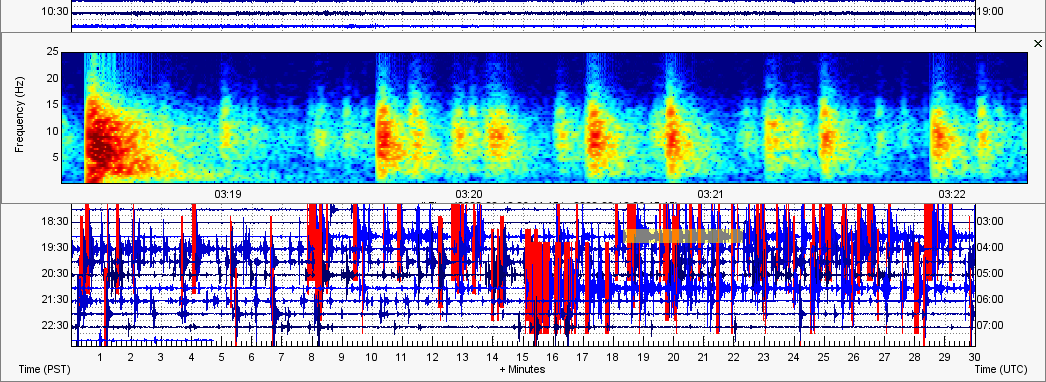
 January 2020 was one of the most mediocre and boring months for activity at Yellowstone. However, once February hit, microquake swarms started to increase around the infamous national park, including the caldera itself as well, and even a couple rapid-fire swarms like those we witnessed in 2018 (CLICK HERE for my page about the 2018 rapid-fire swarms at Yellowstone). This post is made to keep track of these earthquake swarms with brief information and seismic plots. This post will continue to be updated as activity progresses through the month of February 2020. Please click the title of this post or "read more" to continue... Resources Please use the two buttons below to either visit the USGS interactive earthquake map, for reported events during the entire month of February, or the IRIS seismic station map for Yellowstone. CLICK HERE to visit isthisthingon.org/Yellowstone which keeps a comprehensive archive of webiplots. Feb. 4, 2020 Maple Creek 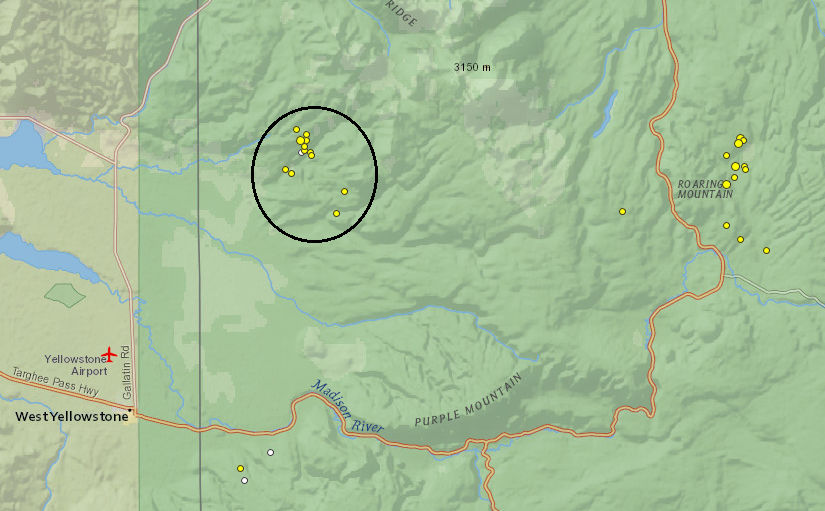 Helicorders in the slideshow below show this swarm from multiple surrounding stations: Details: -This microquake swarm struck slightly to the north of Maple Creek, Yellowstone. -This swarm started at 00:53UTC Feb. 4, 2020 and lasted until around 09:30UTC, with a few stragglers occurring after. -The main burst contained most of the seismicity for this swarm. It occurred at 06:59UTC and lasted only 15 minutes. -There were 11 quakes reported for swarm with largest M1.2 at 7.6km depth -For the main burst alone, which lasted only 15 minutes, there were approximately 42 earthquakes of all sizes, even ones that cannot be accurately located. Directly below are seismic plots from station YMC of primarily the main burst of this swarm. Directly below is a video which contains the seismic audio of some of this earthquake swarm, including the main burst, from seismic station YMC: Feb. 5, 2020 West Thumb Lake 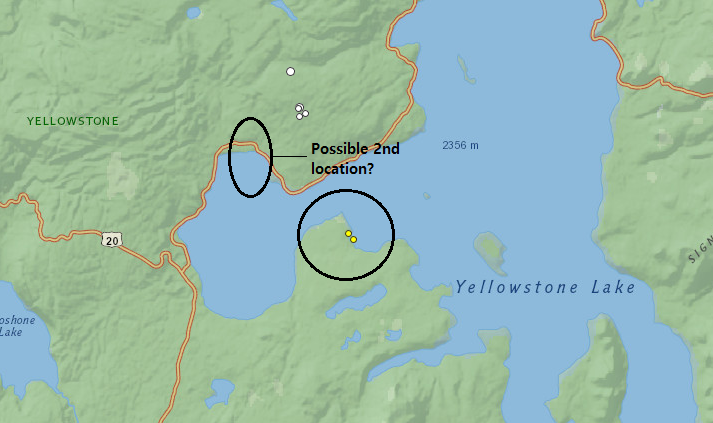 Helicorders of this swarm from nearby stations: Details: -Since only two earthquakes were reported, it is difficult to judge exact locations. However, this swarm likely struck somewhere within the circle on the map above. There was also a 2nd quick burst in seismicity that occurred much closer to station YLT, giving the impression the second burst occurred somewhere around the 2nd circle shown on the map above. I will show both bursts of seismicity now, starting with the first one. -First burst started at 15:23UTC on Feb. 5, 2020 and lasted only 27 minutes. Only two earthquakes were reported for this swarm with the largest being M1.0 at 4.7km depth. -There were approximately 33 earthquakes of all sizes within those 27 minutes. There could be more microquakes, but it is extremely hard to tell with how close they strike to each other. Plots below are of this swarm from station B944. -Second burst was small and quick, but very energetic. There were no reported earthquakes for this burst in seismicity which occurred much closer to YLT than the first burst I just showed. -The second burst started at 21:58UTC on Feb. 5, 2020 and lasted only four minutes. During those four minutes, however, around 23 microquakes struck very rapidly. Plots below are from the closest station, YLT. I only need two images to show this entire swarm, that is how short lived this swarm was. 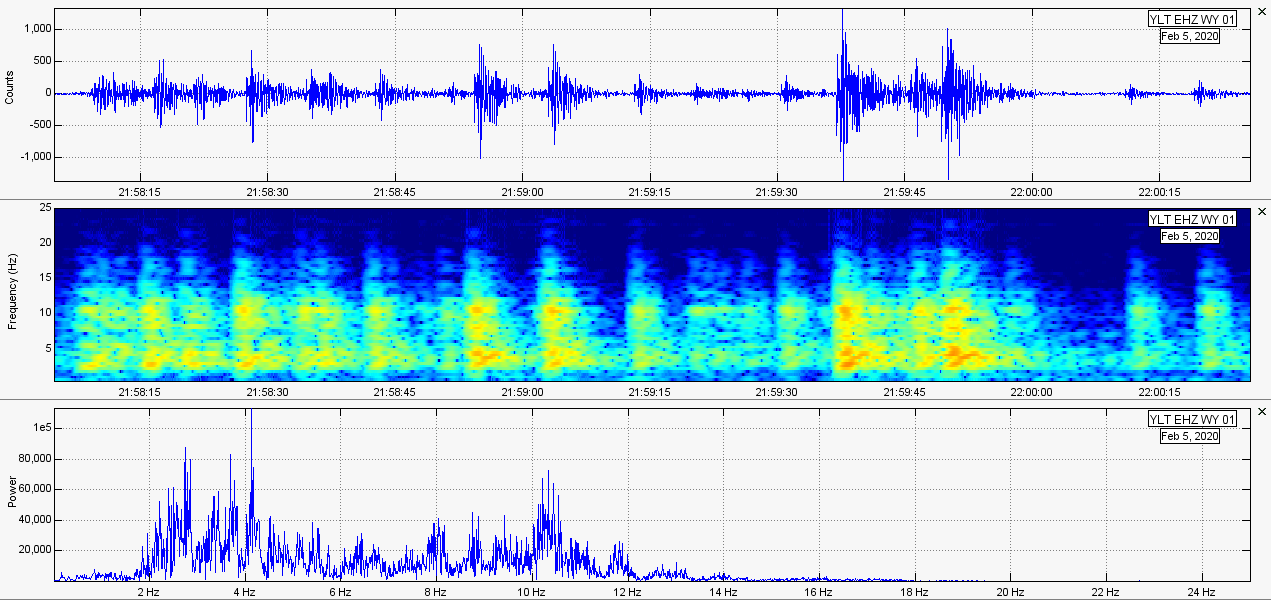 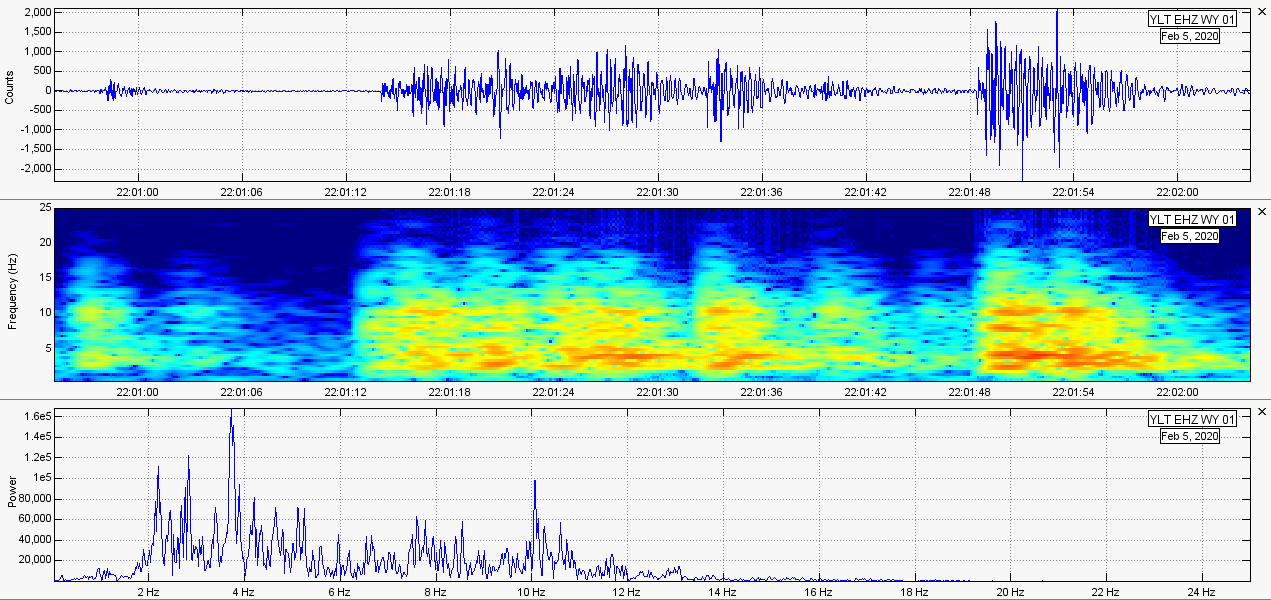 Feb. 5-6, 2020 near Norris Basin 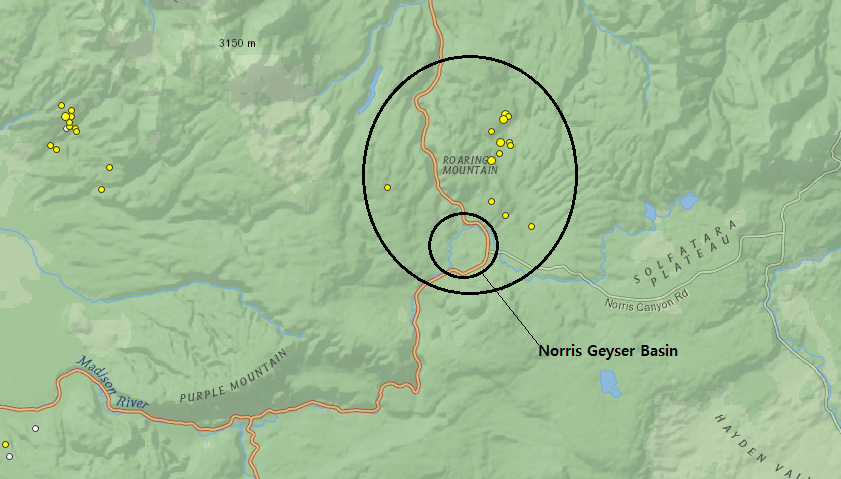 Helicorders below show the tiny swarm from neighboring stations: Details: -Another minor swarm took place around the Norris area on Feb. 5-6, 2020. Since there were two distinct bursts, I will deal with them separately. -First burst struck at 23:11UTC on Feb. 5, 2020 and lasted roughly 11 minutes. There were only two reported earthquakes for this burst of seismicity and both were M0.4. -For the first burst, which lasted only 11 minutes, there were a total of approximately 26 microquakes. Plots below are of the first burst only, recorded by station YNR. -Second burst started at 09:17UTC on Feb. 6, 2020 and lasted around 12 minutes, although there were three microquakes that struck later at 10:44UTC. There were 10 earthquakes reported for this burst of seismicity. The largest being two M1.7 microquakes. -The second burst, which only lasted around 12 minutes, contained approximately 28 microquakes, including the ones detected at 10:44UTC. The plots below are for the second burst, recorded by station YNR. Feb. 9 - North of Yellowstone Lake: Between Stations B208 and YUF 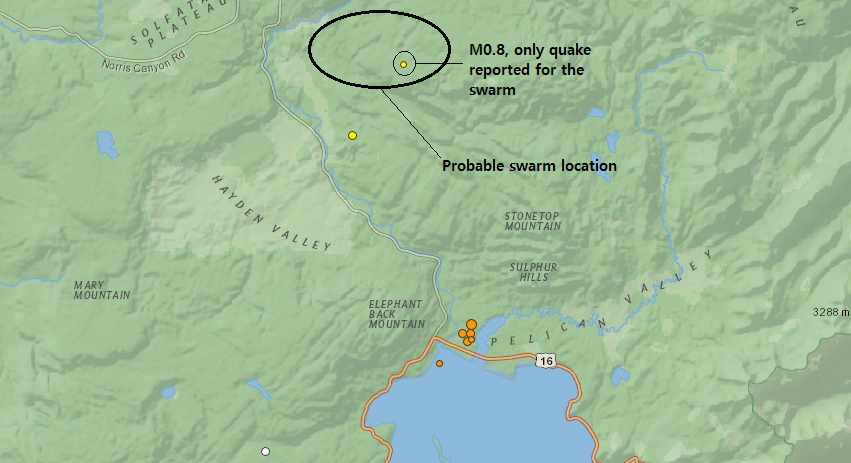 Helicorders in the slideshow below show this tiny swarm from neighboring stations: Details: -The location of this minor swarm occurred somewhere between seismic stations B208 and YUF, somewhere within the circle on the map image above, though it was closer to YUF due to the P arrivals. -The swarm started at about 08:43UTC on Feb. 9, 2020 and lasted around 13 minutes. However, there was another small burst at 11:01UTC that lasted around 7 minutes. For this whole ordeal, only 1 event was reported, a M0.8 and it occurred at 1.1km depth at 11:02UTC, during the 2nd burst. -The first burst saw approximately 18 microquakes and the seconds burst saw approximately 15 microquakes, with about one or two microquakes occurring between bursts. -The seismogram, spectrogram, and spectra plots below detail almost this entire microswarm. Feb. 10, 2020 Yellowstone Lake Swarm 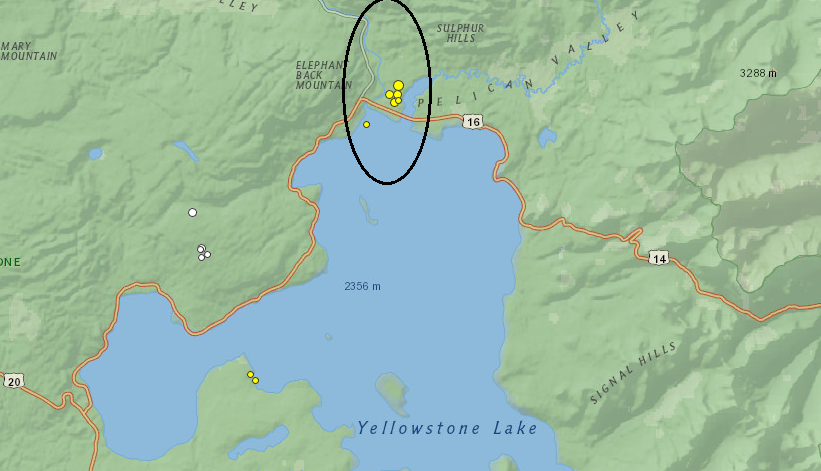 Helicorder plots in the slideshow below show the rapid-fire swarm from neighboring stations: Details: -This is the first legitimate rapid-fire swarm we have seen within the caldera for many months. It is still small compared to the energetic 24-hour rapid fire swarms in 2018. It struck right at the northern tip of Yellowstone Lake. -Only five earthquakes were reported for the swarm with the largest being M2.4 at 4.2km depth. -The swarm started at 12:55UTC on Feb. 10, 2020 and lasted approximately 47 minutes, however most of the swarming occurred within around 33 minutes. After the 47 minute swarm, there were still a few stragglers but the swarm had pretty much ended. -This swarm contained approximately 130 microquakes, though the majority of them were far too small to be located and reported. The plots within the slideshow below detail most of this earthquake swarm. If you wish to hear the swarm shown above, please watch the video below. Headphones are recommended and the data comes from station B208. This video contains seismic audio retrieved through the IRIS TimeSeries data tool. Enjoy! Feb. 11, 2020 - Between Lower Geyser Basin & Mary Mountain 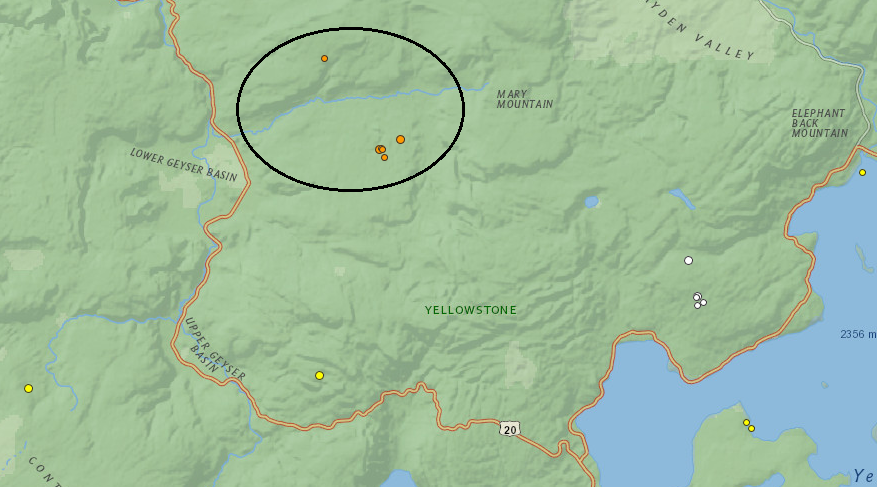 Helicorder plots in the slideshow below show this microquake swarm from neighboring stations: Details: -This swarm broke out to the east of the Lower Geyser Basin at Yellowstone, almost directly between the Lower Geyser Basin and Mary Mountain. -Only six earthquakes were reported for this swarm with the largest being M1.6 at 5.2km depth. -Swarm started at 09:14UTC on Feb. 11, 2020 and lasted around 22 minutes, with a couple earthquakes striking after that. However, the main burst of seismicity occurred at the start of the swarm and lasted only four minutes. -There were no more than 30 microquakes during the time period stated above, however many were far too small to be located. The first four minutes accounted for around half of the swarm. The plots shown in the slideshow below contain most of the events for this microquake swarm. The following video contains the seismic audio of this earthquake swarm. Headphones are suggested. Feb. 12, 2020 - Pitchstone Plateau 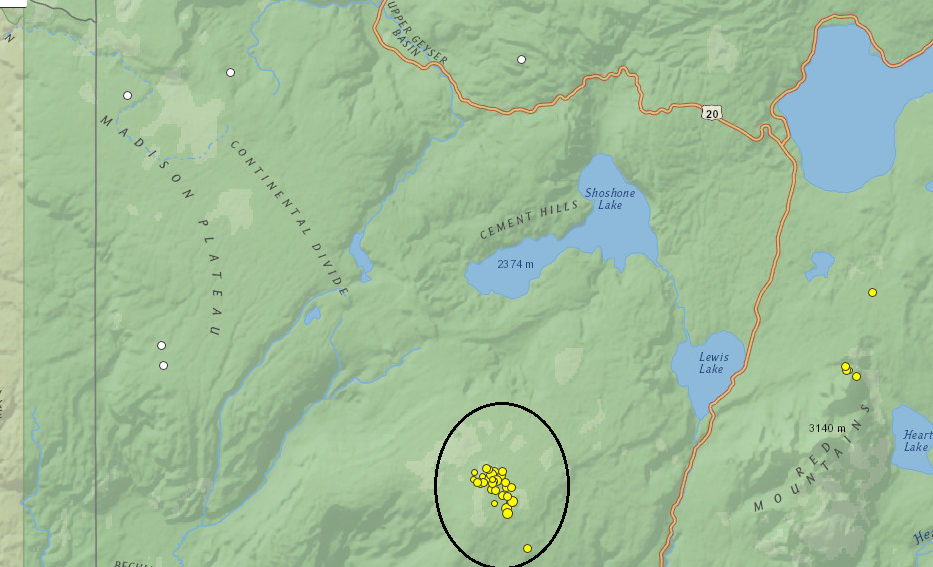 The helicorder plots in the slideshow below detail this swarm from multiple neighboring stations: Details: -This is the strongest rapid-fire earthquake swarm Yellowstone has seen since the August 29, 2019 swarm which occurred SSW of West Thumb Lake along the East Mount Sheridan fault structure. However, the swarm on Feb. 12, 2020 struck in a weird spot that does not see much seismicity compared to the rest of Yellowstone: Pitchstone Plateau… -This swarm so far has seen 36 reported events. The largest event was M2.3 at 2.9km depth with four additional earthquakes M2.0+. -This swarm started at about 03:08UTC on Feb. 12, 2020. The swarm mostly ended by 06:52UTC with some stragglers occurring after. That means this swarm lasted around 3 hours and 44 minutes. -Within almost four hours of swarming, at the very least there were 459 microquakes which struck within that time period stated above. It is likely there were more than 459, but many were extremely small and too closely spaced. -There are two slideshows below, each containing twenty-five 3-plot images. These will by no means show every single event. However, it will show a lot of them. Simply look at how many occurred so close together! This was definitely quite an intriguing swarm. The following video contains the seismic audio of this rapid-fire earthquake swarm. Every tiny, or large, pop or crack you hear is an earthquake. Headphones are suggested.
2 Comments
total flow
3/12/2020 12:20:44 pm
any updates for yellowstone ?
Shachaiah Sang
10/10/2020 04:50:37 am
Anyone know why we haven't heard from Ben? Leave a Reply. |
About
Please click a post title to view the data pertaining to that event! Archives
February 2020
Categories |
 RSS Feed