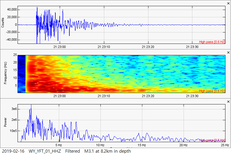
 On February 16, 2019 a small but energetic swarm struck right near Mary Lake at Yellowstone. This type of rapid fire activity does occur at many locations within Yellowstone, but most of the time the most energetic swarms are centered around Yellowstone Lake and West Thumb Lake. Please CLICK HERE if you wish to see my page dedicated to 18 rapid fire earthquake swarms near West Thumb Lake from 2018 to 2014. Prior to 2014, it was hard to find these at such quantity. However, I am getting off topic. If you wish to see the Feb. 16, 2019 rapid fire swarm near Mary Lake, which contained approximately 20 micro-quakes within 13 minutes, then please click the title of this post or "read more" to continue. 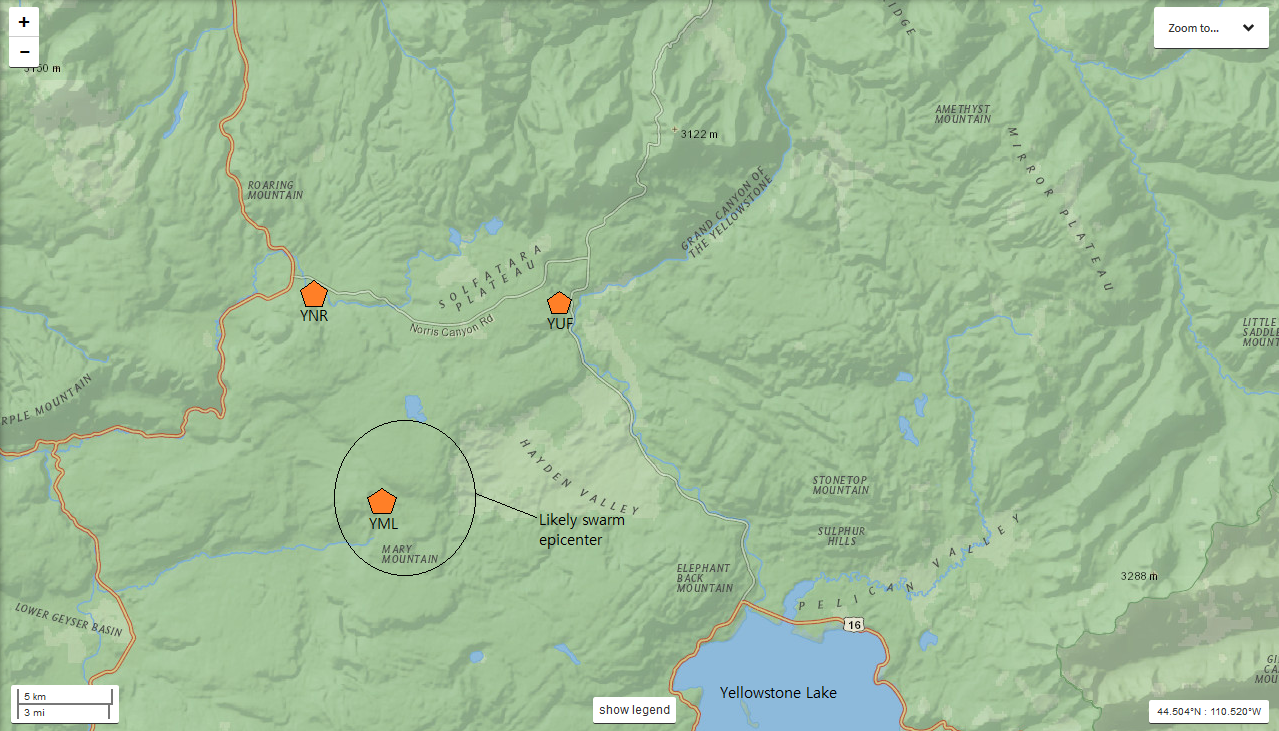 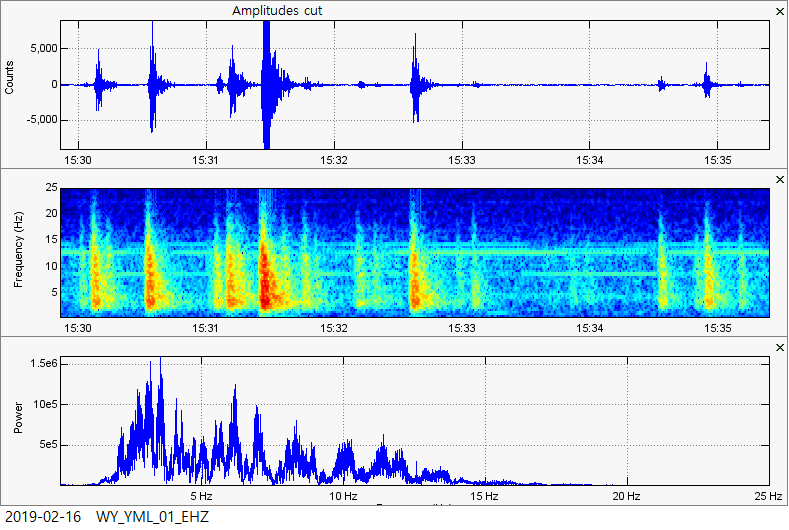 The first image you see above is a map of the area at Yellowstone just north of Yellowstone Lake. I have labeled and posted the locations to the 3 closest seismic stations to this minor rapid-fire micro-quake swarm. I have also circled the likely swarm epicenter based on P wave arrivals on neighboring stations. Sadly, none of the earthquakes within this swarm have been reported. However, as I am writing this, it is still Sunday so they may report some in the next 2 days and that image will be changed if so. The 2nd image you see, just below the map, is a 3-plot image that details roughly 85% of the micro-quake swarm. Based on the amplitudes on station YML, I believe the largest event of the swarm is anywhere between a M1.5 and a M1.9. The 3-plot image, just like all others, was generated by myself using the seismic program SWARM (and the program Paint). Here are some details of this swarm: Start of swarm: 15:24UTC End of swarm: 15:37UTC Total earthquake count (includes even the tiniest events): No more than 20 micro-quakes in 13 minutes. Reported count: 0 (so far) Largest reported earthquake of this swarm: None have been reported but may be in the coming days. Largest amplitude: 29,900 (YML) USGS EQ map for this swarm: CLICK HERE Severity: Minor Below I will show the helicorders of the 5 best stations near the swarm. Then I will show five 3-plot images detailing most of the swarm. Please remember, as always, to pay attention to all chart labels and any captions beneath any images. Now in the helicorder charts I just posted you will notice a much larger earthquake about 6 hours or so after the swarm I detailed on this page. If you wish to see info and plots to this event, please CLICK HERE. Or you can just look at the most recent USGS event page and 3-plot image of the M3.1 at 8.2km in depth below. This is the end of the post but it seems more seismic events may be occurring. Stay tuned to this page and multiple other ones for the most up to date information. However remember it takes a little while for me to generate a post. The best way to stay ahead is to learn how to find, access, and analyze seismic data. Multiple pages in the "How to" dropdown menu can aid you in this. 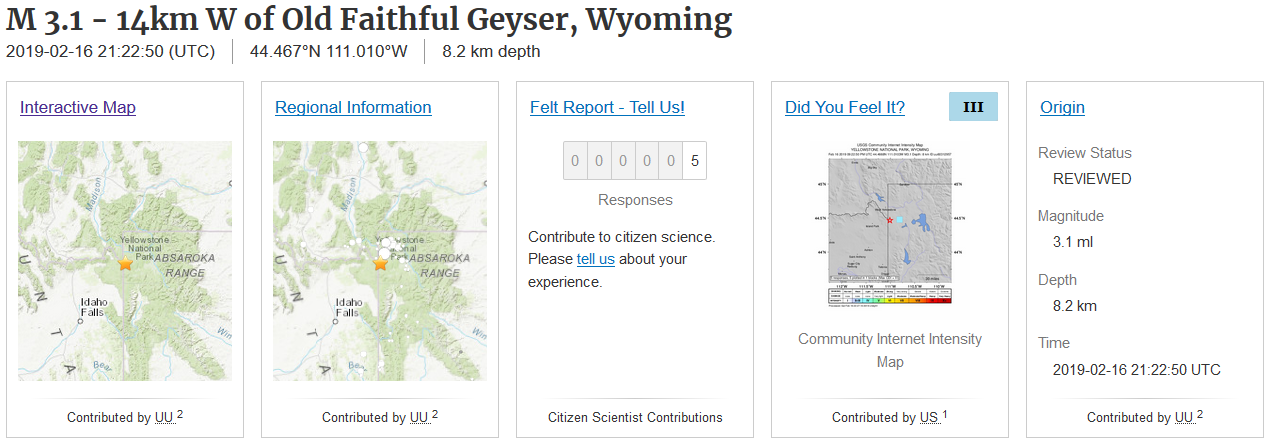 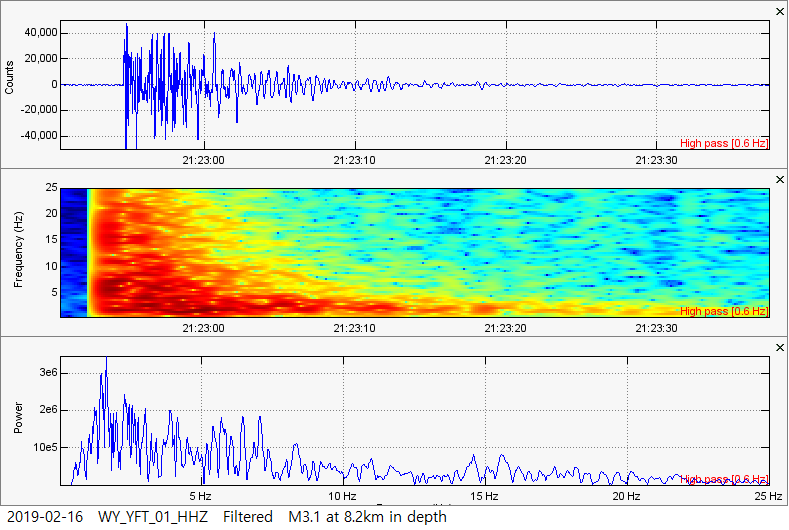
0 Comments
Leave a Reply. |
About
Please click a post title to view the data pertaining to that event! Archives
February 2020
Categories |
 RSS Feed