|
Hey guys. This is a very quick post which I originally made for my grandmother. My grandma loves all things about the Stromboli volcano in Italy. Eruptions are becoming larger and more frequent so I thought she would like a quick look at the type of activity I monitor and the way I monitor it. In this post I have a video for you to watch. It shows 3 select Stromboli eruptions from Skyline Webcams. I sat down and recorded their live stream with a pen and paper on hand. I then recorded 3 select eruptions and the times they occurred. Then, I went to the closest seismic station I could find to see if I could correlate each eruption to a vibration detected on that same seismograph (seismometer). What I found was pretty cool! Each lava explosion generates some good sized seismic signals. 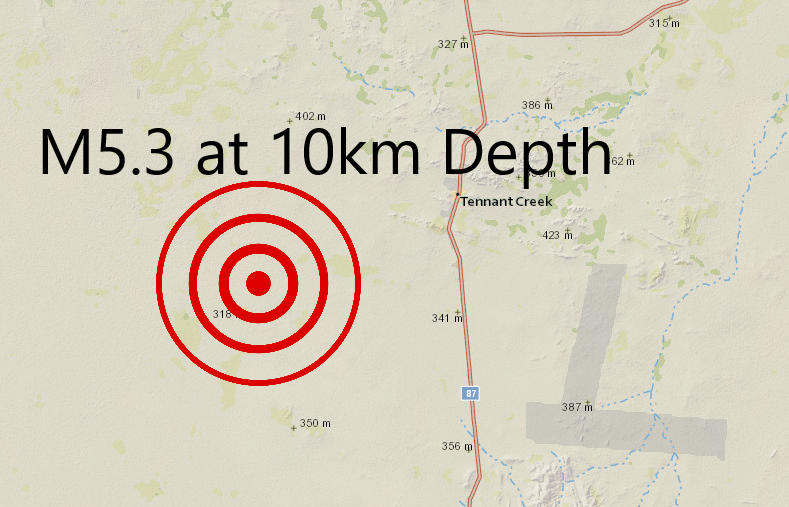 Above is a satellite image showing the location of seismic station ISTR in relation to the Stromboli Volcano. Seismic stations are used to detect ground vibrations and can detect anything from strong storms, volcanic tremor, earthquakes, and even footsteps next to the station. In this day and age volcanic eruptions can almost be forecast, as long as precursory seismic events are detected. Seismic stations can detect vibrations up to 50,000 times smaller than what humans can feel. Please watch the video below first. I have 3 eruptions selected and will label them in the video so you can compare them to the seismic plots beneath. These lava eruptions are strong enough to be detected on nearby seismic stations. Here is the video: Below are seismic plots of all 3 of the eruptions you just witnessed. Each image contains two seismic plots: a seismogram plot and a spectrogram plot. The seismogram plot, which is the top "blue" plot, displays ground vibrations and the strength of those vibrations. The spectrogram plot, which is the bottom "colorful" plot, displays the frequency of the ground vibrations and their relative strength as well. First Eruption 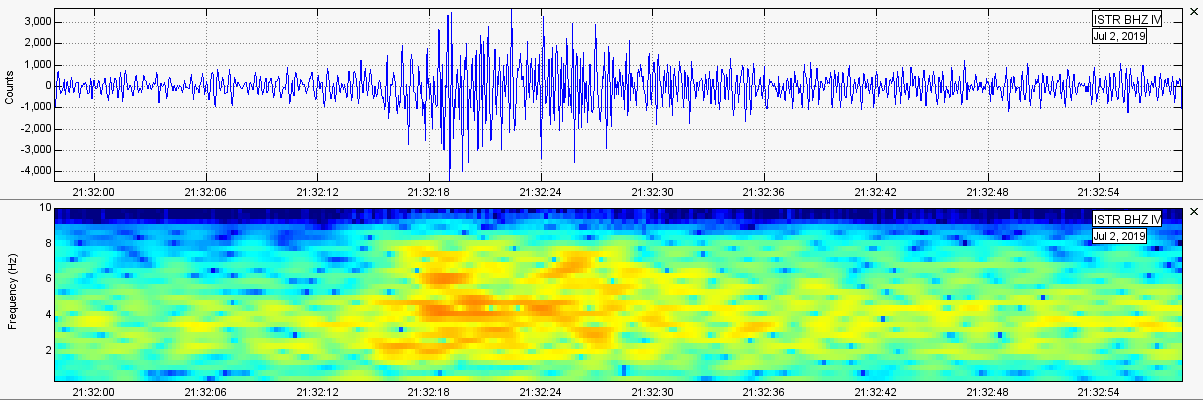 Second Eruption 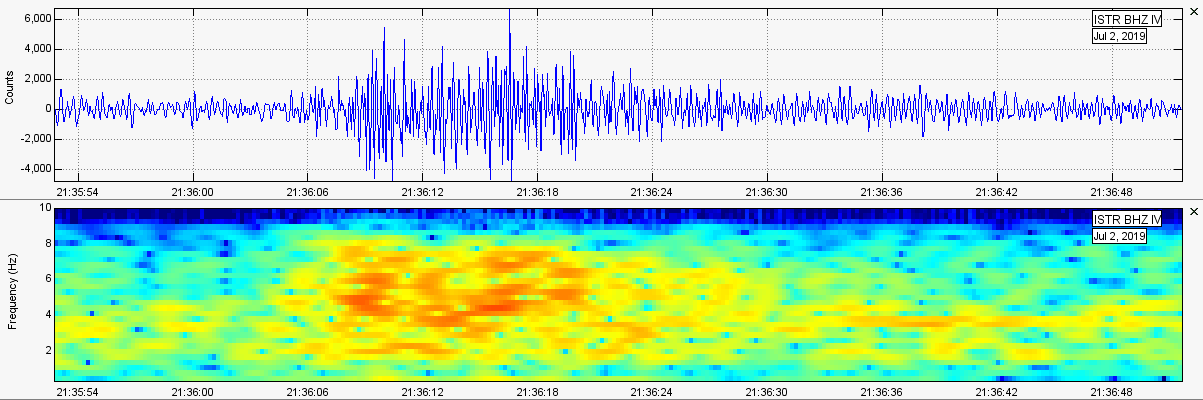 Third Eruption This image actually shows two eruptions. Can you see both of them? Sadly, I stopped recording the video above right when the other eruption happened. Oh well! The third eruption shown in the video is the first increase in energy shown in the image below: 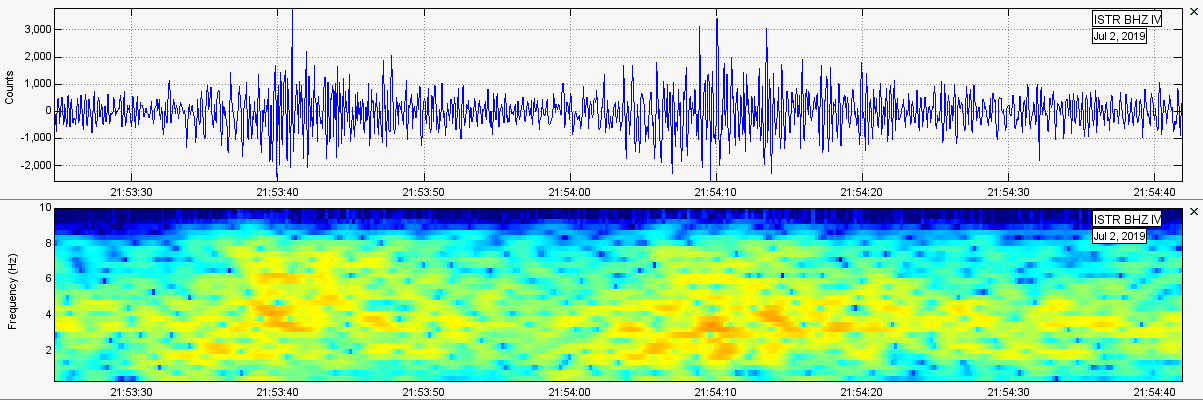
0 Comments
Leave a Reply. |
AuthorBen Ferraiuolo is a fast learner and someone who will always stand for the truth. Visit "About Me" for more! Archives
November 2019
Categories |
 RSS Feed