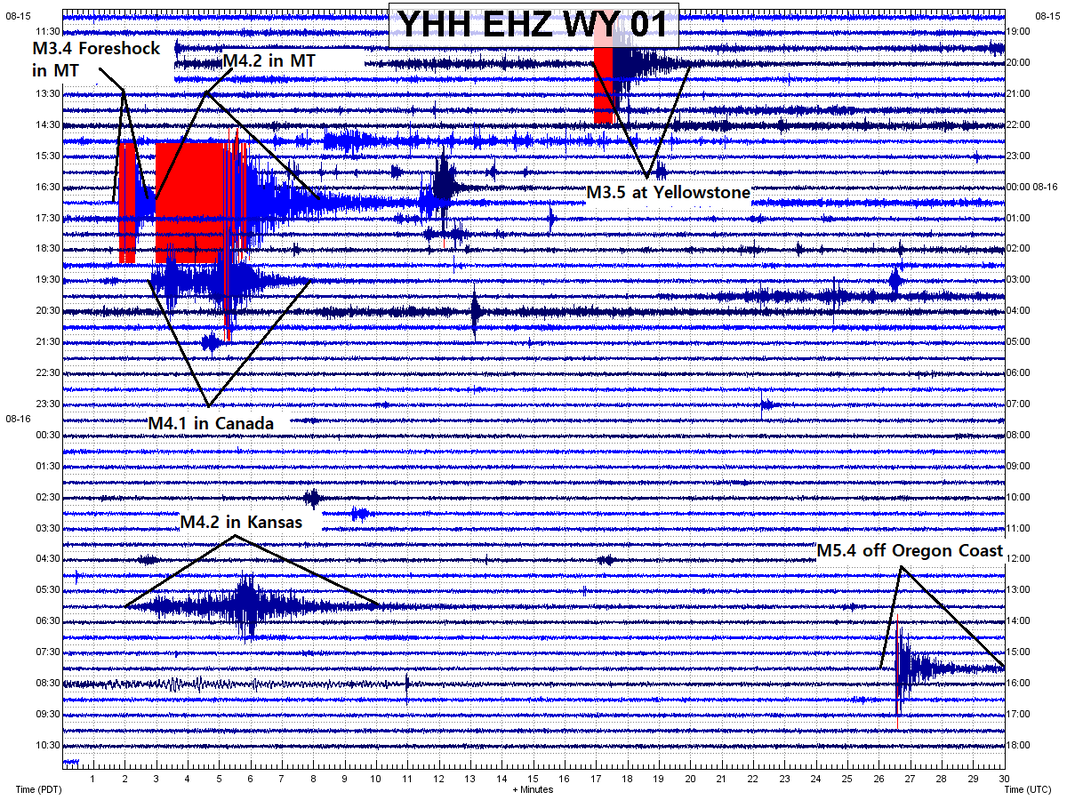
 On August 15, 2019 at 19:46UTC, a M3.5 earthquake struck the southern border of Yellowstone National Park. This was the start of a 20 hour period of increasing seismicity for the United States and Canada. It was the largest earthquake to strike Yellowstone in just over 2 years and was detected on seismic stations hundreds of miles away. During this time frame, about 4 1/2 hours after the M3.5 at Yellowstone, a M4.2 struck Manhattan, Montana, including multiple foreshocks leading up to the M4.2. Almost 2 1/2 hours later, a strange M4.1 struck in an odd location in Southeast Saskatchewan, Canada. Then, about 10 1/2 hours later, a strong M4.2 struck South Hutchinson, Kansas. Finally, the seismicity calmed after a M5.4 struck off the coast of Oregon along the Blanco Fracture Zone, approximately 2 hours and 23 minutes after the M4.2 in Kansas. All of these events can be seen on the helicorder above, which is from station YHH at Yellowstone. So, what caused this apparent increase in seismicity? North America was somewhat calm prior to this, except for the occasional M3 or so in California. Were all of these just a coincidence? It is up to you, seeing I do not have the answer for that. I will, however, show some data pertaining to these seismic events. Please click the title of this post or "read more" to continue... Resources 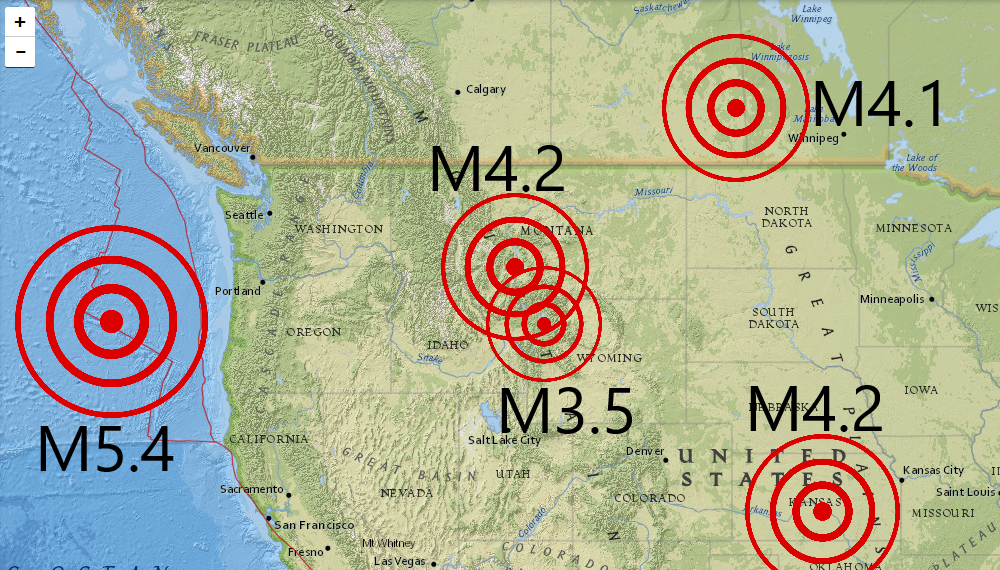 First off, please CLICK HERE to visit the USGS EQ map for this location and time period. You can use it to look at the locations and times of each event I show. Also, for the plots in this post, I will always use the closest available seismic station to show these events, unless otherwise stated. To discover the location of each station I use, please CLICK HERE. I will show these events in order, starting with the M3.5 at Yellowstone. Also, for information about every fault known to USGS, please CLICK HERE to visit their interactive fault map. It is highly useful for some of these events. M3.5 at Yellowstone 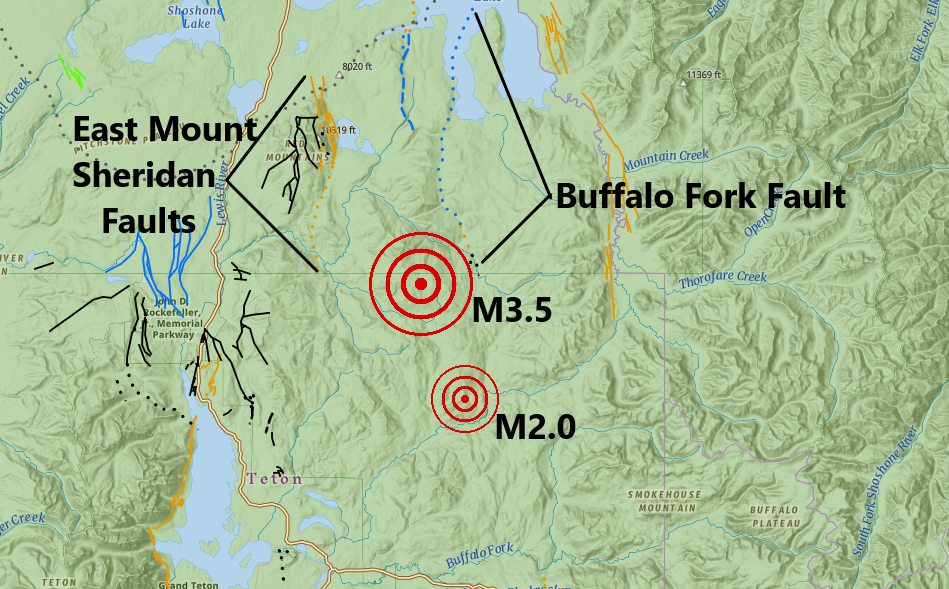 The location of the M3.5, and 2.0 foreshock, in relation to the two nearest fault systems. It does not appear to have occurred on any fault. 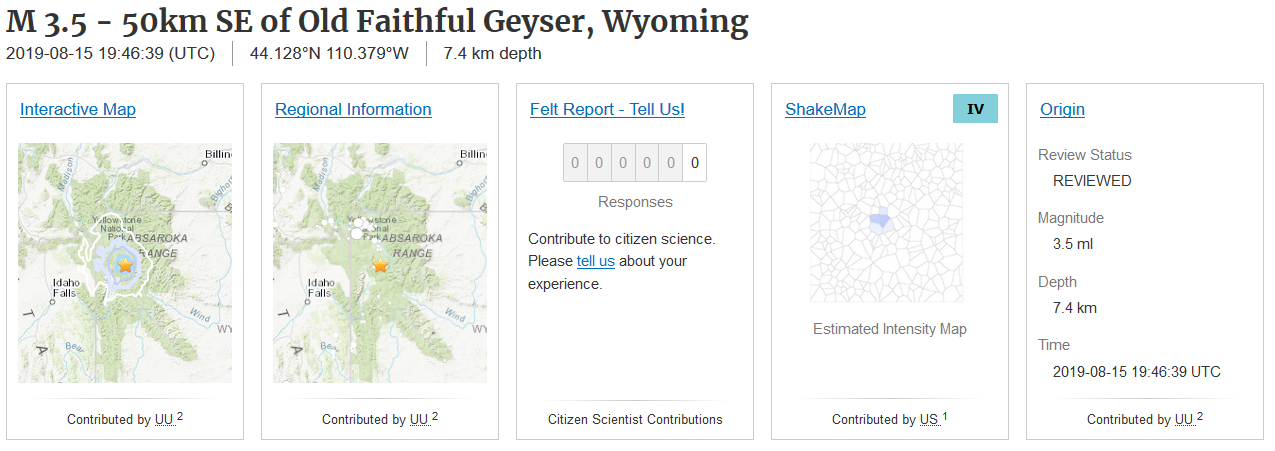 On August 15, 2019 at 19:46UTC, a M3.5 earthquake struck the southern border of Yellowstone National Park at a depth of 7.4km. This was the start of a 20 hour time period of increased seismicity for the United States and Canada. Not too many earthquakes occurred as part of this increase, but quakes did start striking in odd places with magnitudes that haven't been seen for a while. Are all of these a coincidence? You be the judge. About 11 hours or so prior to the M3.5, a M2.0 struck just to the southeast, making me feel the M2.0 was a foreshock. The M2.0 struck at 8.9km in depth. As you can see via the map image above, these two events did not occur on any known fault system. It is possible it occurred on the southern end of the Buffalo Fork Fault, however I do not believe that is the case. A few small aftershocks no larger than M1.8 struck after the M3.5. This is also the largest earthquake to strike within the Yellowstone National Park boundary since the M3.6 near Maple Creek on July 18, 2017. Just over 2 years! So, what caused this event? And why did it occur in such a strange location? CLICK HERE to see recent earthquakes over the past years at Yellowstone, M3.5 and above. Below are some plots of this event, and the M2.0 foreshock. Pay attention to image captions and all chart labels! 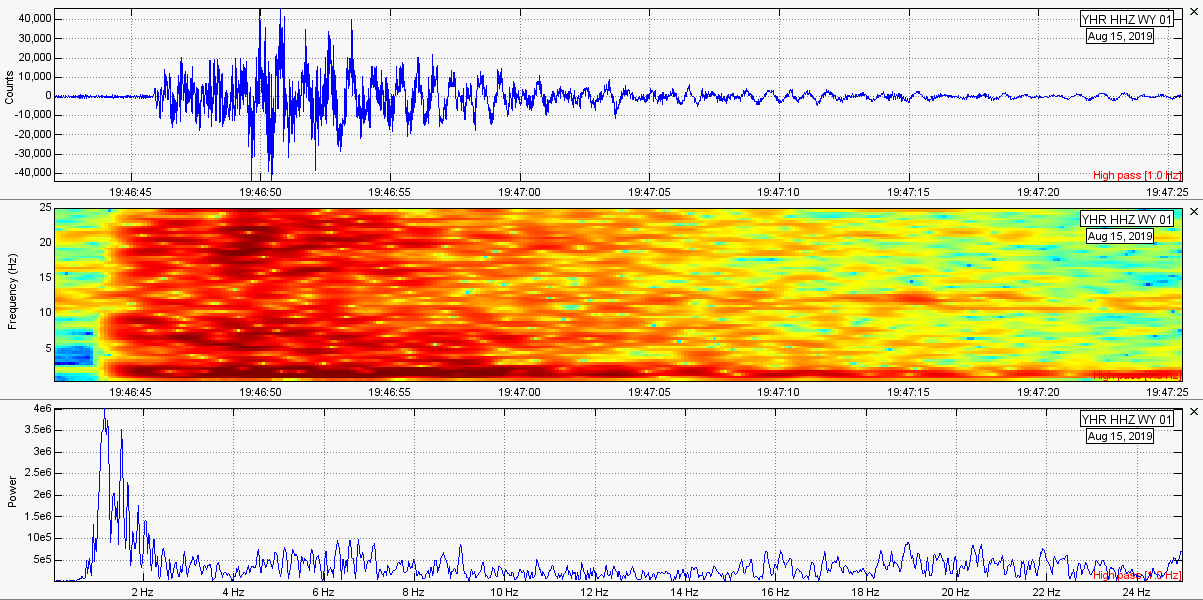 M3.5 at 7.4km in depth with a 1Hz high pass filter. 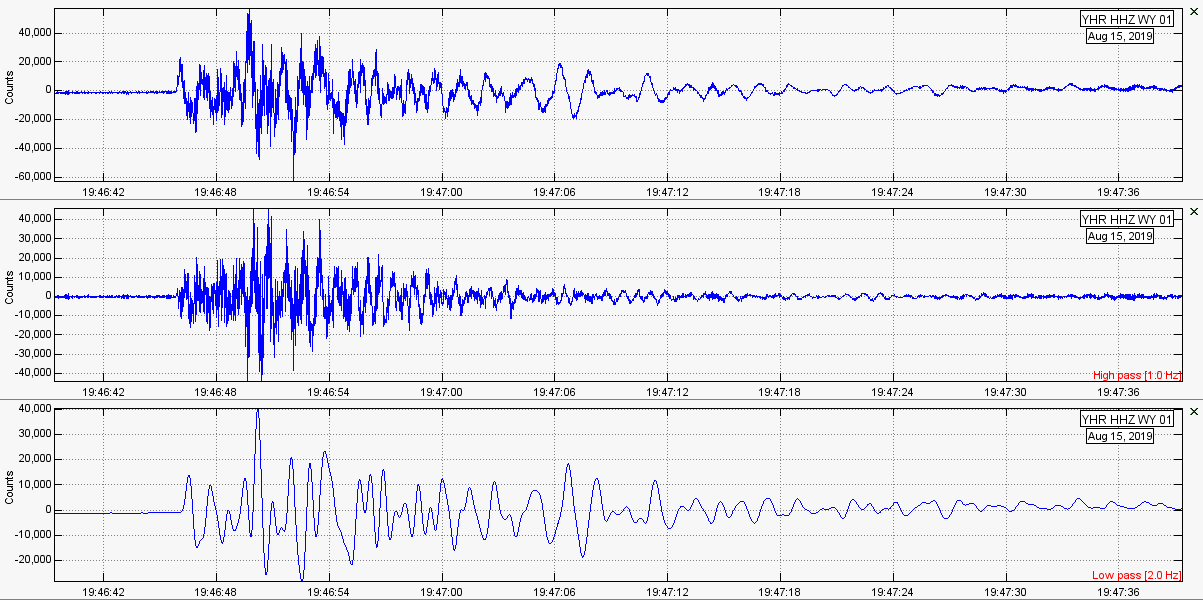 Three seismograms for the M3.5, each from the same exact station. However, the top plot is unfiltered, the middle plot has a 1Hz high pass filter, and the bottom plot has a 2Hz low pass filter. Although this was not a low frequency earthquake, it sure did have some very strong lower frequencies which seem to be stronger than the higher frequencies. Very intriguing!  Plots of the barely noticeable M2.0 foreshock, which struck at 8.9km in depth about 11 hours prior to the M3.5. The M2.0 struck just to the southeast of the M3.5. M4.2 in Manhattan, Montana 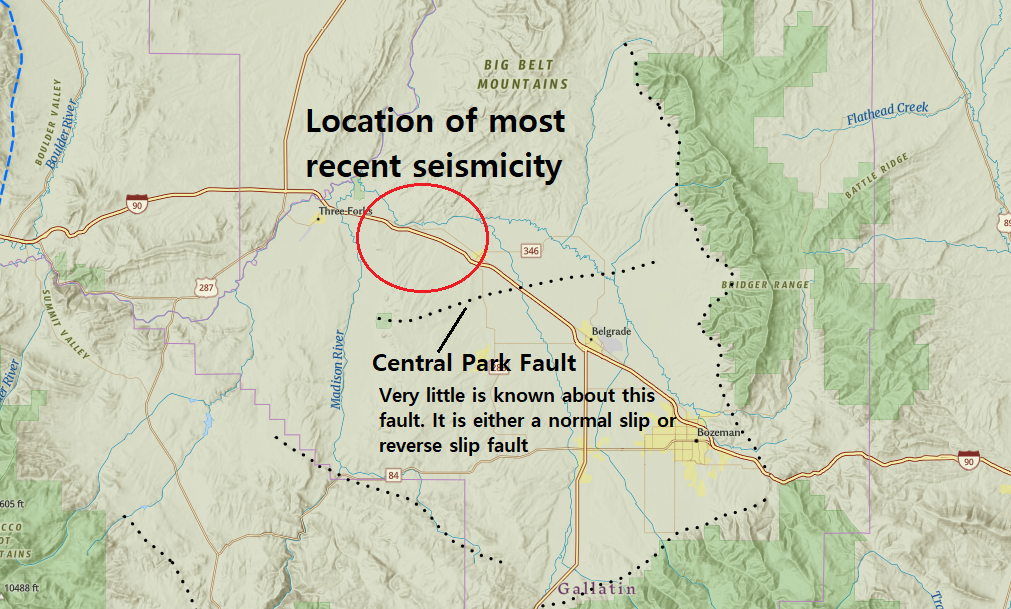 Location of recent seismicity in Montana compared to the nearest fault system. 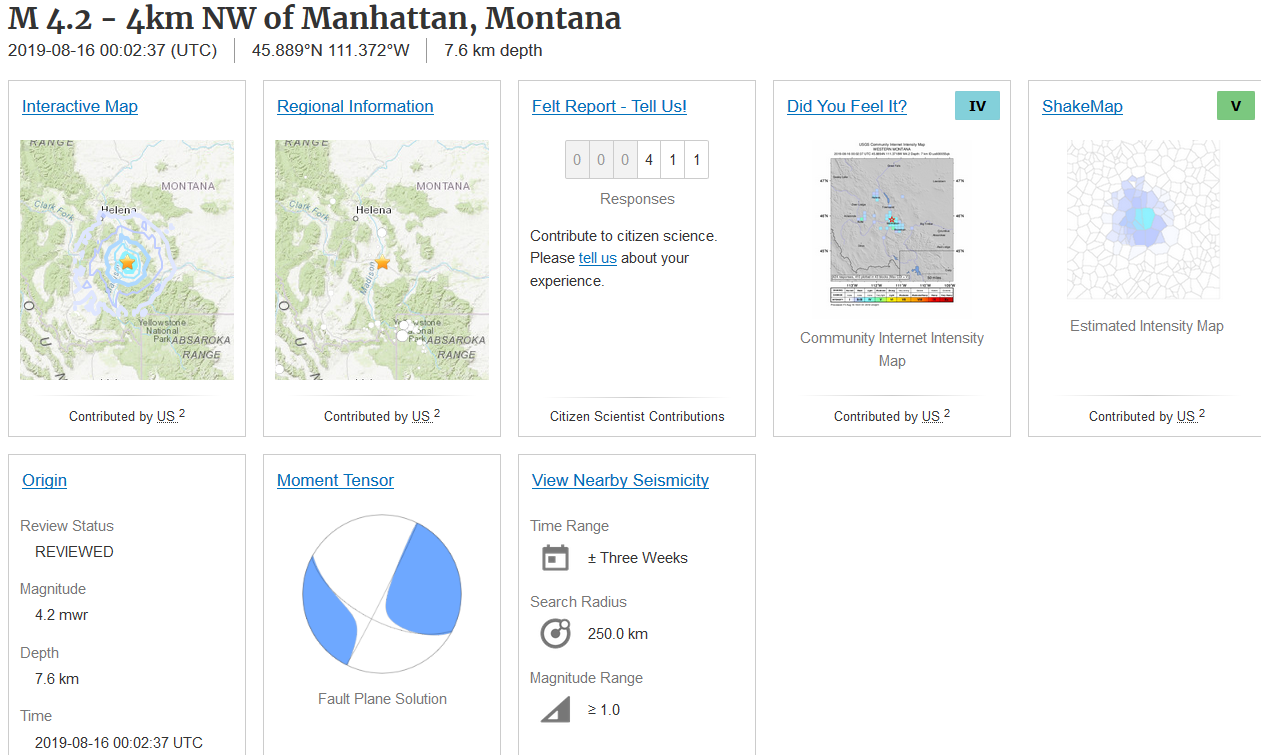 Montana is no stranger to earthquakes. In fact, Montana experiences M3 and M4 events every now and then. However, something has recently changed for the Manhattan, Montana area, the area which is circled in the map image above. About 4 1/2 hours after the M3.5 struck Yellowstone, a strong M4.2 struck Manhattan, Montana. It struck at 7.6km in depth and over 400 people reported feeling this event. To witness an earthquake largest than this for this area or in the immediate vicinity, you would have to go all the way back to the M4.5 of August 27, 1977! It struck to the northeast of this recent M4.2. The moment tensor of this event is a little sketchy, however it looks like, and I am no professional, a mix of strike-slip and normal faulting. I could be wrong. Although earthquakes around this region do occur, it is notable that already three M4+ events have struck around Mahattan, Montana since July 14, 2019. It originally started with a M3.7 in February of this year, 2019, but then a M4.0 struck on July 14. Numerous quakes around M2 and M3 struck afterwards, making the USGS think they were aftershocks. I would have agreed with them, however on August 6 a M4.1 struck and now this M4.2 only 10 days later. Are these all possible foreshocks to a larger earthquake along the Central Park Fault? I think it is entirely possible since it seems like seismicity, and the magnitudes thereof, are increasing for this area. Please CLICK HERE to visit the USGS EQ map for seismicity in this area M3.5+ since 1920. You can tell 2019 has been by far the most active year for this area. However, in the 1920s, there were a couple mid-range M5s not far from Manhattan, Montana. Very little is known about the Central Park Fault system near Manhattan, Montana. The mapping certainty of this fault is labeled as "poor", so these events very well may be related to this fault line waking up. It has very poor surficial expression, so I doubt we would know exactly where and how large this fault is until it fully re-awakens. However, I doubt it could surpass a M6.5, if that. Below are plots of the M4.2 and it's 3 main foreshocks leading up to it. Images are in slideshow format. The strongest one you see is the M4.2. Strange M4.1 in Canada 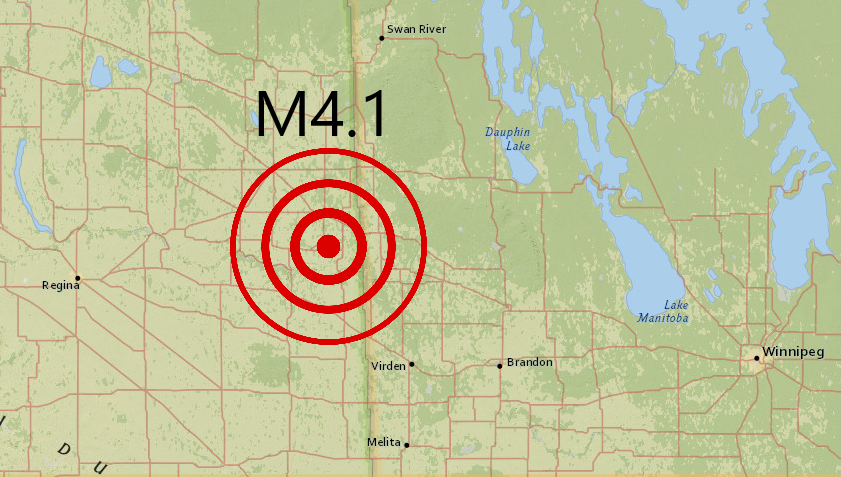 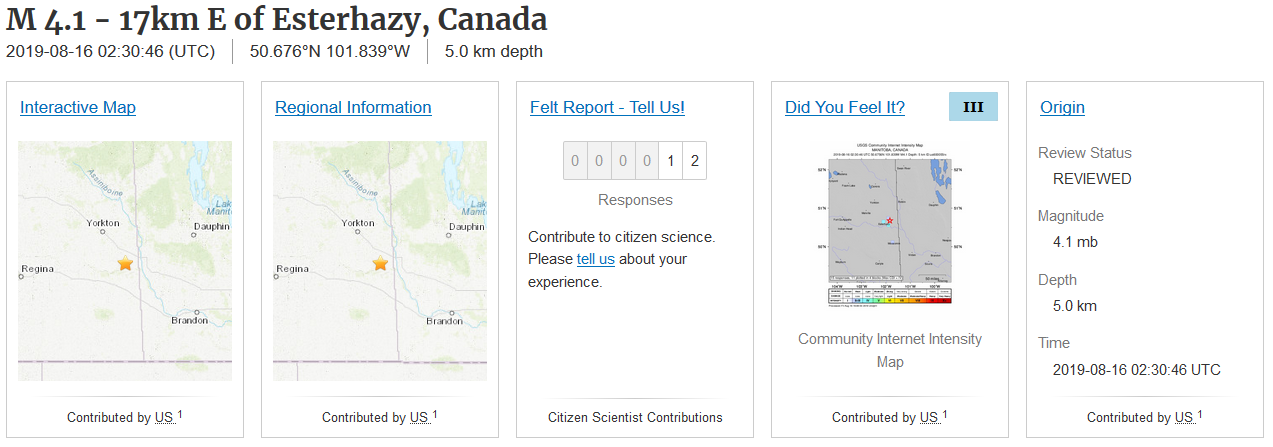 To add to the strangeness and timing of this increase in seismicity, a M4.1 struck in an odd location in Southeast Saskatchewan, Canada. It supposedly struck at 5.0km in depth and 12 people in the area reported to USGS that they felt this event. The most recent earthquake in this area prior to this one was a M3.9 "Induced or Triggered" earthquake at 1.0km in depth on April 13, 2018. Induced or triggered events are either caused by fracking (waste water injection) or purposeful relief of tectonic pressure by humans. However, this area has seen some moderate seismicity since 1920, all of which occurred since 1988. It is likely this area has seen an increase in seismicity due to fracking. I know people always blame fracking, and sometimes rightfully so, but this area really has seen induced or triggered events before. But why would all of these quakes occur within 20 hours? Especially this M4.1 that occurred? Very odd. Below are plots of this event. 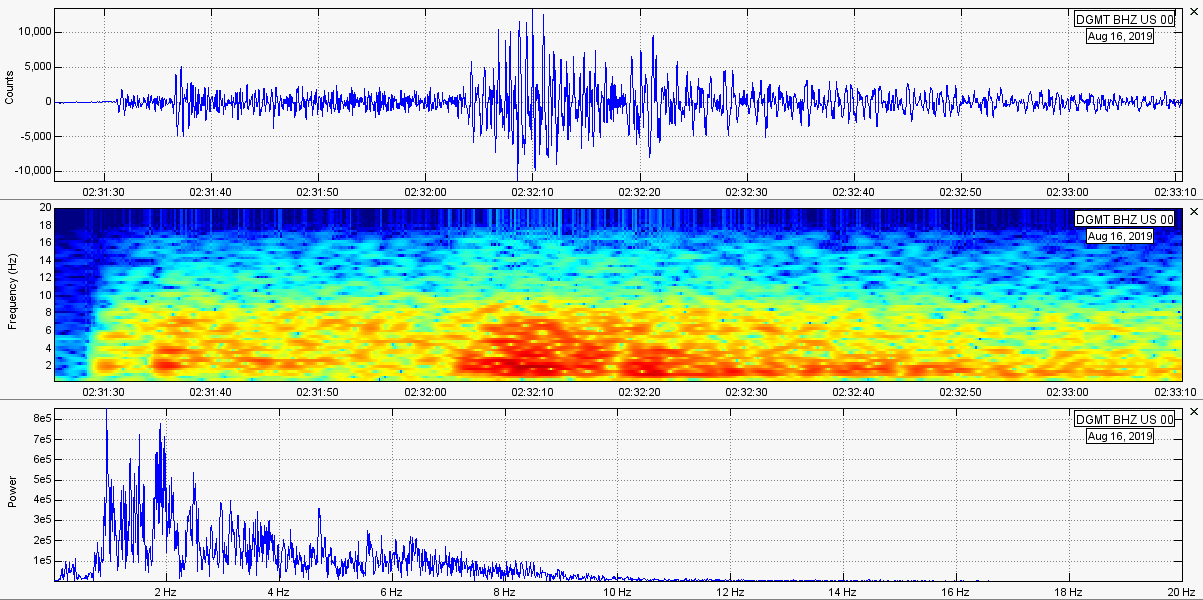 M4.2 in Kansas 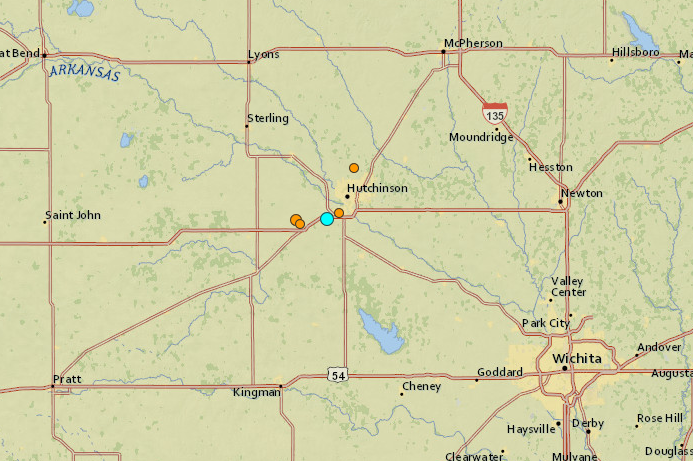 The location of the M4.2 in Kansas is marked in blue. Orange dots are aftershocks. 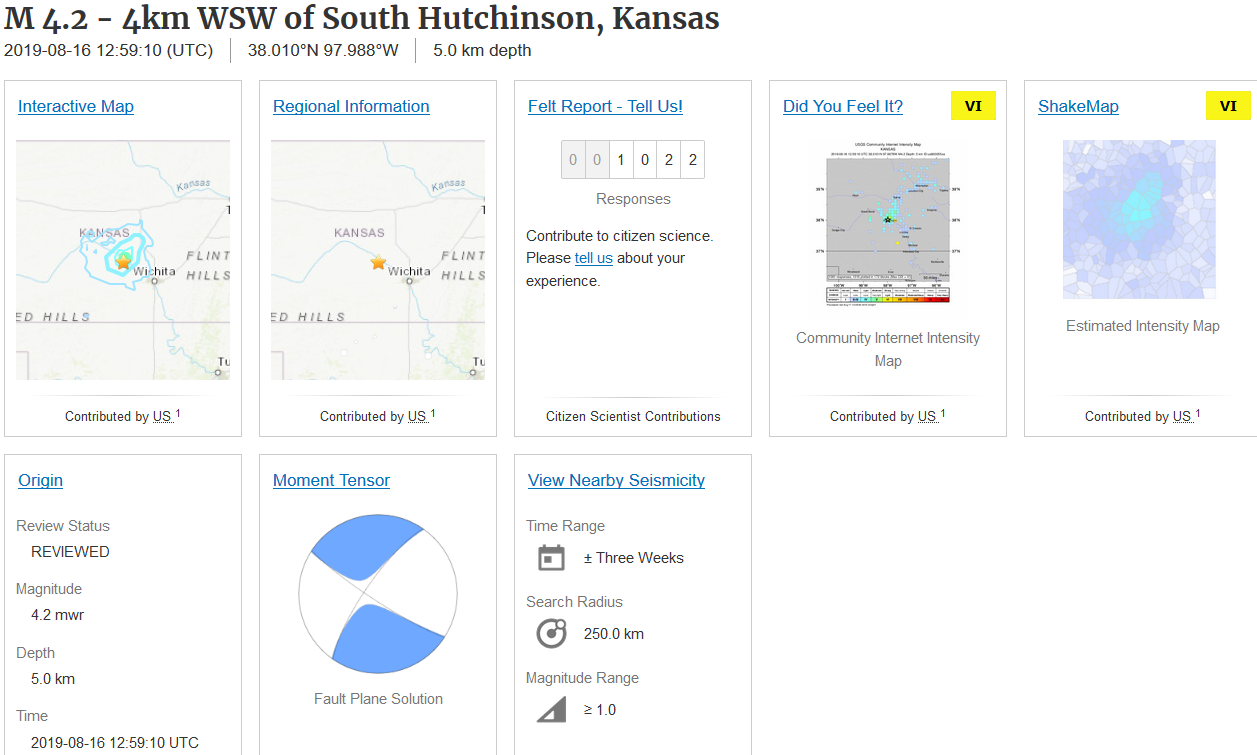 About 10 1/2 hours after the M4.1 in Canada, a very strong M4.2 struck at 5.0km in depth near South Hutchinson, Kansas. Over 1,000 people reported feeling this event, with a few reports indicating moderate to strong shaking. No building damage was reported, but minor damage to people's belongings were reported. Below are plots of this event from the closest seismic station. 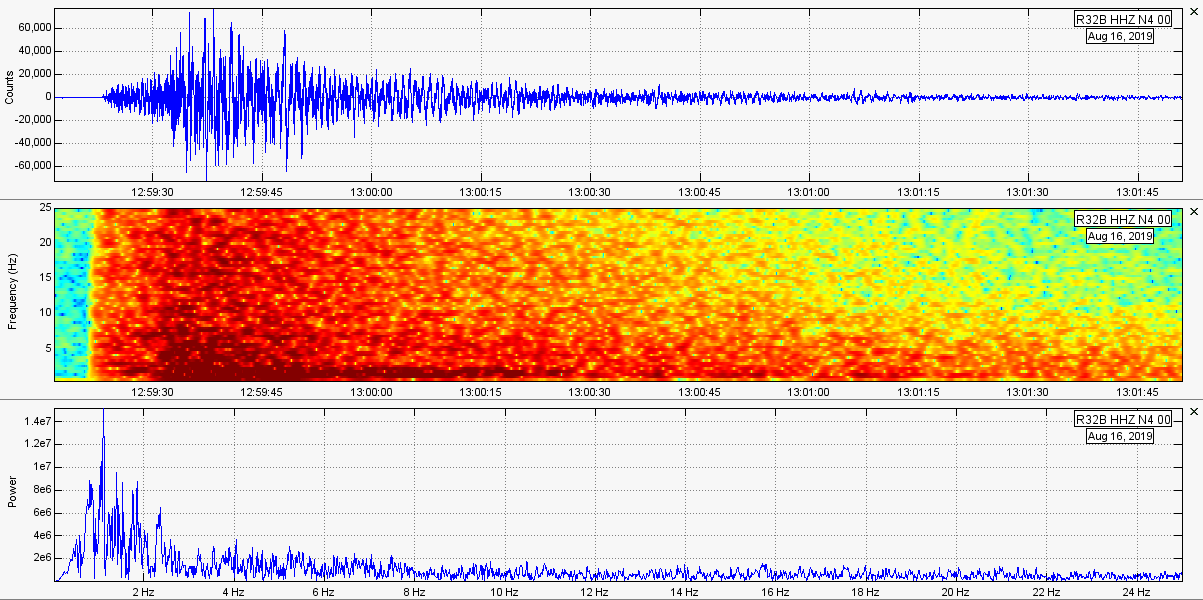 There were also a few aftershocks reported within just an hour of the mainshock. Below are plots from the closest seismic station of the largest aftershock, which was reportedly a M3.1 at 5.0km in depth to the west of the mainshock, about 10 minutes or so after. 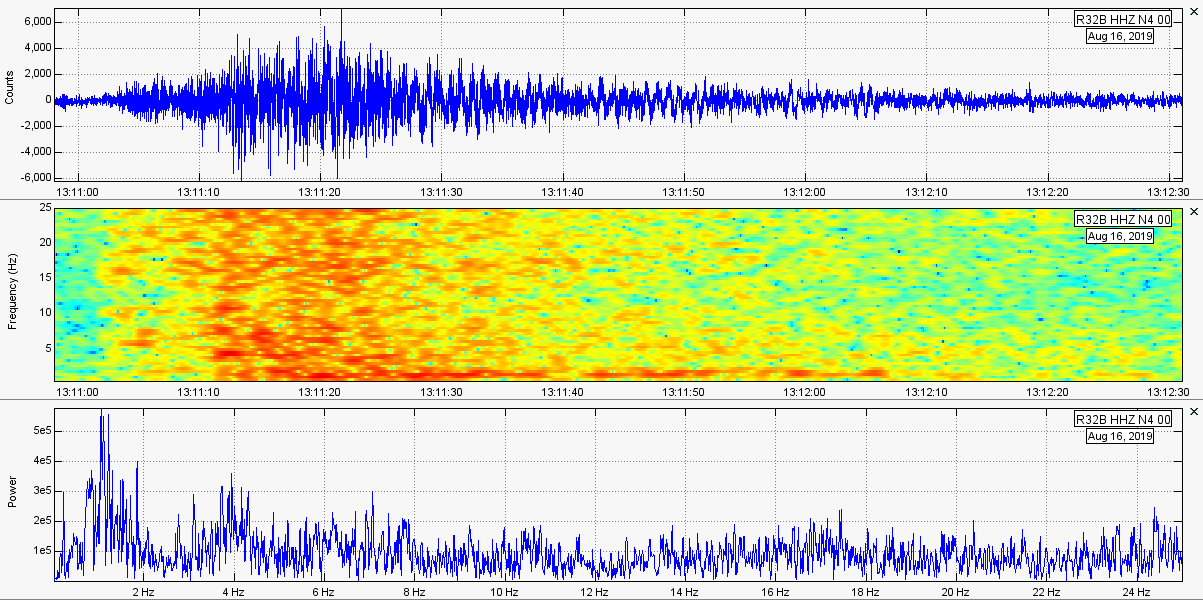 M5.4 off Oregon Coast 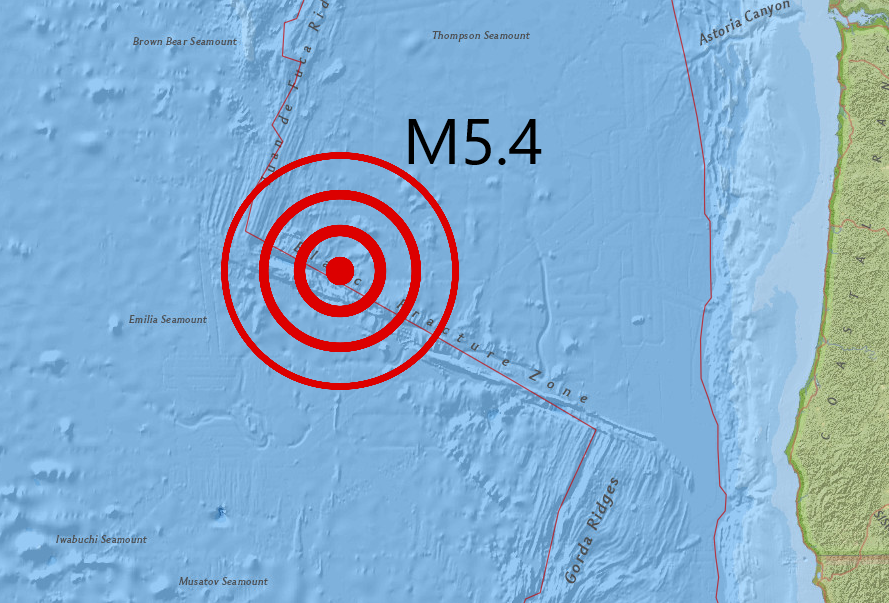 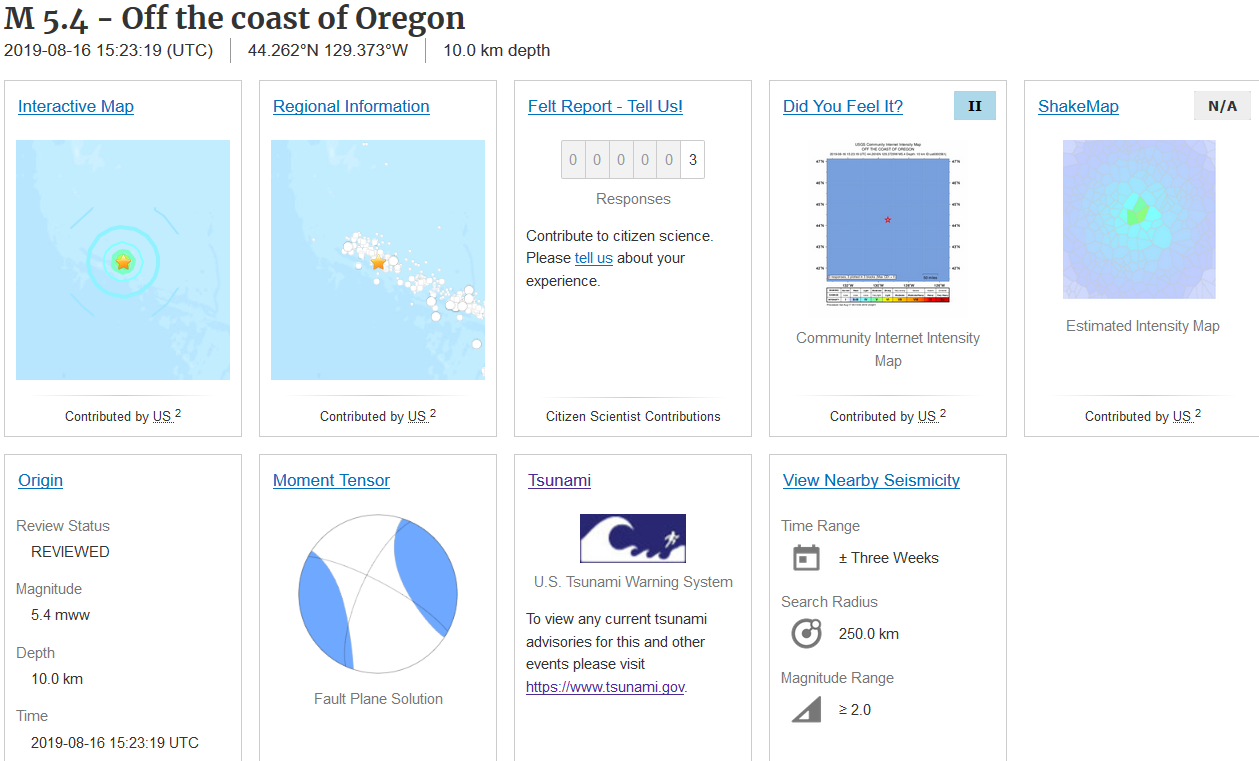 About 2 hours or so after the M4.2 in Kansas, this interesting increase in seismicity came to a close with a M5.4 striking supposedly at 10km in depth off the coast of Oregon. It struck along the Blanco Fracture Zone, notably the northwestern part. Surprisingly, 3 people reported feeling this earthquake. If it struck along the coast, that number would be much higher. However, it is hard to feel a M5.4 that occurred as far away as it did. Regardless, a few people definitely felt it. The Blanco Fracture Zone is the epicenter of much seismicity in the past. It is a right-lateral transform fault trending southeast to northwest, approximately 350km long, and has actually been the location of numerous volcanic eruptions in the past. Most earthquakes strike along the Blanco Ridge with a strike-slip style event. However, this day's M5.4 occurred far to the northwest of the Blanco Ridge. In January of 1994, an earthquake swarm intrigued scientists watching the Blanco Fracture Zone. According to wave data pertaining to these events, scientists were able to determine a volcanic eruption had occurred. However, as more investigations took place, they discovered a large hydrothermal vent which was the first to ever be discovered along a transform fault. As this area spreads and wreaks havoc on the ocean floor, it is only common sense that magma would rise to fill the gaps. Undersea eruptions in this area do occur from time to time, likely with many going unnoticed. This M5.4 was quite strange regarding its frequency and waveform characteristics. The frequencies of this event were far lower than what I would expect. Of course, station KEB in the NC network, the closest station to this event, is quite a distance away from the epicenter. However, I have seen earthquakes occurring in this location in the past that did not carry such lower frequencies. Below are plots of this event from the closest seismic station: NC-KEB. I have 3 images in a slideshow. The first is unfiltered, the second has a 1Hz high pass filter, and the third has a 2Hz low pass filter. Look at the dominant low frequencies! This earthquake was also strong enough to be detected many hundreds of miles away. The following is the teleseismic signature of this M5.4 from station MCID at Yellowstone. 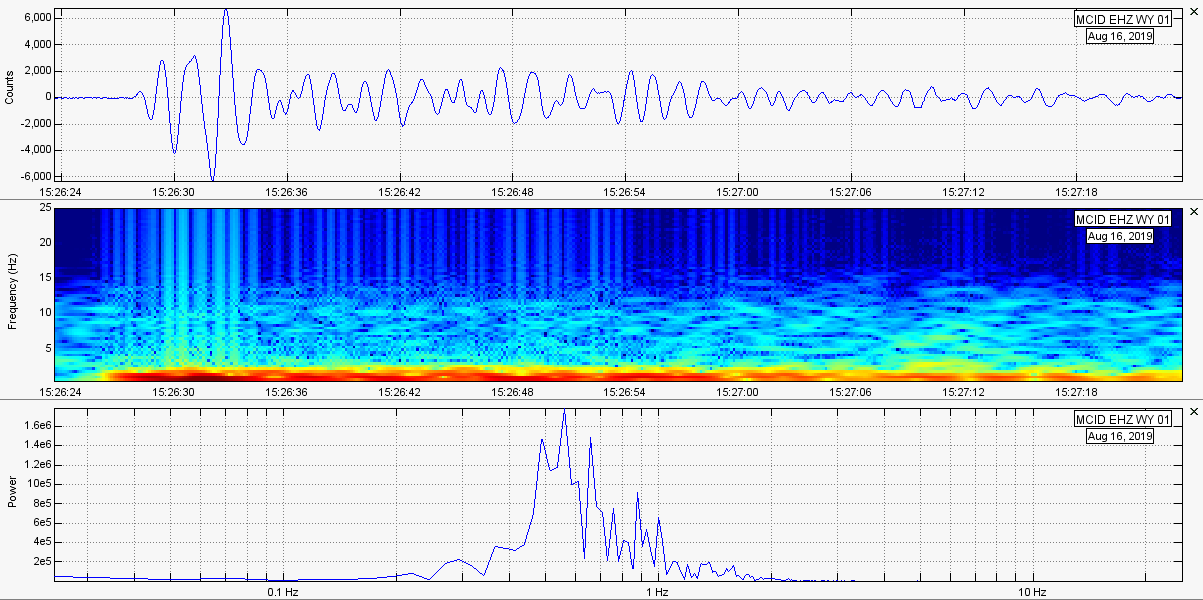
0 Comments
Leave a Reply. |
AuthorBen Ferraiuolo is a fast learner and someone who will always stand for the truth. Visit "About Me" for more! Archives
November 2019
Categories |
 RSS Feed