Steamboat's 27th Eruption, Federal Way Quake in WA State, Quakes in Soda Springs and New Jersey...11/15/2018 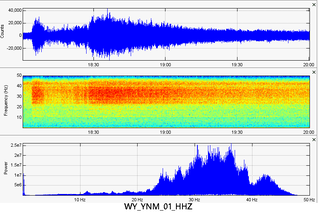 Hey there guys. I have some interesting stuff to show in this post. I will show the data for the most recent Steamboat Geyser eruption at Yellowstone, an earthquake that some people felt in Federal Way and near where I live, the recent earthquakes in Soda Springs, and a very strange earthquake that occurred near New Jersey. To continue this post, please click the title or "read more"! 27th Steamboat Geyser Eruption: At 18:04UTC November 15, 2018 (11:04am Mountain Time November 15, 2018) Steamboat Geyser, which resides in the Norris Geyser Basin at Yellowstone National Park and Caldera, erupted for the 27th time in 2018. As some of you may know, if the eruption total reaches 30 eruptions before this year is over then that means this will have been the most active year for Steamboat Geyser in recorded history. The current record is 29 eruptions in one year, 1964. 2018 may be the year of the Steamboat eruptions! Steamboat is also erupting with frightening regularity, much like it did when the 2018 eruptions first started in March/April. However now it seems to be on an almost exact weekly schedule. How is it possible something natural can be this regular? Well Old Faithful in the Upper Geyser Basin is another geyser that erupts with frightening regularity. But if this pattern continues with Steamboat throughout the next year, erupting once per week, then 2019 will most likely be pretty crazy! Below are the helicorder images for station YNM and YNR. Those are the only two stations that ever detect these large hydrothermal eruptions. But why is that? Even borehole 950 (B950) should feel these eruptions, right? Well please CLICK HERE to see my reasoning on why it is most likely that these seismic stations, YNM and YNR, are only detecting surface vibrations (not the free flow of super-heated water leading to the eruption). As you can see below, YNR barely felt this event at all but YNM still felt this eruption as it usually does. This eruption was somewhat weak in comparison to recent eruptions but is still quite strong for any hydrothermal eruption! Also notice it lasted pretty long! Almost 2 hours!!! 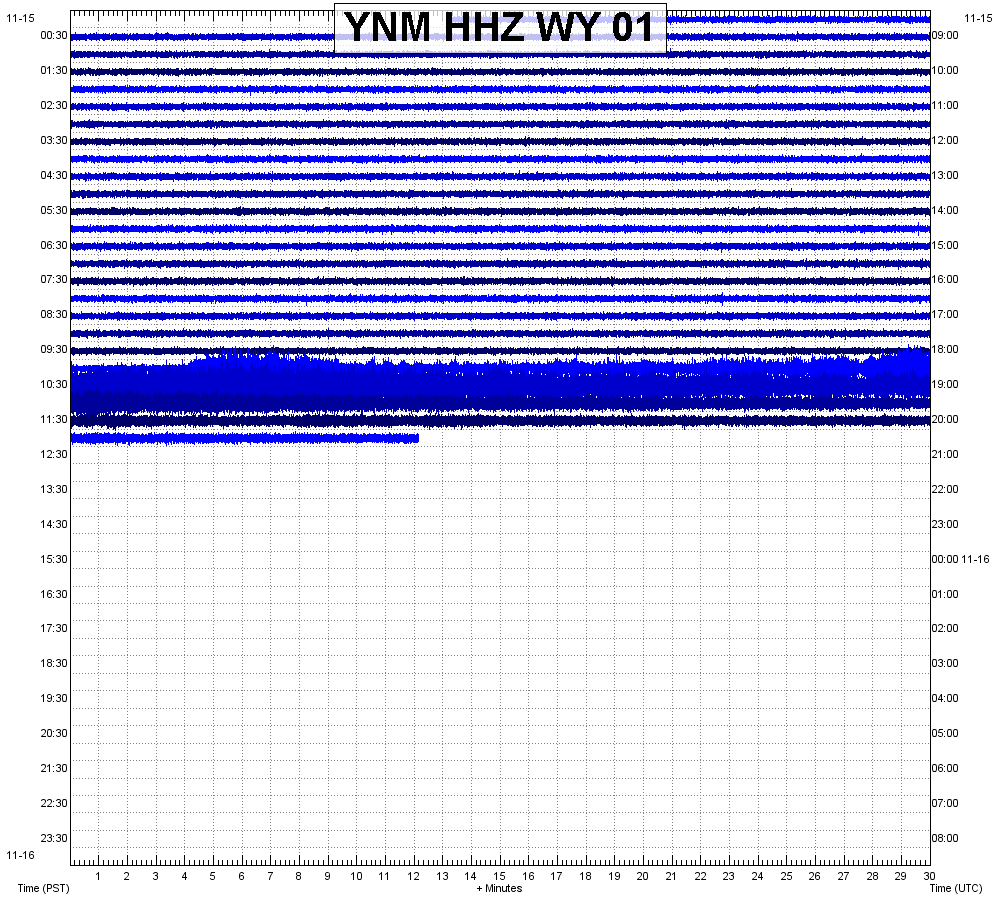 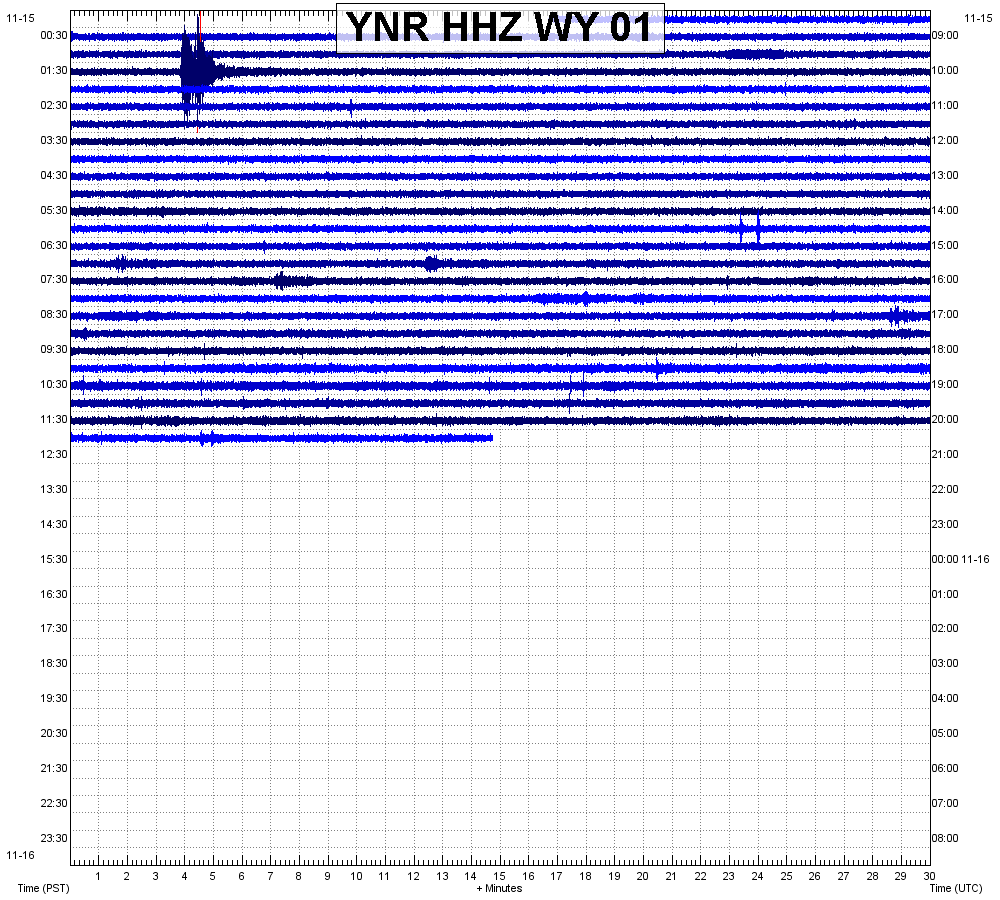 Again, as you will see below, this eruption was a little bit weaker than previous Steamboat eruptions but it seems like it lasted much longer. In the following seismogram/spectrogram/spectral plots please keep in mind you should always read chart labels FIRST before you read the data. Also please pay attention to any image captions. 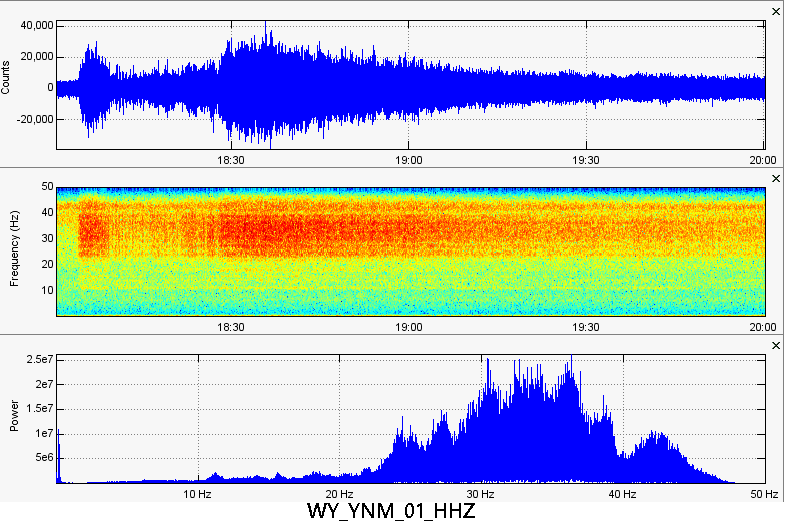 Here is the trace of Steamboat's 27th hydrothermal eruption of 2018 from seismic station YNM. Note that the amplitude count does confirm this eruption was smaller than recent Steamboat eruptions but we see it lasted for more than 2 hours! That is very long! Also notice that it appears it started with a quick burst, died down, and continued the main eruption. Note the dominant high frequencies that drop dramatically across short distances showing this is most likely surface vibrations from the eruption ONLY. 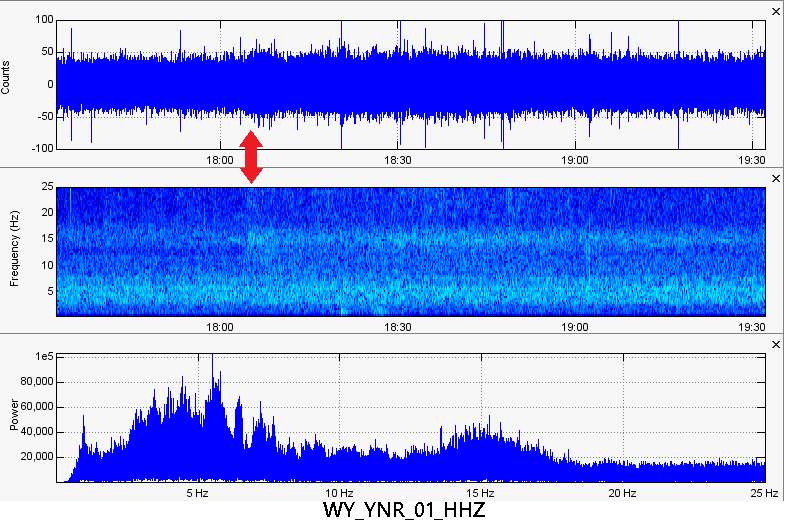 Now usually we don't have a hard time at all seeing the Steamboat eruption's seismic trace on YNR. However today it seemed, once again, much weaker but it lasted much longer. I used red arrows to show you the beginning point of the Steamboat eruption. Remember it started at 18:04UTC (times on these plots are always in UTC). M2.1 near Federal Way, WA: At 15:58UTC November 14, 2018 (7:28am Pacific Time November 14, 2018) a magnitude 2.1 earthquake struck near Federal Way in Washington State at 21.5km in depth. Normally I don't report too much on these small quakes but this one was felt by many people. Even up where I live! 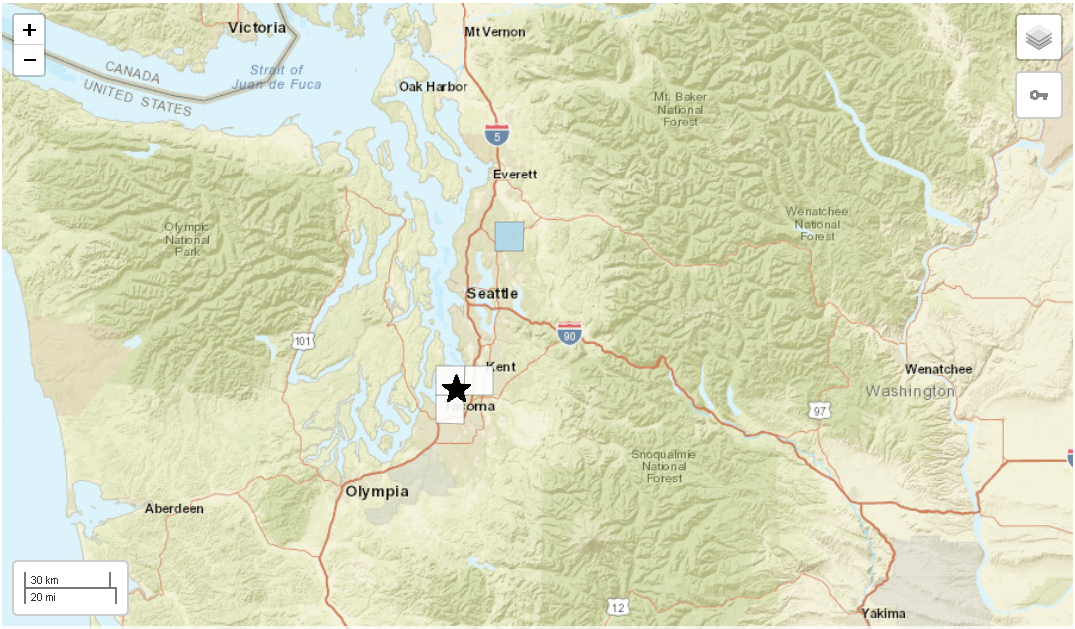 As you can see in the image above, this earthquake (represented by a black star) was felt around the epicenter but was also felt up north by a few people. Notice the blue box up north? That is very close to where I live. So I probably would have felt this earthquake! Well, at least if I was awake! :D Below is the helicorder for the 2nd closest station to this event, VVHS, along with the seismogram/spectrogram/spectral plots. For the helicorder image, please note the location of the earthquake is on the right side of the chart in between the 15:30 and 16:30 time marks on the right hand side. It is somewhat hard to see. 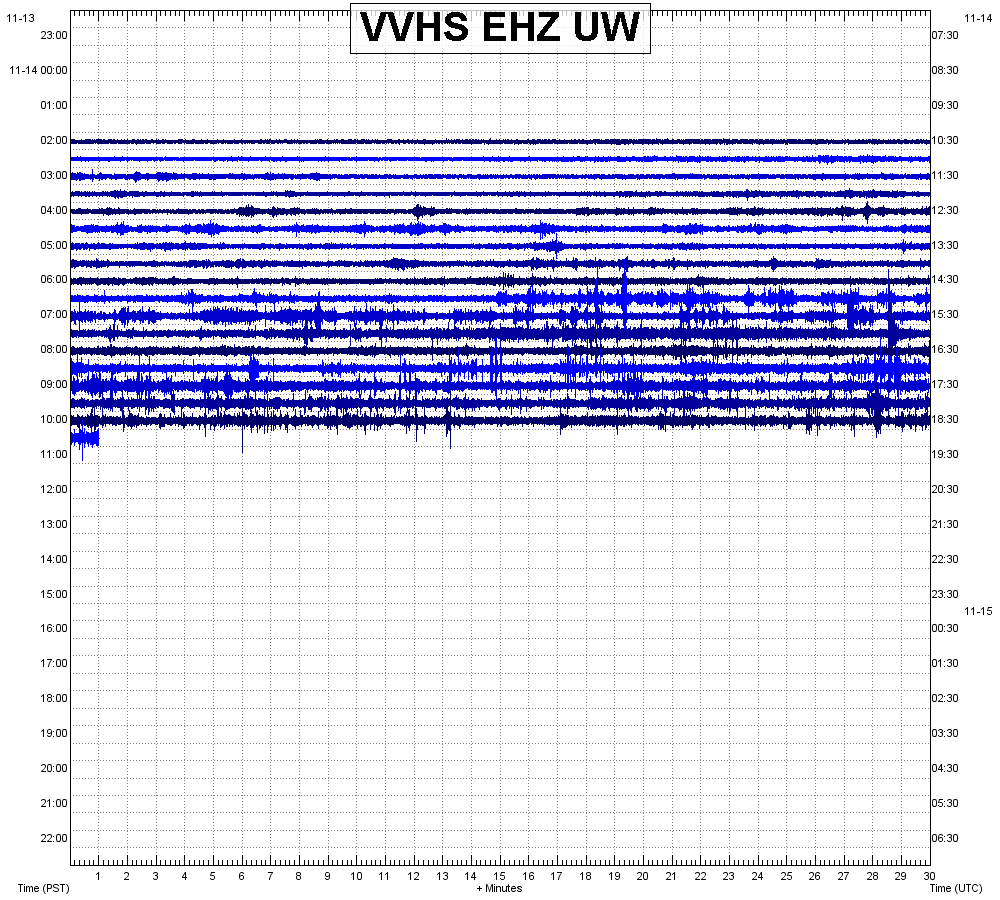 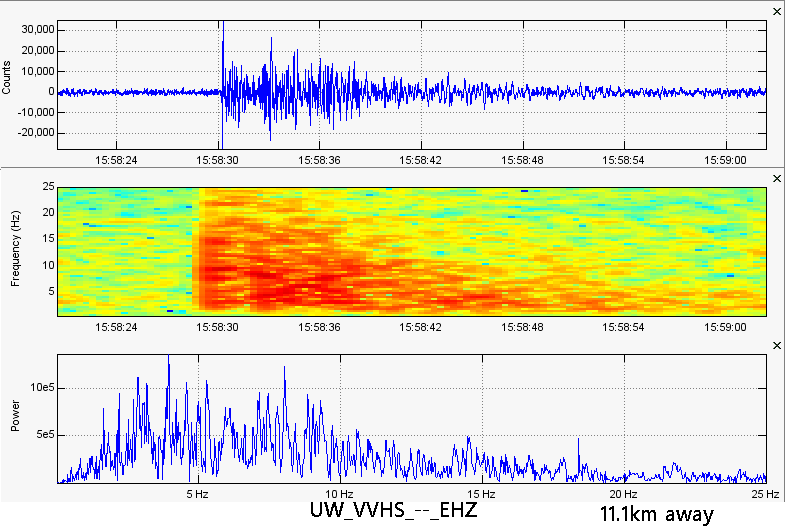 Swarming continues in Soda Springs, ID: 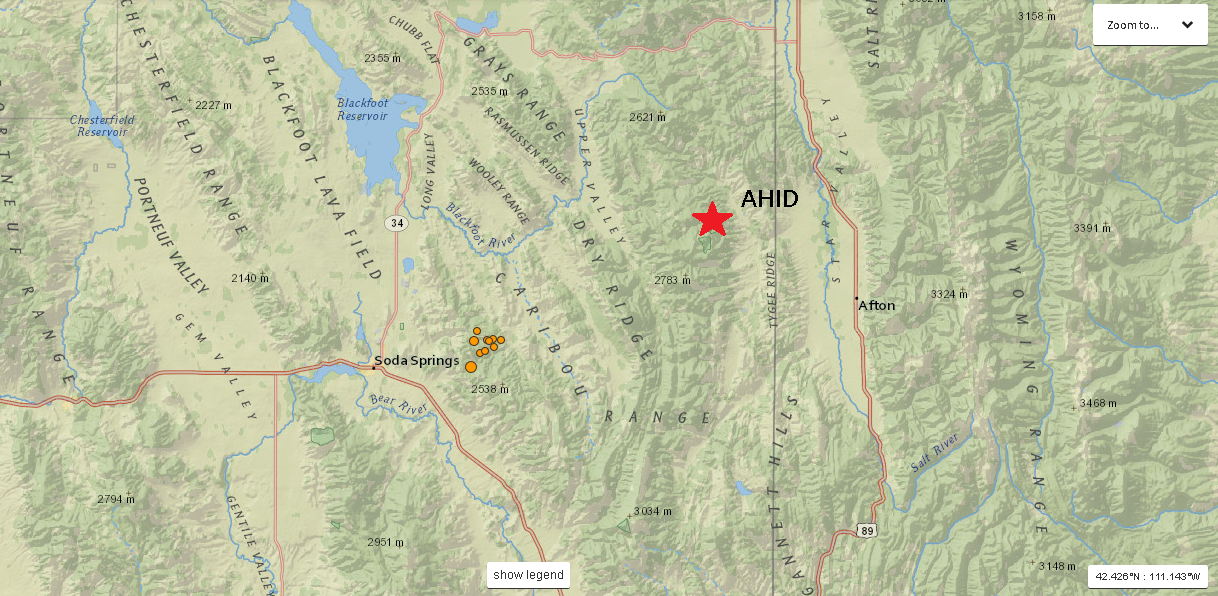 It seems earthquake activity near Soda Springs, Idaho has picked back up. On September 2, 2017 there was an extremely large earthquake swarm near this same area. It had many people wanting to move for good who had lived in the area for so long. USGS stated it was a purely tectonic swarm but I highly doubt that. Sometimes I would agree with them on some things, if the data proves it of course, but this swarm in September of 2017 was far too large and the magnitudes stayed around the 3.0-4.3 range for months after the swarm started! To me, that was odd for a "tectonic-only" swarm. But that is not the only thing (or the most important thing)! Remember how during the recent Kilauea and Lower East Rift zone (LERZ) eruptions the magma shifted quite quickly away from the Kilauea summit and off towards the east/northeast? Well when this occurred, the nearby tilt meters and GPS stations confirmed the ground was subsiding (dropping; deflating) and moving toward the LERZ, towards the east/northeast. During the September 2017 Soda Springs sequence, the GPS deformation instruments at Yellowstone detected that the ground dropped (of course not by a huge amount but large enough to suggest something was leaving the magma chamber or reservoir) and that the ground was starting to head toward the south/southwest! To me, that means some amount of magma left the Yellowstone chamber/reservoir system and somehow ended up over 100 miles to the southwest at Soda Springs, ID. Of course that is just a theory right now and I have very little to prove it but that is my opinion on the Soda Springs 2017 swarm. Just about a week or so ago the swarm is starting to reactivate. It is currently unknown what this means or how long it will last but the largest earthquake so far, since the reactivation, was a magnitude 3.8 at 11km in depth at 9:33UTC November 15, 2018. As you can see in the image directly above this text, the 3.8 occurred just south of all other earthquakes shown in the image. The red star represents the location for seismic station AHID, which resides closest to this swarm (at least out of all the stations I could find in the IRIS list). It is quite close to the epicenter of this swarm so it can still give us some really good data. The image below is the helicorder for AHID in the US network. You can see multiple earthquakes and many aftershocks after the 3.8 occurred. In my opinion I believe this earthquake was downgraded too much. I think it was more like a 4.0-4.1. The events near the end of the helicorder time period are emergent and appear to be surface noise with a few smaller earthquakes thrown in the mix. 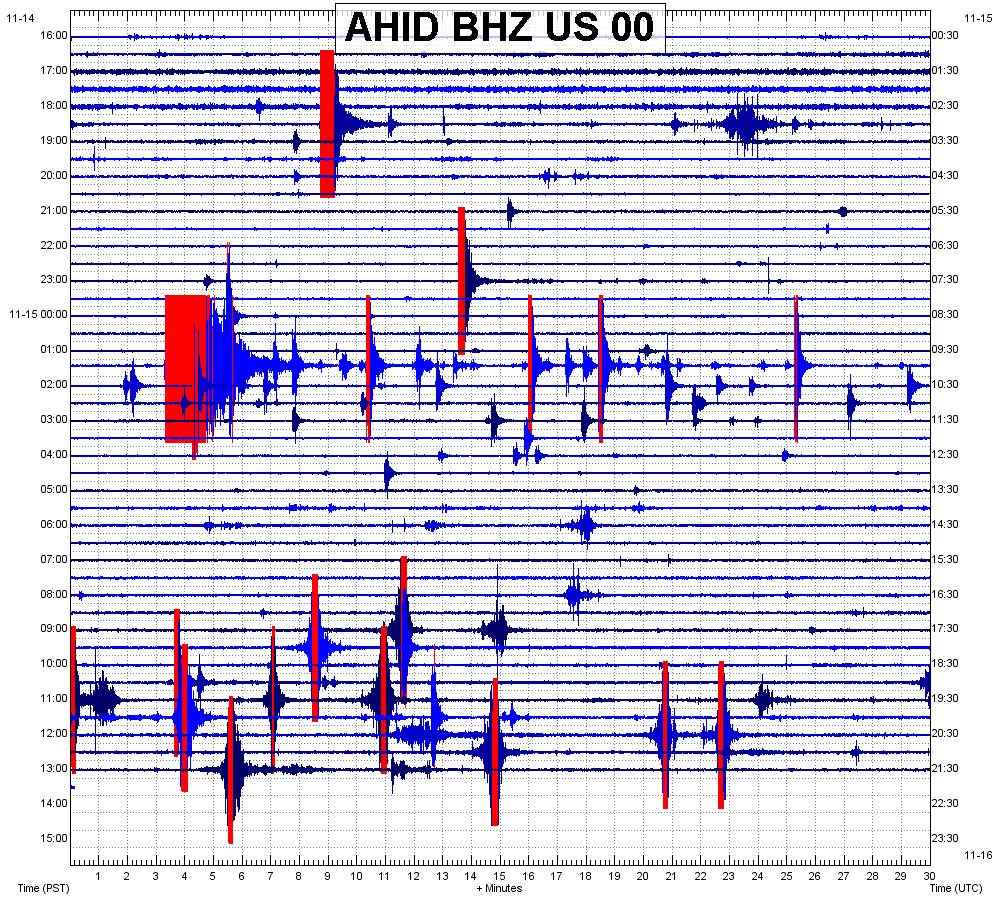 The following seismogram/spectrogram/spectral plots were generated by myself using the program SWARM and data retrieved from seismic station AHID (US_AHID_00_BHZ). Since this is a broadband station I added a 0.8Hz high pass filter (meaning all frequencies below 0.8Hz are not shown). As usual, please remember to read chart labels first and pay attention to any image captions. 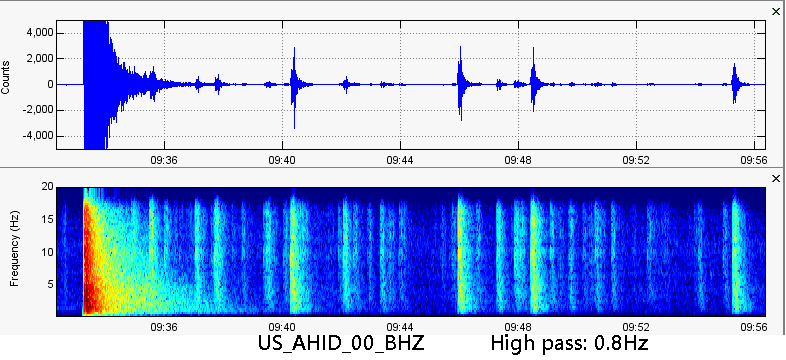 Here you can see the 3.8 earthquake with many aftershocks. There is currently nothing to indicate this swarm is caused by anything but stress accumulating from the September 2017 swarm. However that could change at any moment! Please note the amplitude count was manipulated to make the other smaller quakes appear. The initial 3.8 far exceeded 5,000 amplitude count. 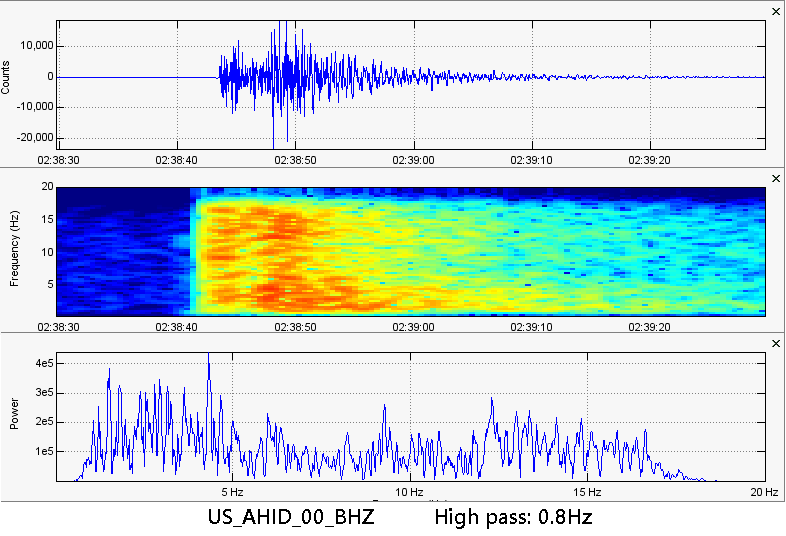 This earthquake was reported to be a magnitude 2.9 at 8.5km in depth. 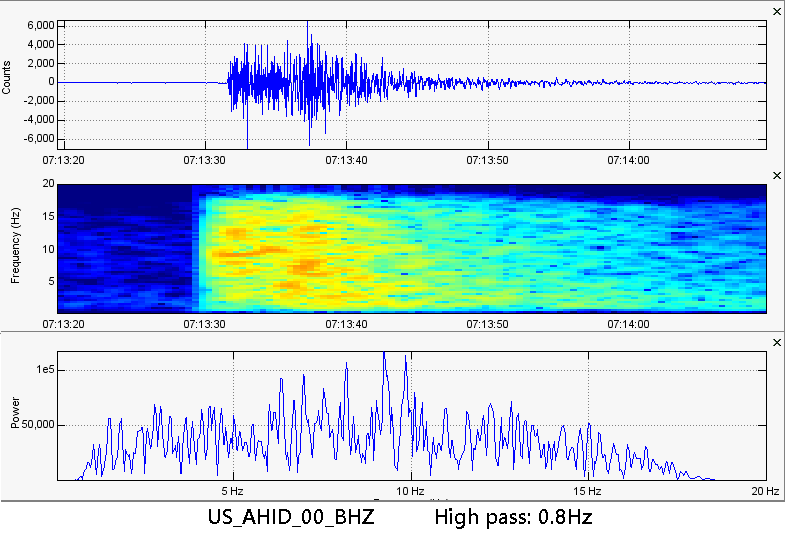 This earthquake was reported to be a magnitude 2.2 at 8.7km in depth. 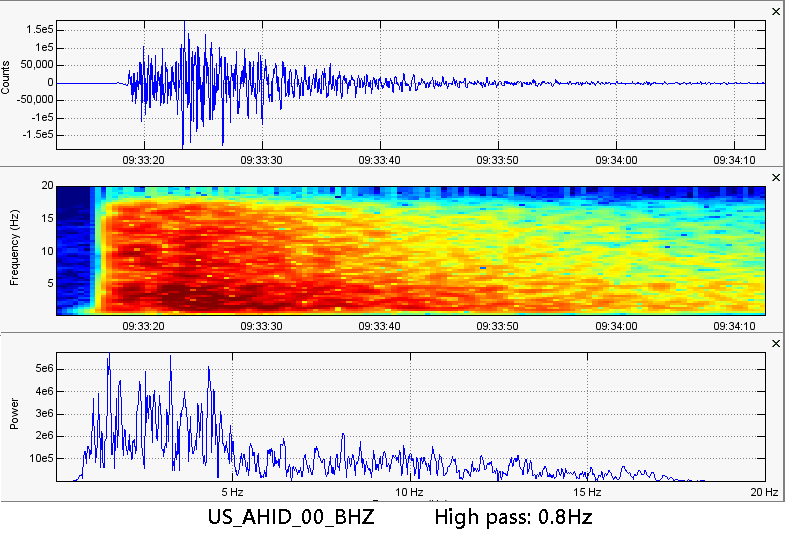 Now here is the large 3.8 earthquake. According to the amplitude count, I feel a magnitude of 3.8 is lower than what it should be. Maybe 4.1 or 4.2? But notice how this earthquake had dominant frequencies below 5Hz. Of course this is not a low frequency earthquake and it has power in many other higher frequencies but the dominant frequencies are a little lower than what I would expect. M1.4 Quake near New Jersey and New York: So I saw recently that an earthquake occurred on the east coast of the United States. Sometimes I report on them and sometimes I don't. However this past year it seems seismicity has slightly increased for the east coast for reasons currently unknown to me. But this earthquake is extremely weird. I am only reporting it because USGS reported it. If the reporting to USGS was bound to me, I probably would not have reported it since it looks absolutely nothing like an earthquake. But the data is conclusive that this event appeared on multiple surrounding stations meaning this was real and that it did occur underground. 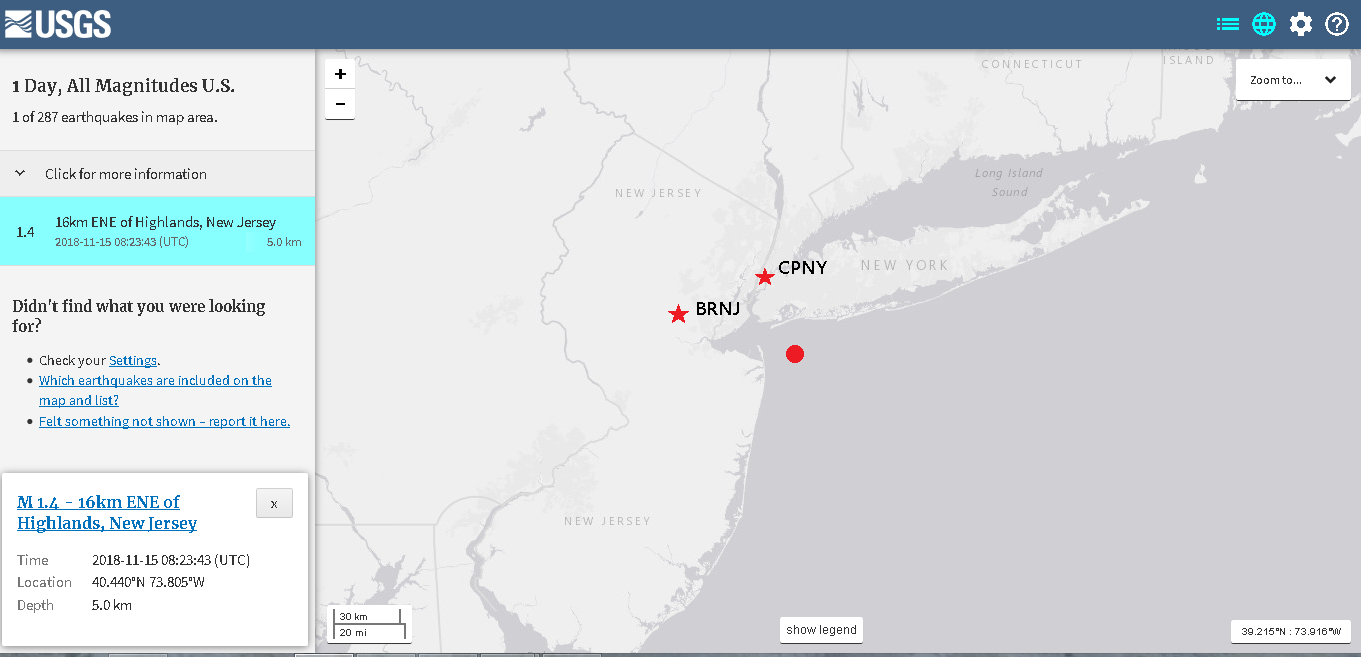 The red circle in the image above represents the magnitude 1.4 earthquake that struck at 5km in depth at 8:23UTC November 15, 2018. Notice the reported epicenter is beyond the coast, under the water, between Long Island and New Jersey. The data seems pretty conclusive that this was an earthquake. However, as you will see in a second, this earthquake was extremely peculiar. Below are two helicorder images: 1 for BRNJ and 1 for CPNY. You can see the location of these stations on the map above. I must tell you though that finding this earthquake on the helicorders is almost impossible. These were the closest seismic stations I could find for this earthquake. Man, the seismologists must've had a hard time locating this puppy dog even with in-depth seismological tools! 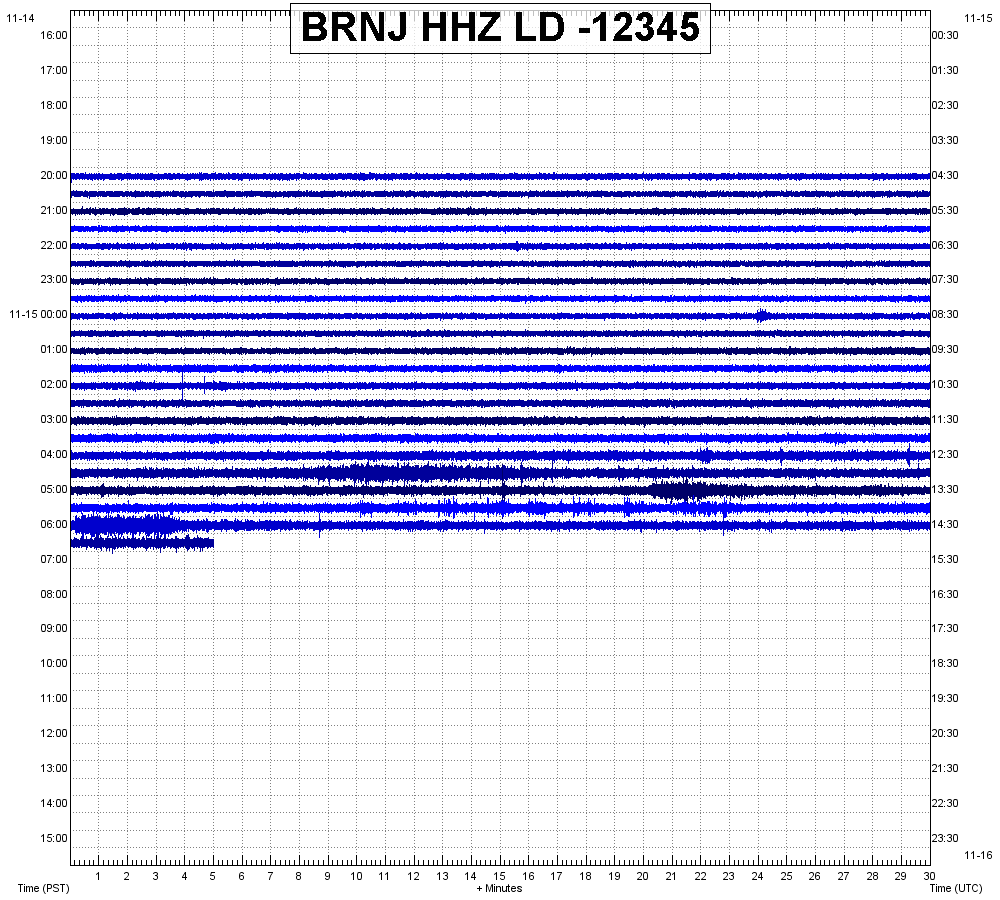 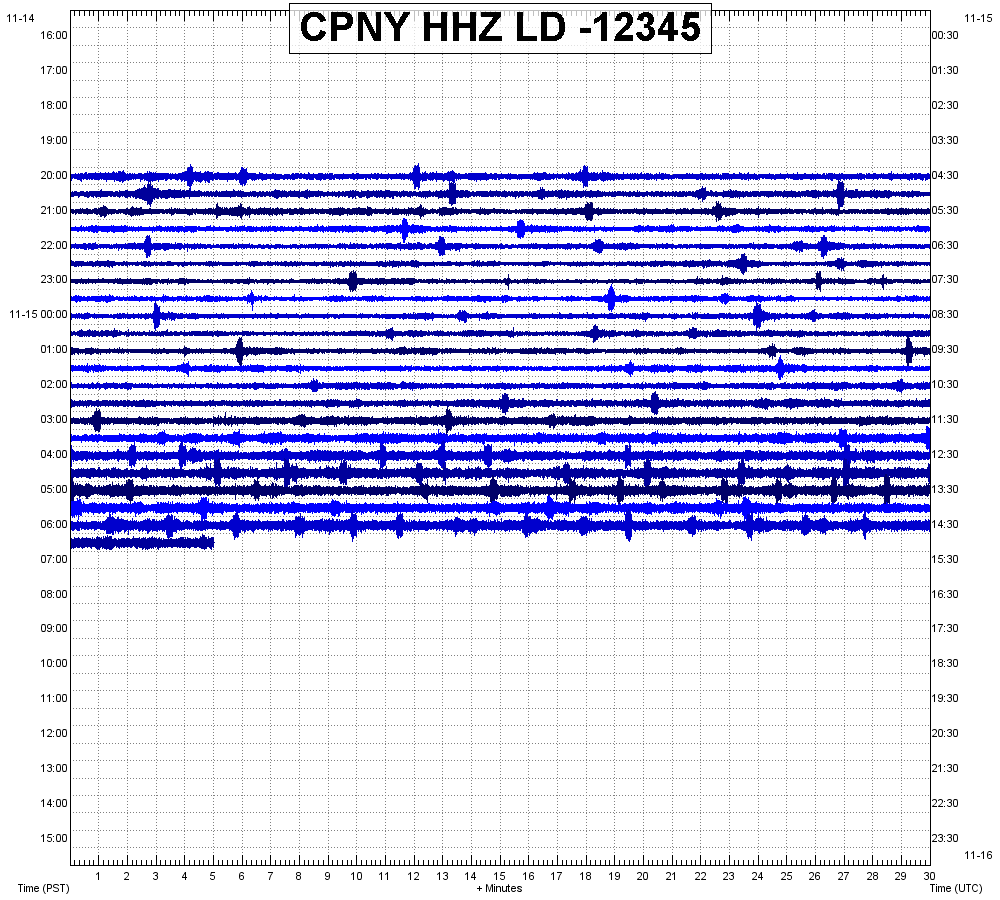 The following images are the seismogram/spectrogram/spectral plots for these two stations for this earthquake. Remember, as always, please read the chart labels first before you look at the data and pay attention to any captions beneath any images. 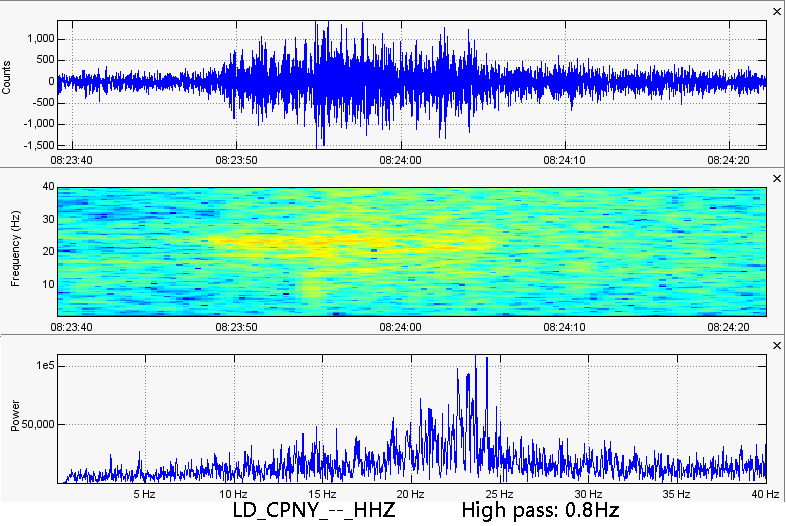 Here is the 1.4 earthquake on seismic station CPNY. Please notice how it looks extremely, extremely similar to surface noise. There aren't even really any low frequencies at all! Most earthquakes, even of the highest frequency, still have strong low frequencies. They may not be dominant, but they are still there. However this earthquake has no low frequencies whatsoever. I would have overlooked this as surface activity but the data proves it was a real earthquake. How could this be? This is for sure a very weird quake... 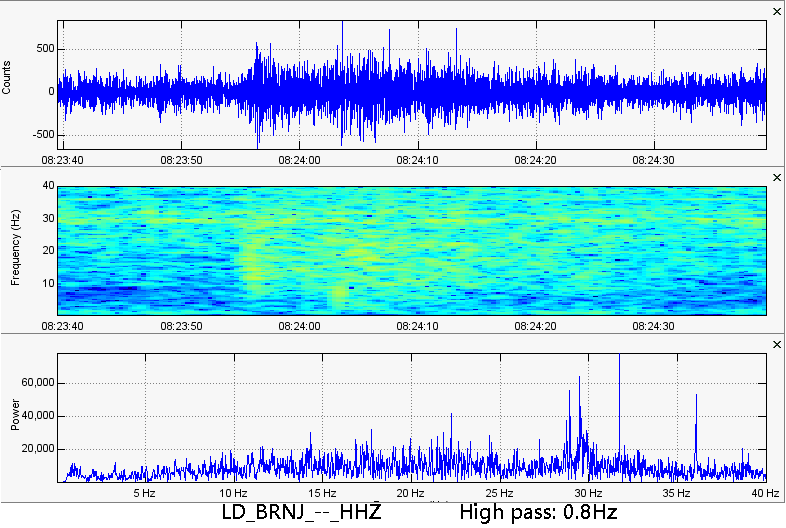 Even though this station, BRNJ, did not feel this earthquake as strong, it looks like the quake was easier to see. Once again please note the dominant high frequencies with very specific spikes shown on the spectral plot. Once again, this was a very weird quake! So that is it for now. We looked at some interesting stuff today and now I am off to discover why eastern/northeastern Wyoming is seeing some strange earthquake activity. The earthquakes have not been reported but have been spotted as being strongest between seismic station YPK at Yellowstone and seismic station RSSD on the border of Wyoming and South Dakota. Once I figure out what is going on I will create a video and a blog post but I have much more research to conduct. Thank you for reading and keep an eye out for another blog post or video soon! God bless!
2 Comments
Just a quick comment on the East coast quake. The Atlantic appears to be dominated more by tension forces than compression. I would think that movement due to tension (a rip) would have a quite different signature than a quake due to release of compression.
Ben
11/19/2018 04:30:54 pm
That very well could be! I have noticed some quakes on the east coast do not have any lower frequencies, unlike quakes in the rest of the US. It must have to do with the different type of forces at work. Thank you for stopping by and God bless! Leave a Reply. |
AuthorBen Ferraiuolo is a fast learner and someone who will always stand for the truth. Visit "About Me" for more! Archives
November 2019
Categories |
 RSS Feed