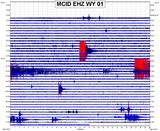
 Some pretty crazy seismic events have been transpiring in some strange locations ever since a good sized solar wind stream struck our planet. Don't know if those two processes are connected, but the timing of seismicity with other past solar wind streams seem to indicate there might be some type of connection. I will not get into that in this post. I will instead detail the info and seismic data pertaining to a M3.0 that recently struck at 44.0km in depth near Salem, Oregon, a M3.8 that struck near Manhattan, Montana, a M7.5 earthquake that struck at 132.4km in depth in Ecuador, and then I will detail one of the more interesting swarms I have ever seen. As always, please click the title of this post or "read more" to continue if you have not done so already... M3.8 in Manhattan, Montana:  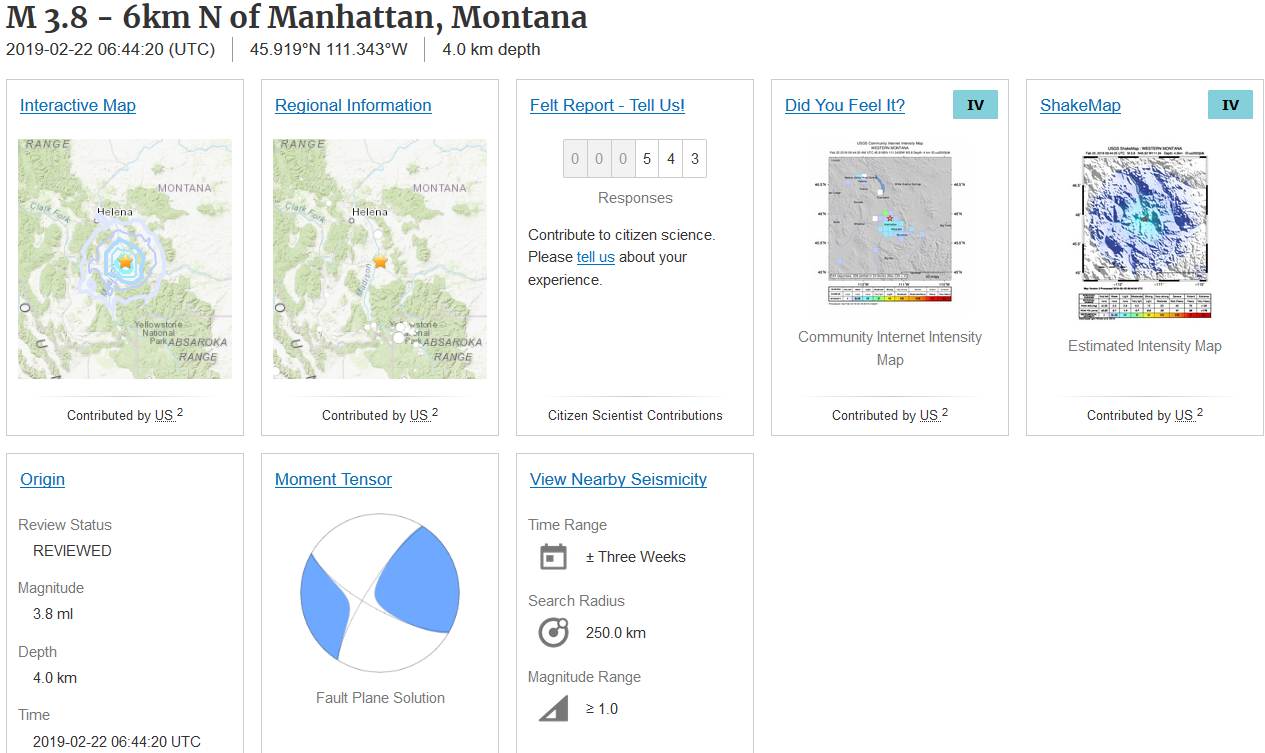 At 6:44UTC on February 22, 2019 (11:44pm MST February 21, 2019) a strong magnitude 3.8 earthquake struck at 4.0km in depth just north of Manhattan, Montana. There were many aftershocks and 543 people reported feeling this event! Since not many people report earthquakes to USGS, I am betting the actual number of people who felt it is around 1,500 or so. The first image above is the location of the M3.8 in relation to the closest seismic station: BOZ in the US network. The second image is the USGS event page for this earthquake. Within 24 hours or so of this event, many strange and strong seismic events took place in the United States and around the world. I will get into that in just a second. Below I will show some seismic images and plots pertaining to this M3.8. Remember to always read chart labels first and pay attention to any captions beneath any images. All plots you see were generated by myself using the seismic program SWARM and the simple program Paint. 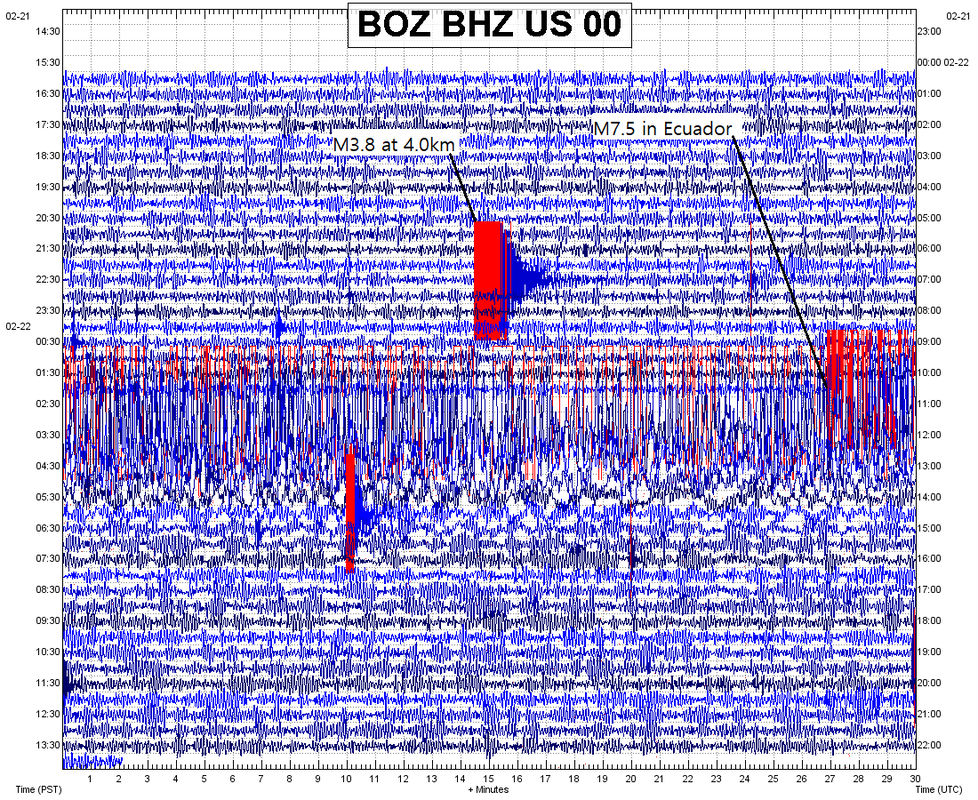 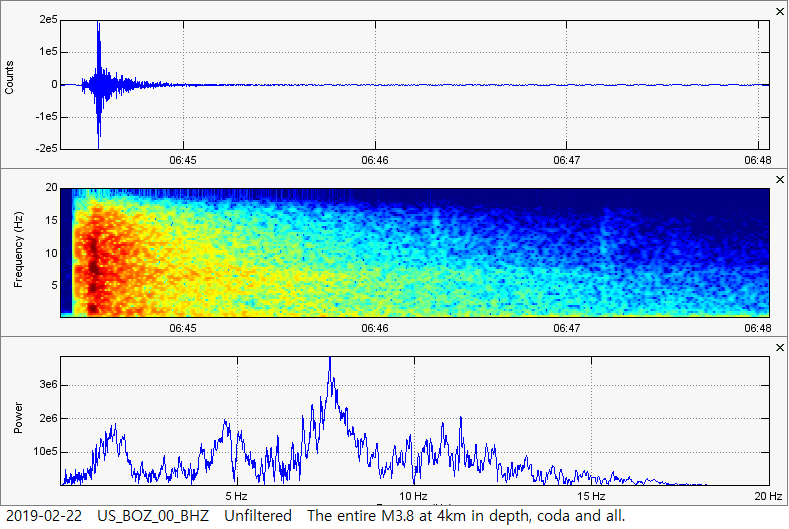 The entire M3.8 at 4.0km in depth, coda and all. This was a normal tectonic event with mid-high range frequencies. There were also many aftershocks associated with this earthquake. 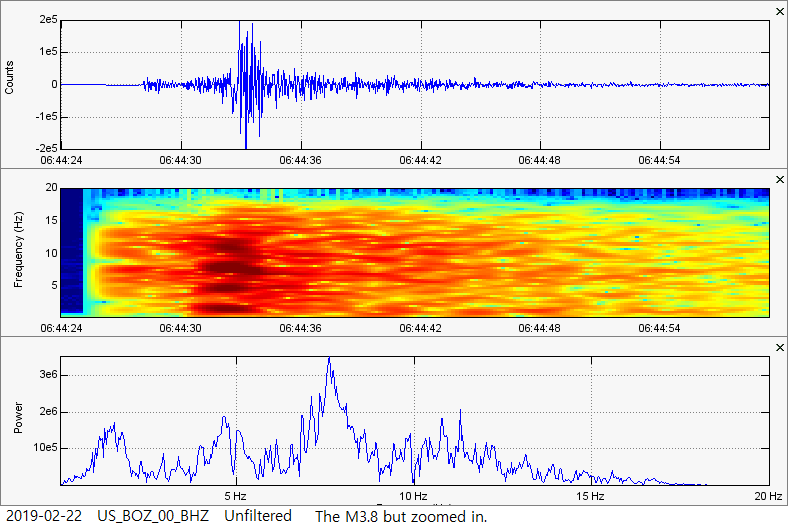 This is the M3.8 I just showed. However I have zoomed in on the plots to give you a better look at the waveforms. M3.0 at 44.0km Depth in Oregon: 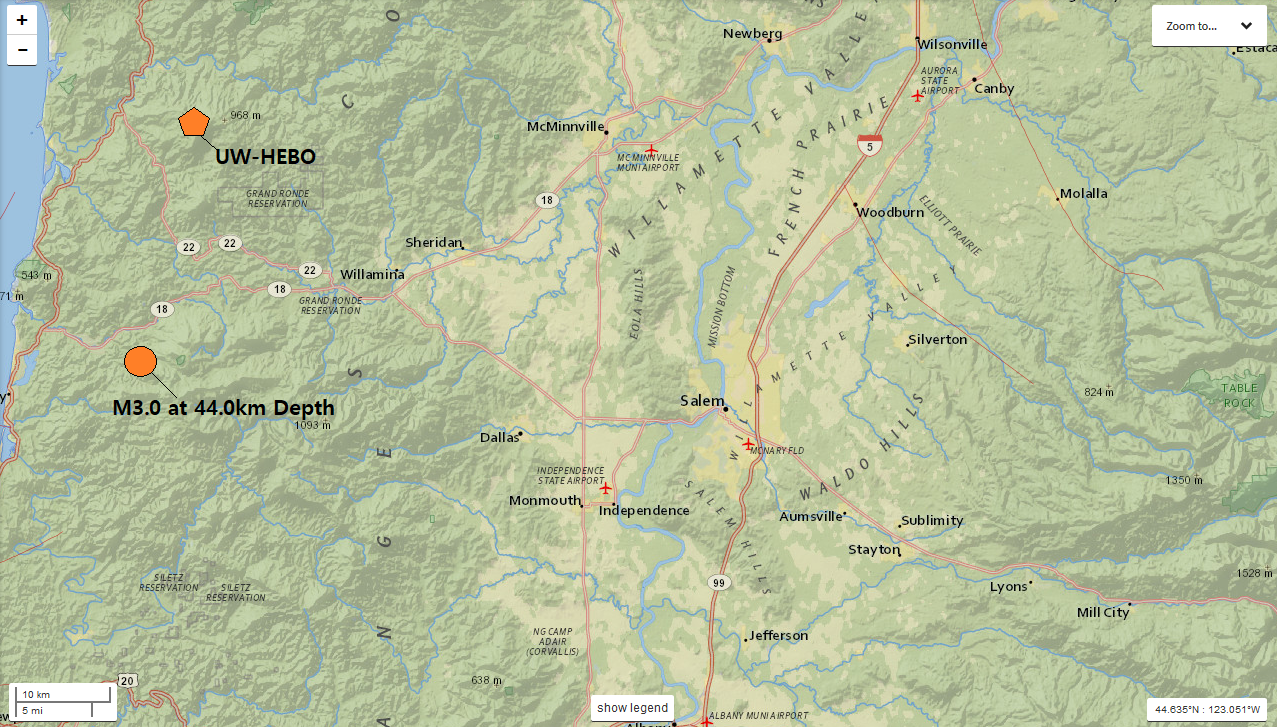 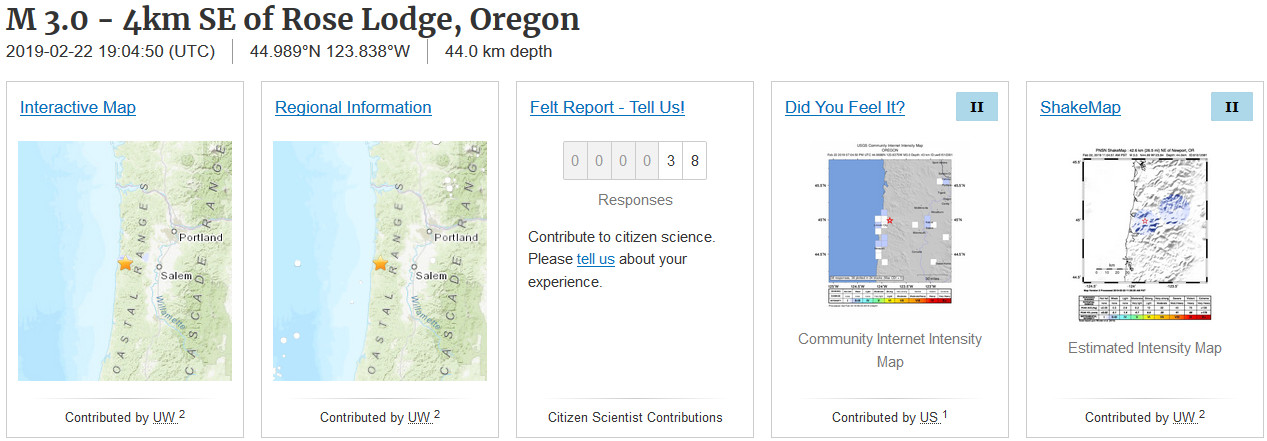 At 19:04UTC February 22, 2019 (11:04am PST, same date) a very intriguing earthquake struck on the Oregon coast, just west of Salem. It was a magnitude 3.0 earthquake surprisingly striking around 44.0km in depth. It is likely this event is related to the Cascadia Subduction Zone and any processes that area taking place due to the subducting plate. This event was small, yes, but was reportedly felt by 38 people over a broad region. The first image above is the location of the M3.0 in relation to the 2nd closest seismic station: HEBO in the UW network. The second image above is the USGS event page they generated for this earthquake. So far, they have not put out a focal mechanism solution but they may in the future. Below I will show the helicorder chart to station HEBO and two 3-plot images of this earthquake. Again, remember to read all chart labels first and any captions beneath any images. 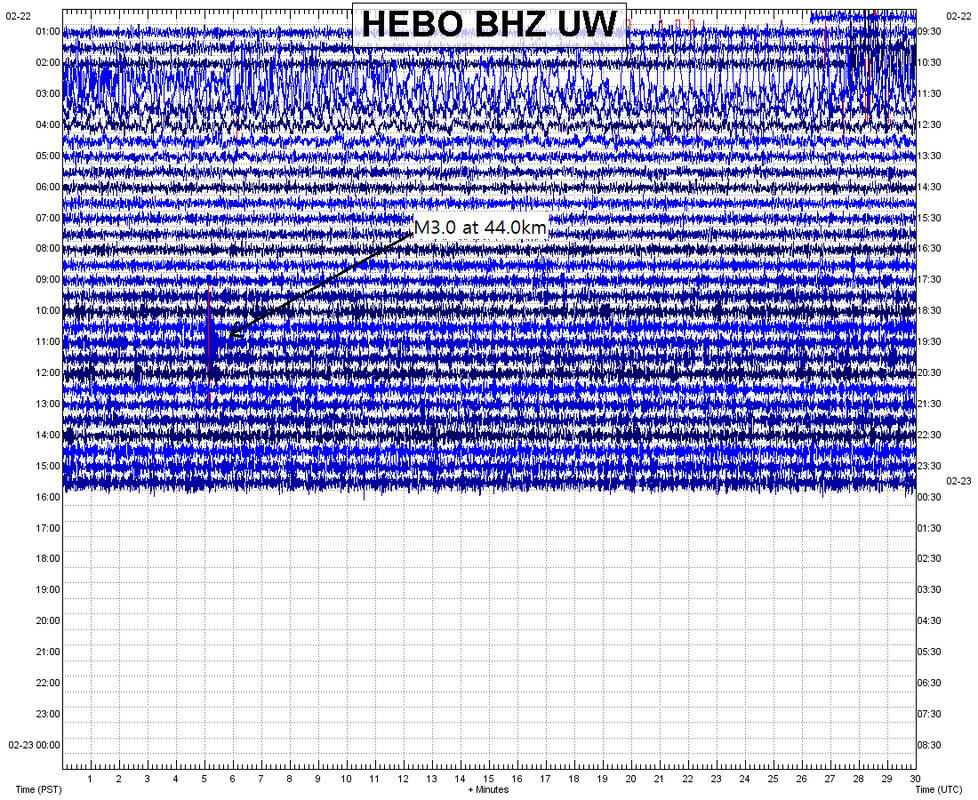 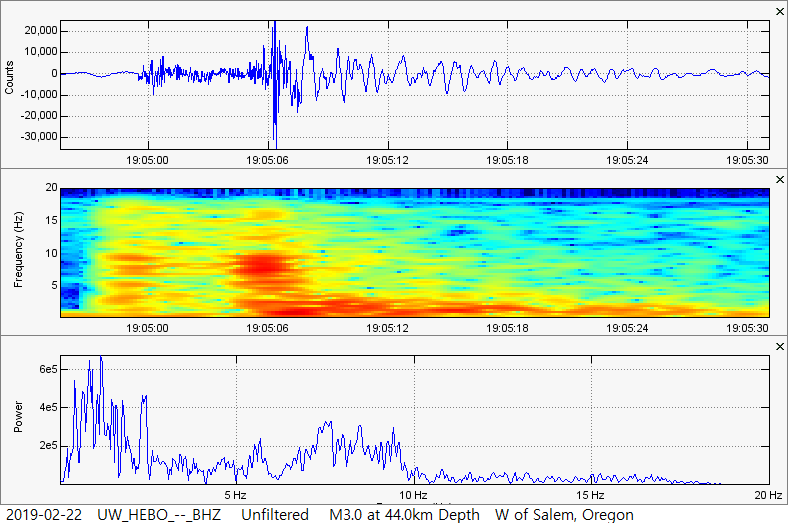 This is the M3.0 at 44.0km in depth. This 3-plot image is unfiltered. Check out the dominant low frequencies! I doubt this can be considered a true low frequency earthquake, but you can clearly see some very strong low frequencies and a slightly longer coda (tail) than what you would expect. Even check out the waveforms! Quite an intriguing event this was! 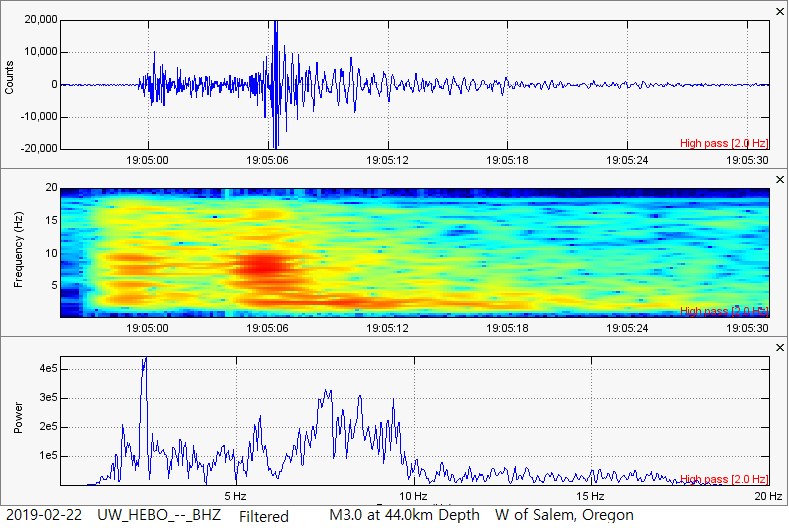 This is the same event as shown above, however a 2Hz high pass filter was added to all of the plots within the image. You can still see some pretty strong low frequencies! So, what exact process caused this earthquake? Hopefully someday I will find out! Exciting Rapid Fire Swarm in SW Wyoming:   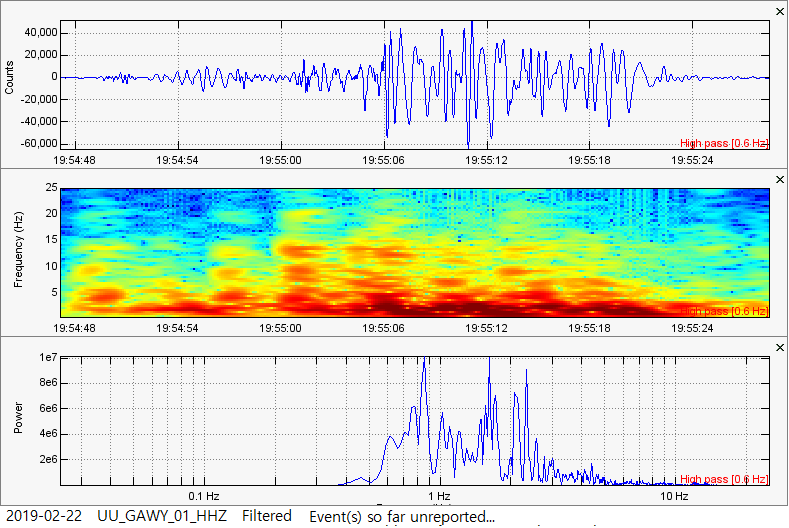 Something absolutely crazy just took place in SW Wyoming, just north of Green River near a bunch of mines. First off, if you wish to see any info or plots of this swarm, then please CLICK HERE to visit the page dedicated to this swarm. Now only 6 events were reported and most of them have completely incorrect depths, showing some occurred 4,000 feet above the ground which is impossible. Many of these events in this swarm also were detected hundreds upon hundreds of miles away so we know they were underground, possibly around 2km-4km in depth. This was a low frequency earthquake swarm indicative of some type of underground magmatic event. I am unsure exactly what process caused this swarm, but this for sure was not any type of mine activity, tectonic activity, or hydrothermal activity. Please click above to visit the earthquake swarm page. In regards to it's characteristics, this is one of the craziest and coolest swarms I have ever seen! Somewhat deep M7.5 strikes Ecuador: 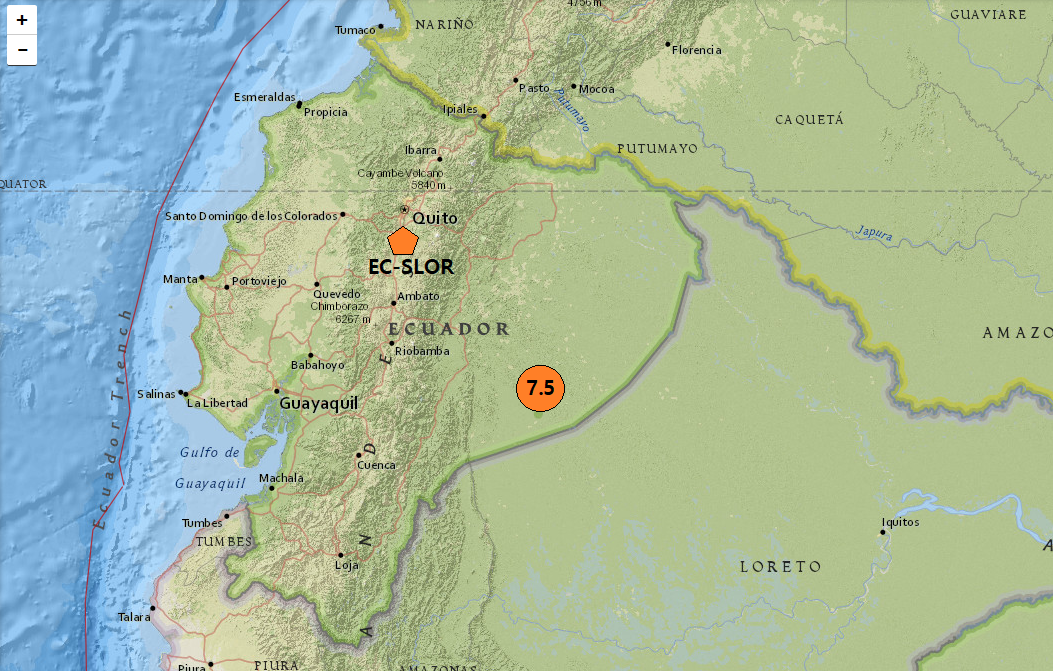 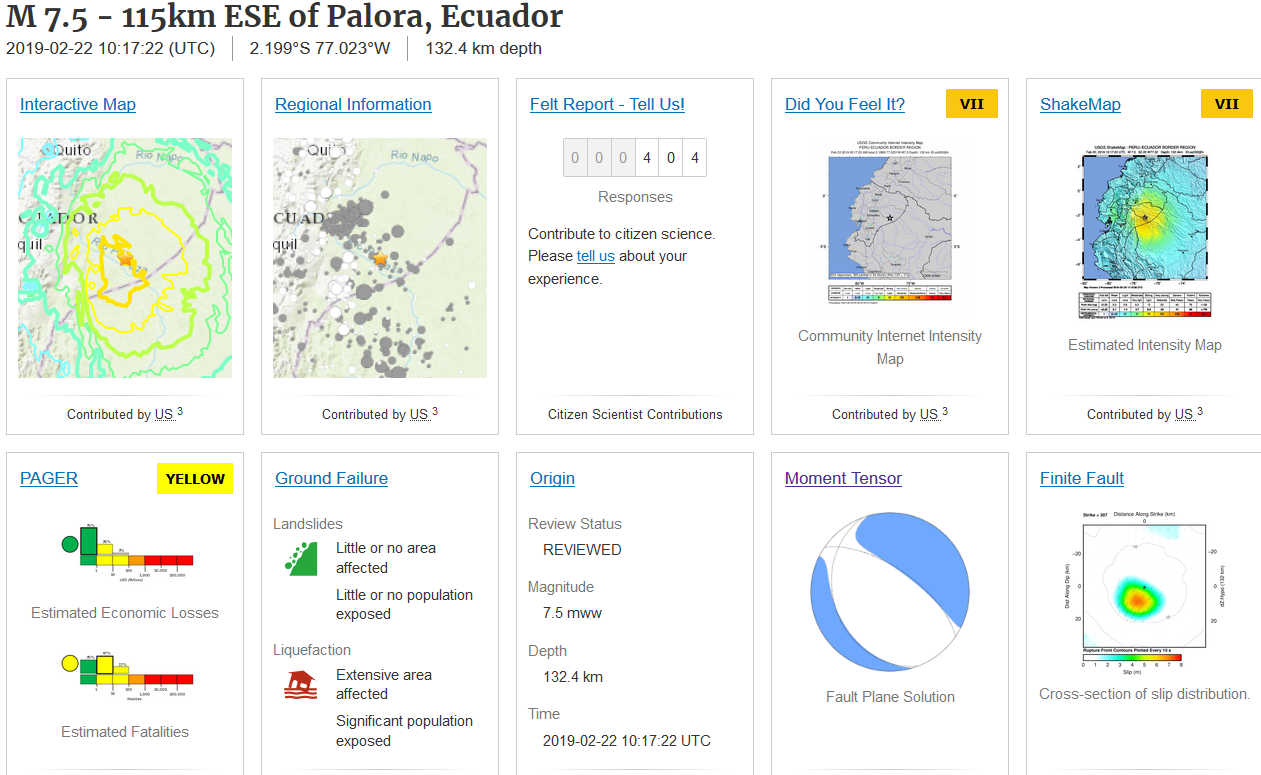 At 10:17UTC on February 22, 2019 (3:17am MST, same date) a very strong M7.5 earthquake struck at 132.4km in depth under eastern Ecuador. The first image above is the location of the M7.5 in relation to the 2nd closest seismic station: SLOR in the EC network. The second image above is the USGS event page generated by them for this M7.5. Note it includes a moment tensor and a cross-section of slip distribution. 404 people reported feeling this event, but it is likely this number is actually in the thousands. Also, slight fatalities are expected including extensive liquefaction. Here is an explanation of this event via USGS: 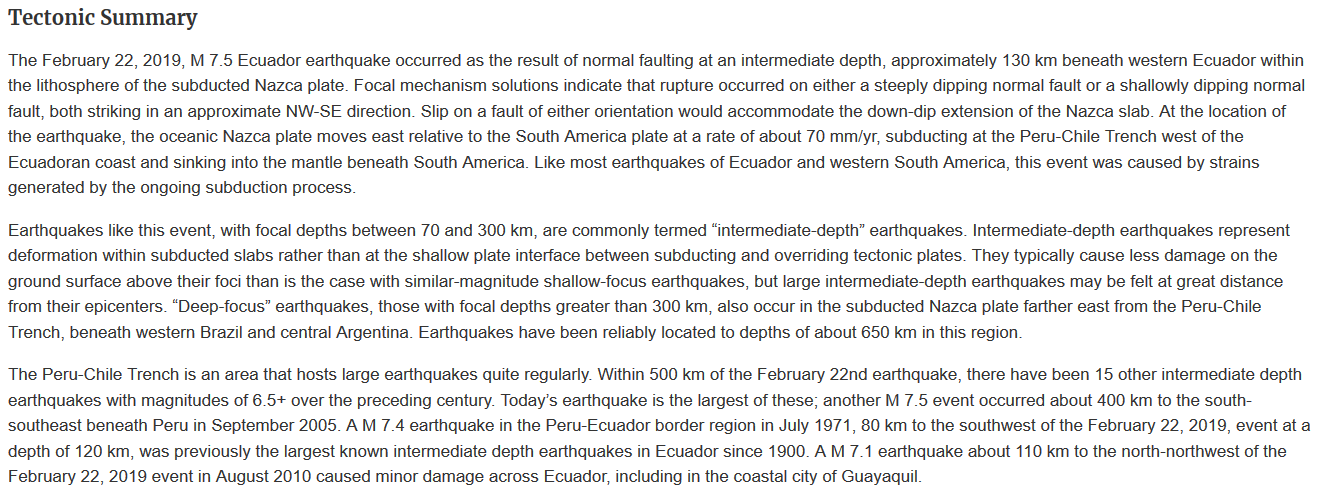 Below I will show some helicorders. One from the 2nd closest station to this event in Ecuador, one from MCID at Yellowstone, and another from VNSS at the Veniaminof Volcano in Alaska. Then I will show some seismic 3-plot images which were generated by myself using the program SWARM and the simple program Paint. Remember to read all chart labels first and any captions beneath any images. 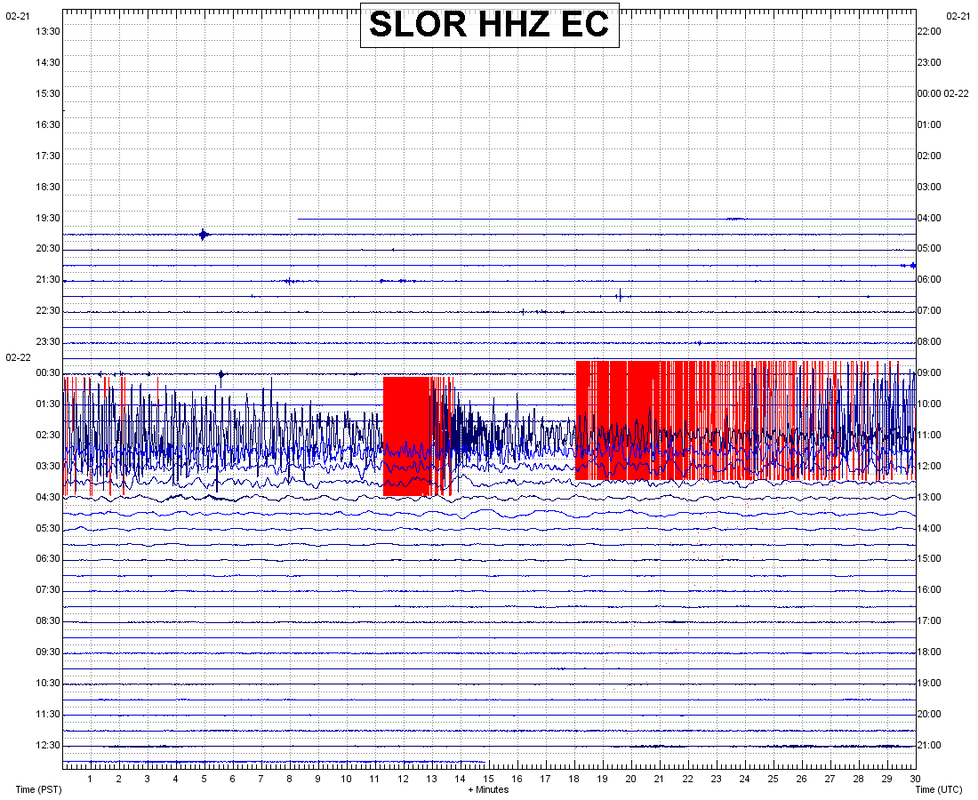 This station resides in Ecuador, somewhat near the epicenter of this M7.5 at 132.4km in depth. 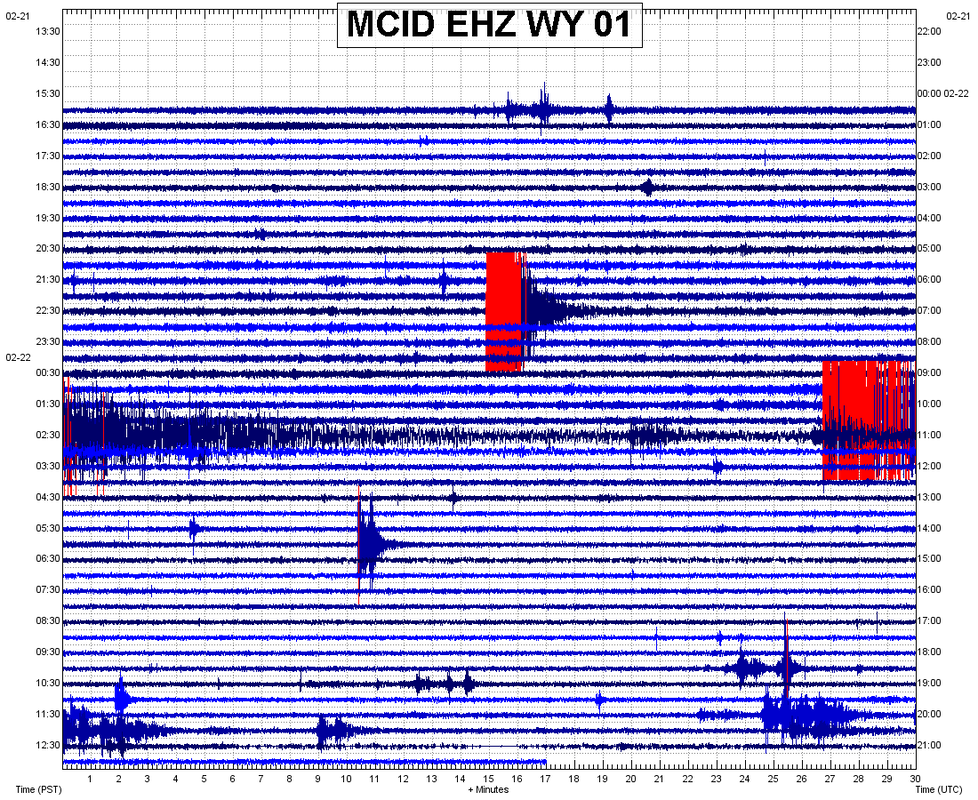 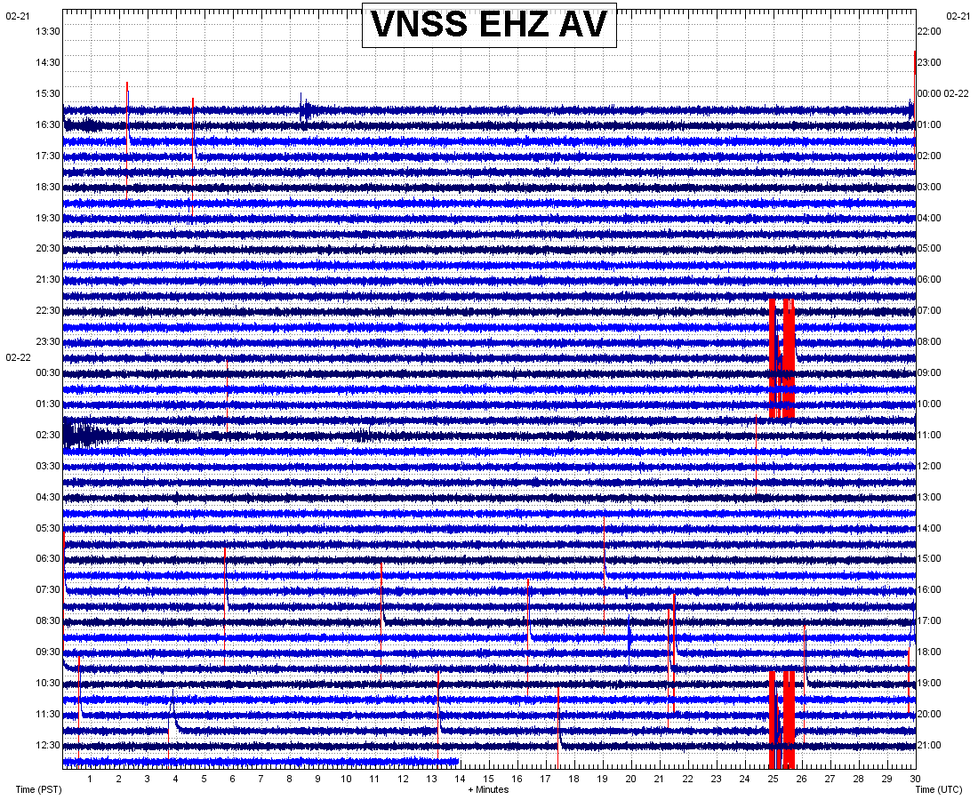 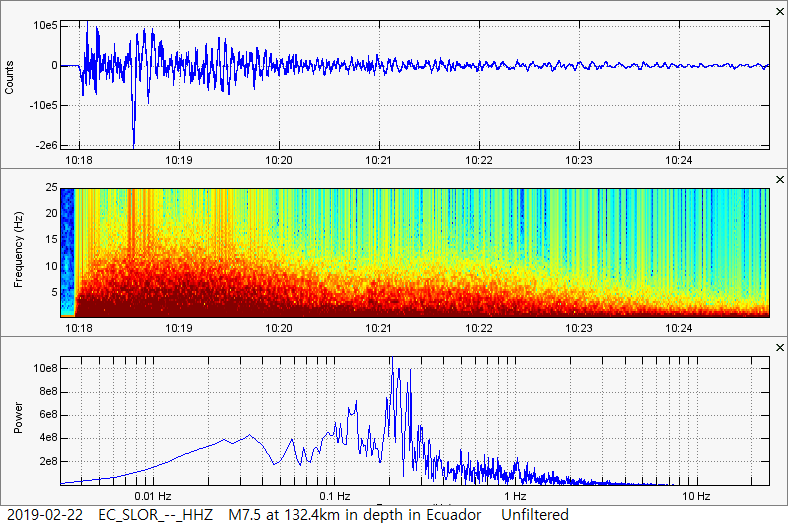 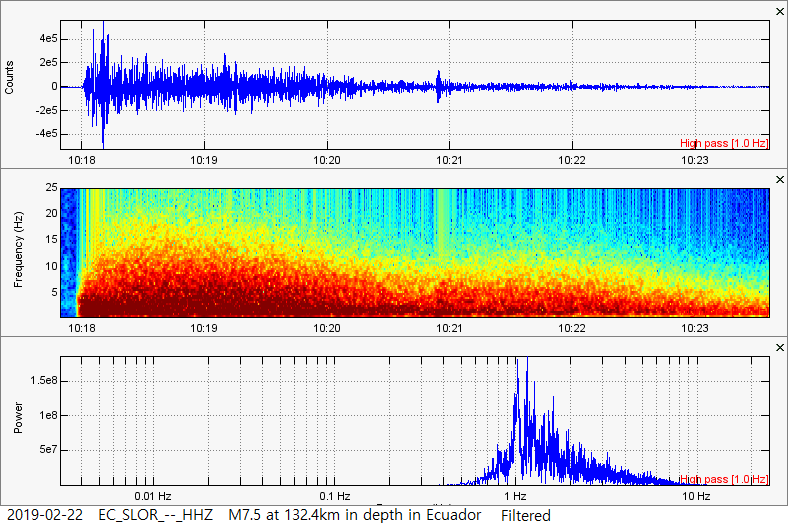 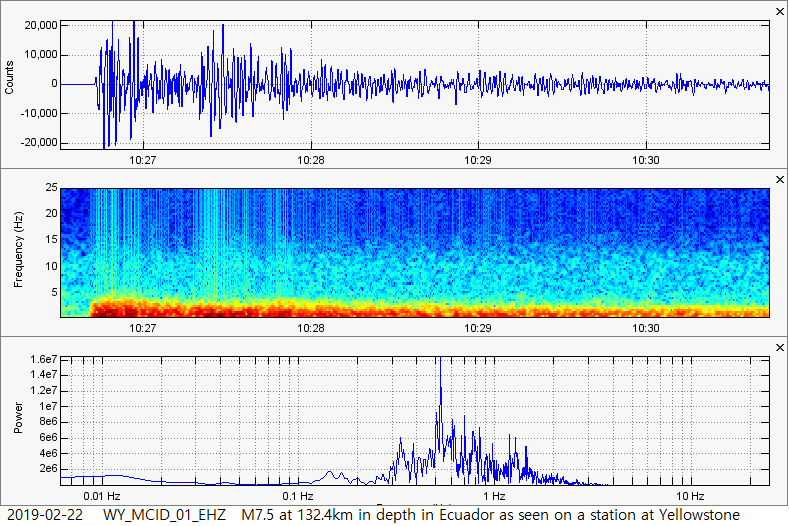 This is the teleseism of the M7.5 in Ecuador as seen on seismic station MCID which resides in the southwestern section of Yellowstone National Park. Check out the amplitude count! This earthquake was pretty strong! 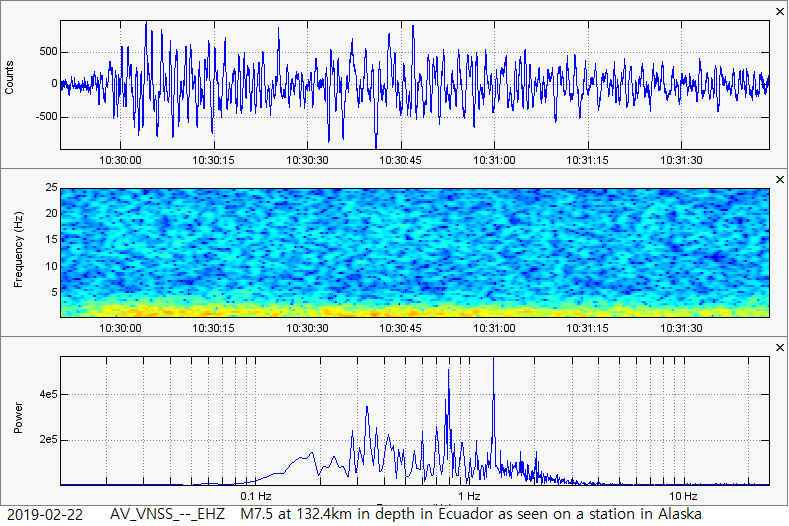 This is the teleseism of the M7.5 in Ecuador as seen on seismic station VNSS at the Veniaminof Volcano in Alaska. I am pretty sure every active station in the world felt this event.
0 Comments
Leave a Reply. |
AuthorBen Ferraiuolo is a fast learner and someone who will always stand for the truth. Visit "About Me" for more! Archives
November 2019
Categories |
 RSS Feed