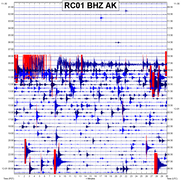
 November 30, 2018 was an interesting day for earthquakes in North America. Anchorage, Alaska got hit by it's biggest earthquake in years and almost 1,000 aftershocks of all magnitudes have struck the area since the earthquake hit. Scientists believe this earthquake ruptured a fault that leads to the northwest, past Anchorage. This quake caused a lot of damage and made seismic stations in the area go haywire, not to mention stations elsewhere in the world. During the time period of this earthquake and subsequent aftershocks, there was a slight increase in seismic activity for the Pacific Northwest. A few quakes occurred in Washington state and a few occurred off the coast. I will show some simple data real quick. Please click the title of this post or "read more" to continue! 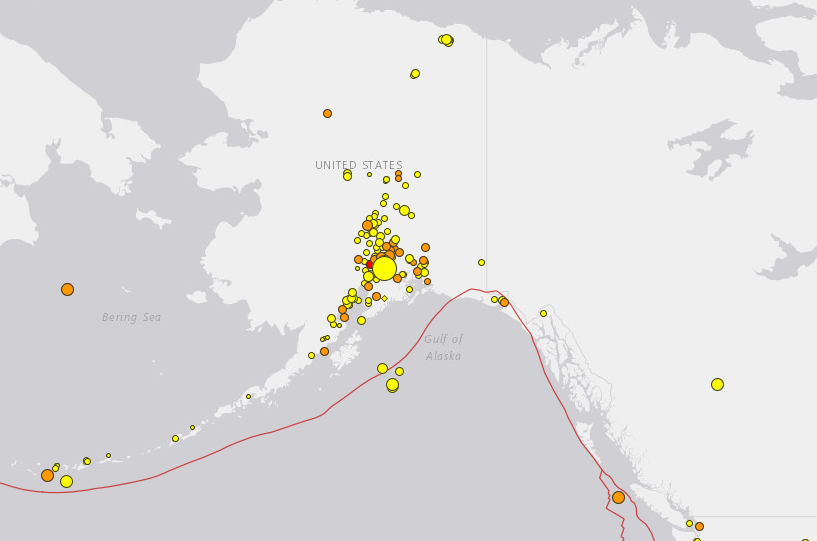 The biggest yellow dot you see in Alaska is the M7.0. You can also see a lonely quake off in the distance toward the southeast. I talk about that quake in my most recent video (link below). At 17:29UTC November 30, 2018 (9:29am Pacific Time, same date) a very large M7.0 earthquake struck Anchorage, Alaska at 44.1km in depth. This beast was followed by almost 1,000 aftershocks in a little over 1 day. Scientists believe the fault near Anchorage, Alaska was ruptured by this earthquake. It reminded me much of the Nisqually earthquake in Seattle in 2001. I was about 8 years old then but I will always remember it forever. It was scary but extremely cool at the same time. It is interesting to note that about 16 hours prior to this M7.0 in Alaska, a strange M4.2 quake struck near Fort St John in British Columbia, Canada. About 11 quakes have occurred there since a little longer than a decade ago but the characteristics of the coda (end tail) of the M4.2 was interesting. If you would like to watch my recent video about it, which also contains data about the recent mystery seismic event that is puzzling the seismological community, then please CLICK HERE. That link will take you to my video. Please visit it's description box for the parts section so you may skip to a part you want to watch, since the video is quite long. 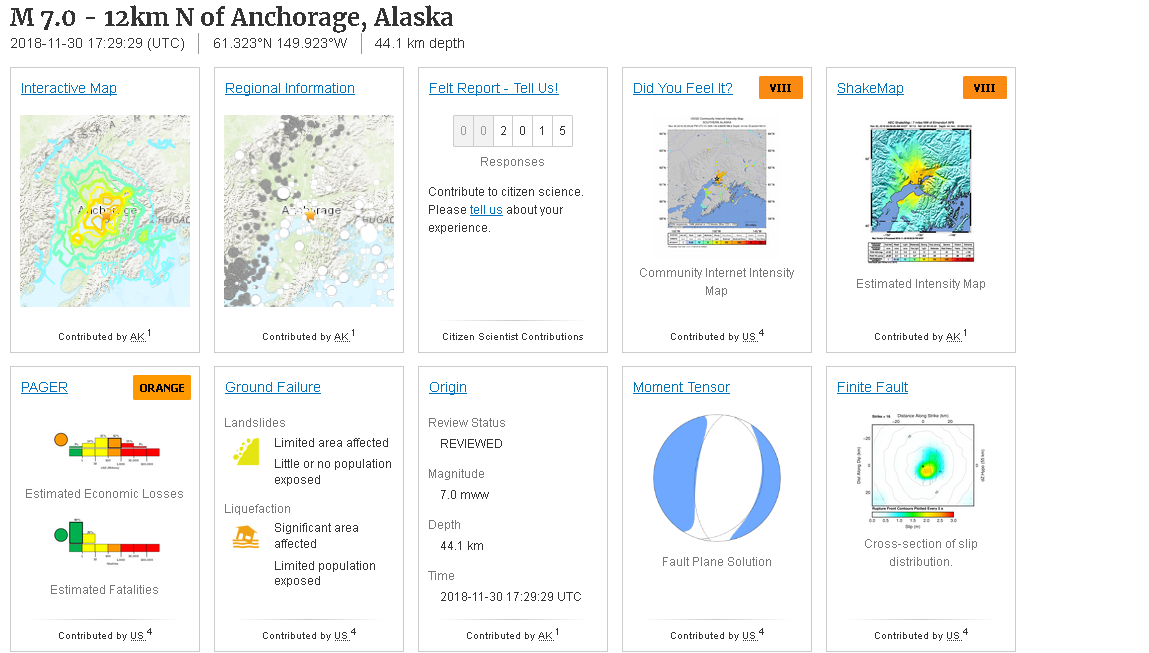 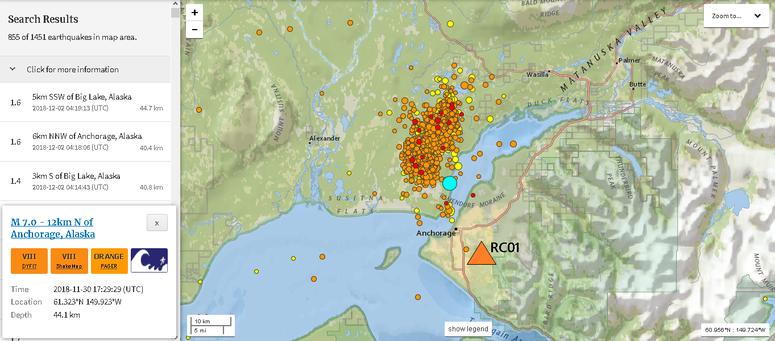 The first image of two above is the USGS event page for the M7.0. Notice how many people reported feeling it! Yeah, I bet this was felt hundreds and hundreds of miles away! The second image shows the M7.0, highlighted, and the rest of the earthquakes since the event occurred. As of 4:19UTC December 2, 2018, there have been 855 earthquakes in this specific location including the M7.0 and a few other quakes scattered beyond the main area of activity. The count will most likely reach 1,000 earthquakes in the next 12-24 hours of the time just posted. Also in the second image is the location of station RC01 in the AK network. I will show the recent helicorder plots for this station along with the seismogram/spectrogram/spectral plots of this M7.0. As always, please pay attention to all chart labels first and don't forget to read any captions beneath any images. The helicorder plots will be in slide show format. Also note it seems the M7.0 almost broke the seismograph just a few minutes after the earthquake started. 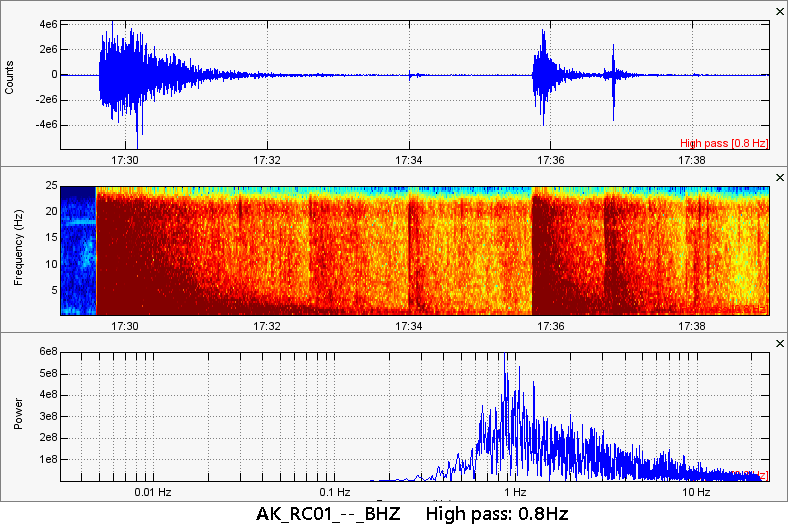 This was quite a strong earthquake indeed! I do not believe anyone was killed thank God. But there was alot of damage. I am surprised to see such strong low frequencies. I know this was a tectonic earthquake and there are of course strong frequencies of all ranges, but still. This station resides basically right near the epicenter. Why is the strongest frequency around 1Hz? This may be normal but I think it is odd. Remember though, I still have much to learn. Some PNW quakes during Alaska unrest: 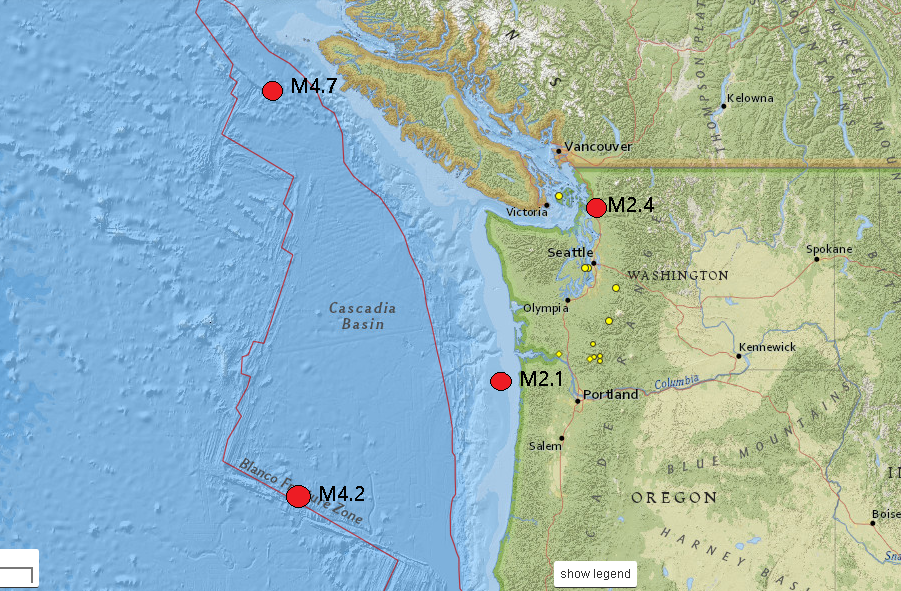 Now during the time period of the M7.0 and subsequent after shocks there were some earthquakes that occurred in the Pacific Northwest. In the image above you can see some micro-quakes near Mt St Helens, two near Seattle, and a few spread around the region. The 4 earthquakes marked are the ones I will show data for. I am simply going to show the USGS event page and the seismogram/spectrogram/spectral plots for each quake using data from the closest seismic station. Remember if you ever want to know what the closest seismic station was to any reported event, just click on the earthquake link (in the tab that pops up when you select an earthquake on earthquake.usgs.gov). Once you have done that, simply click "origin". Then click "phases" and click "distance" once. This will show a large majority of seismic stations that picked up the event in question. The shorter the distance, the closer it was to the event. Please pay attention to all chart labels as usual and read any captions beneath any images. 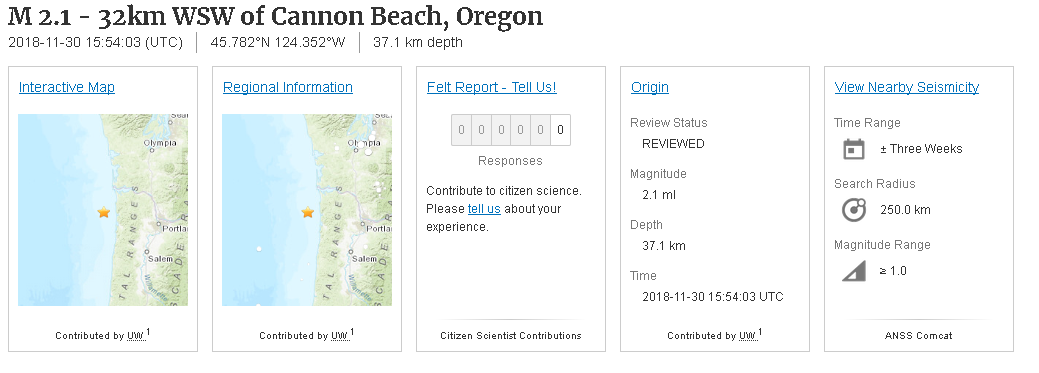 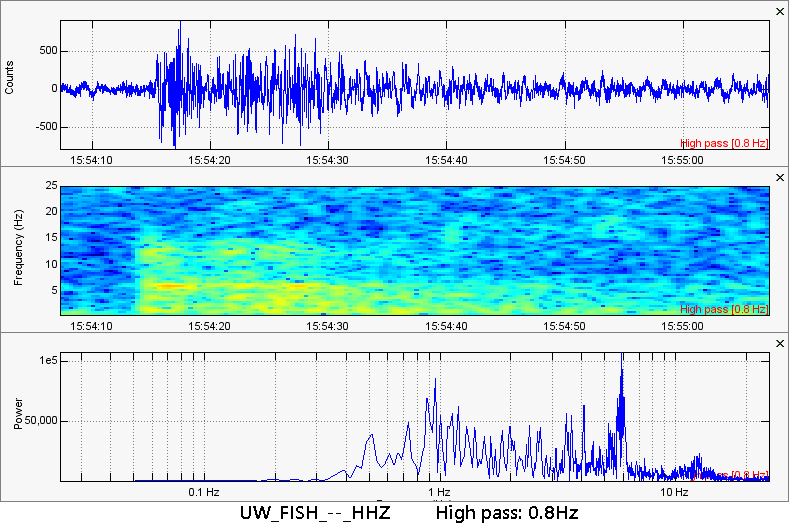 This earthquake had dominant mid-range frequencies and took about 10 seconds or less to arrive at this station. This occurred just offshore of Oregon, just west of Portland. This was the closest seismic station to this event. You can see the event info directly above this image. 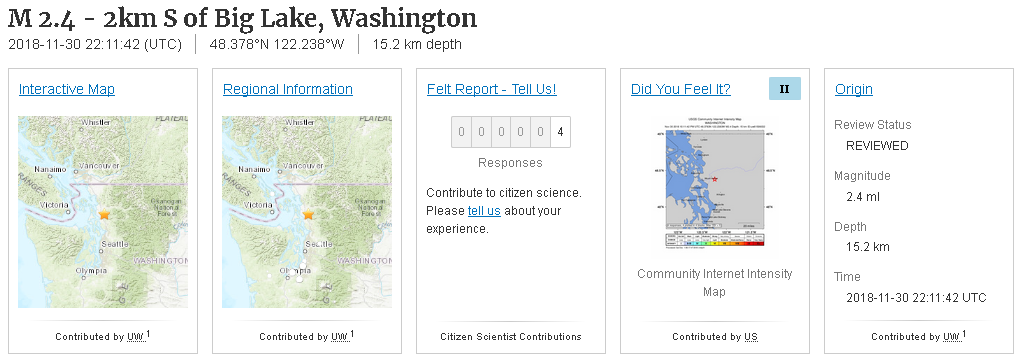 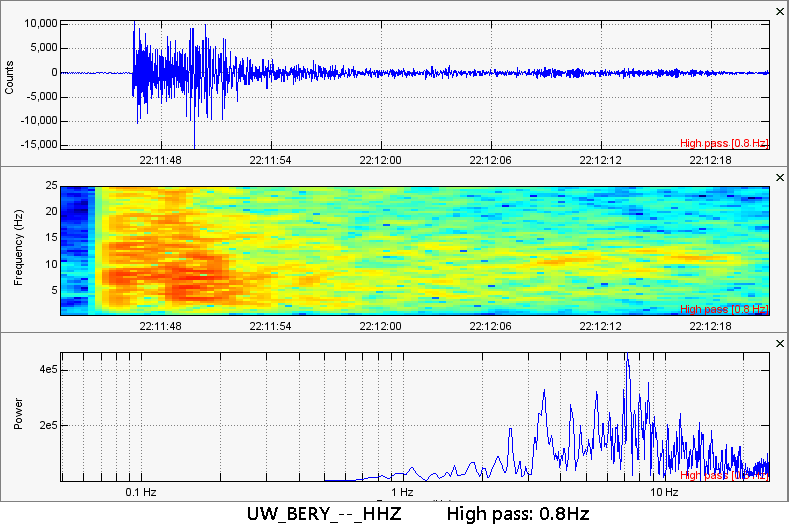 This 2.4 earthquake, which occurred in Northern Washington at about 15.1km in depth, was actually felt by a few people. 4 people so far have decided to report this earthquake to USGS. That means more people definitely felt it. All characteristics are indicative of normal tectonic activity. It struck barely north of the Devils Mountain fault line that passes from west to east, just south of Mount Vernon, WA. 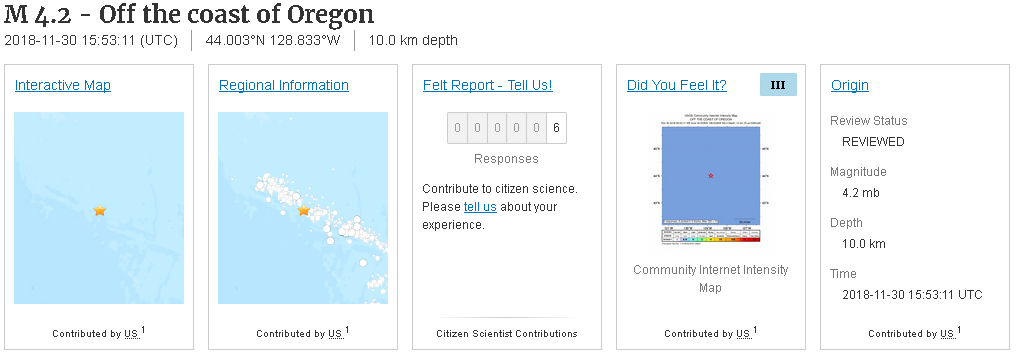 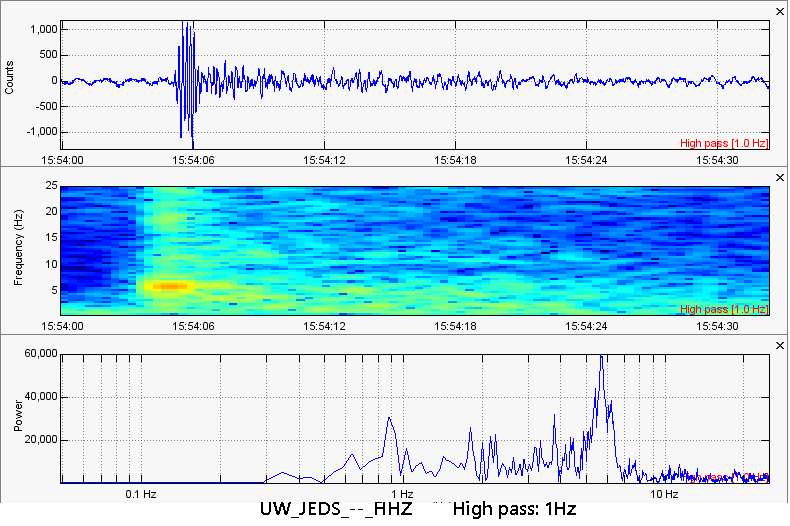 Now this earthquake was much harder to detect. It was reportedly a magnitude 4.2 earthquake at 10.0km in depth. However since 10.0km in depth is the depth USGS posts when they are unsure, and since the closest station to this earthquake was a great distance away, the 10.0km in depth is most likely not the true depth. This was a strange looking earthquake and this data was taken from the closest seismic station. 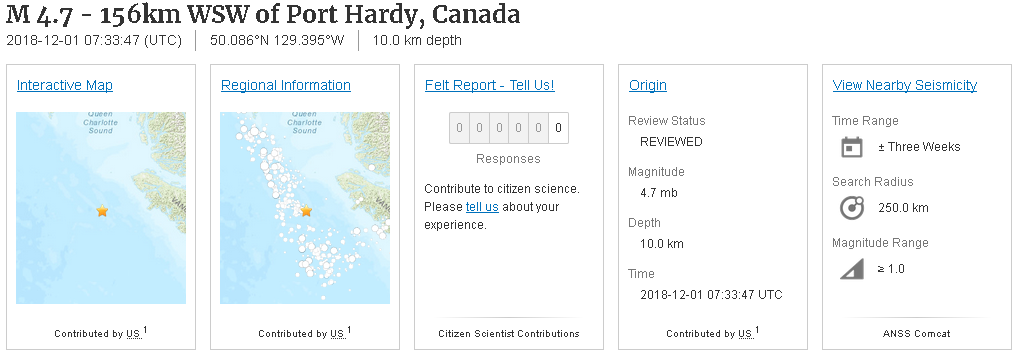 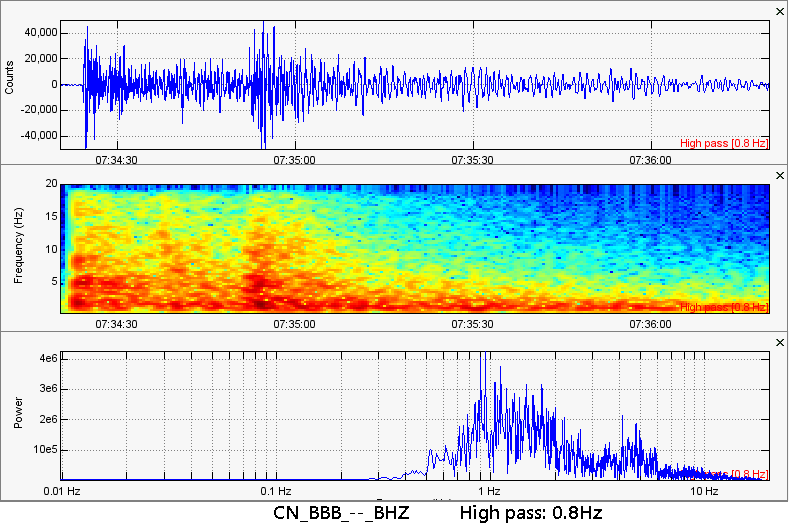 This earthquake struck off the coast of Vancouver Island right near the location of the large-magnitude earthquake swarm that occurred about a month ago or so. The largest quake in swarm was almost M7.0! So this could be a leftover from the event or it could be signaling that all the pressure has not been relieved. Again I am unsure if 10.0km in depth is correct. This data was taken from the closest seismic station. This event had dominant low frequencies once again but that may have to do with distance and depth. I personally believe this earthquake here was deeper than 10km. Maybe 30-50km possibly? I hope you guys enjoyed this post. Please contact me with any information, requests, or criticism. I am always looking for new ways to improve my blog posts and YouTube videos. Please don't forget to check out my recent video! The link is within this blog post (look for the CLICK HERE link).
2 Comments
Rico
12/4/2018 01:13:09 am
Hello Ben,
Ben
12/11/2018 02:18:44 pm
Thank you much for the support! And yes the long distance vibration across north america is odd and it does not seem to be coming from Yellowstone. A few times it appeared to be coming from the west coast with the most recent event, the one I recently talked about, seeming like it was coming from the east coast. still have no clue what it is. Leave a Reply. |
AuthorBen Ferraiuolo is a fast learner and someone who will always stand for the truth. Visit "About Me" for more! Archives
November 2019
Categories |
 RSS Feed