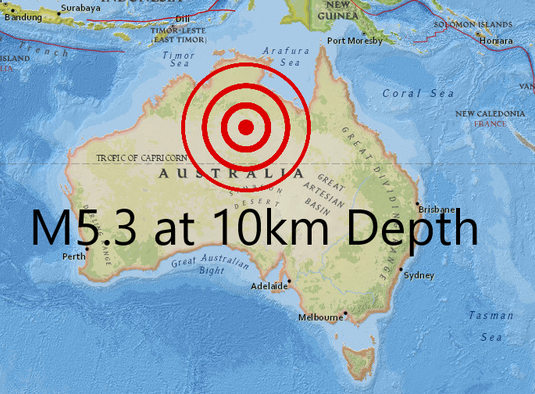
 On August 1, 2019 at 01:22UTC, a M5.3 (M5.4) struck Northern Australia at 10km in depth. In this post, I will show you why I think this earthquake was very strange. For the magnitude and depth, I am using the determination from Geoscience Australia (basically the USGS of Australia). USGS only labels it as being 0.1 larger. Please click the title of this post or "read more" to continue... 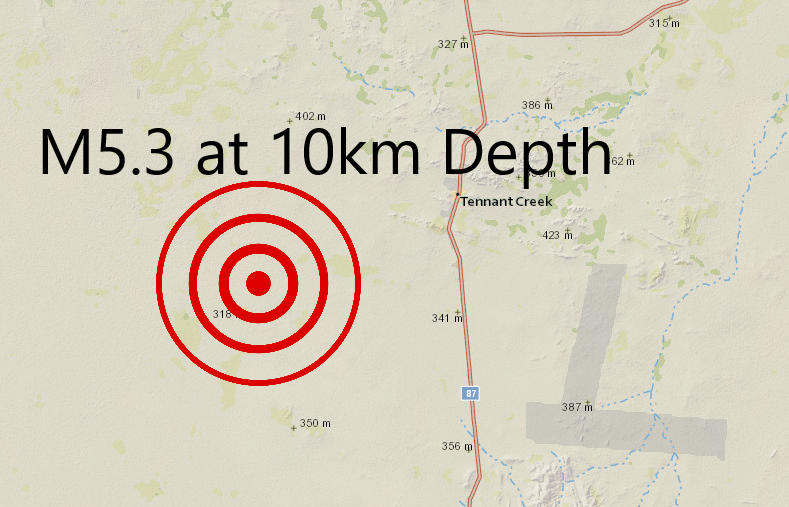 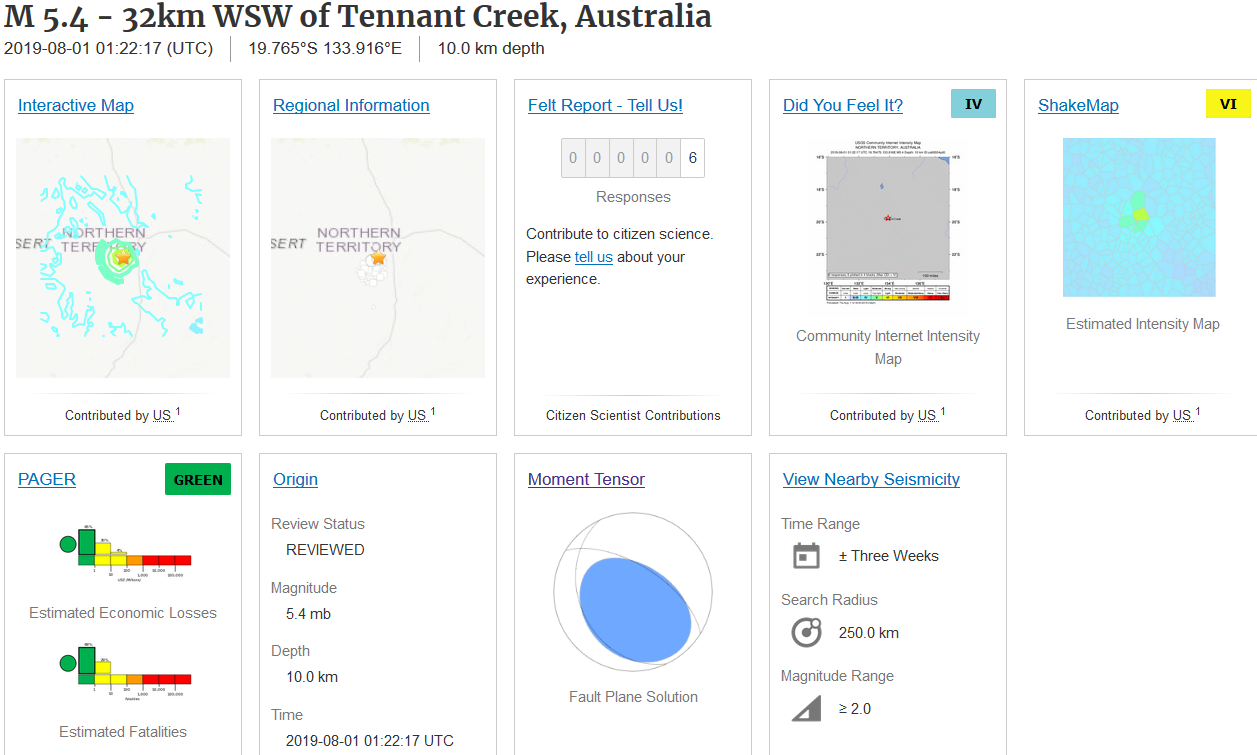 On August 1, 2019 at 01:22UTC, a M5.3 (M5.4) struck Northern Australia at 10km in depth. This area of Australia is no stranger to seismic activity. However, since 2000, this is the largest earthquake for this area (maybe even longer than that). Check out the image below: 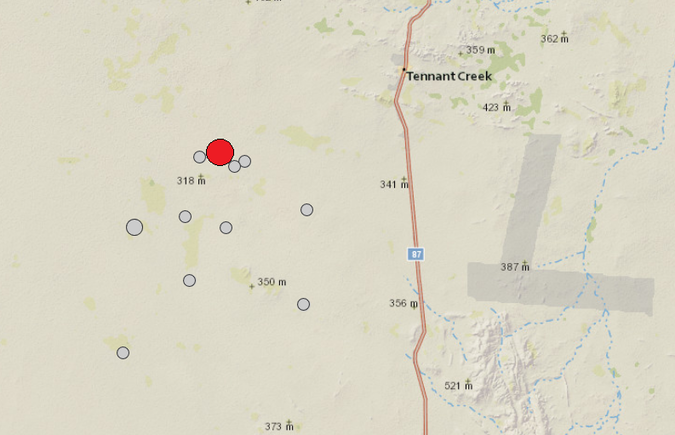 From January 1, 2000 through August 2, 2019, only 11 earthquakes above M4.0 have struck this area with the M5.3 (M5.4) being the largest since 2000. To see an event this large or larger, you would have to go all the way back to late-January 1988! In January of 1988, within a couple weeks, some very large earthquakes broke out in this area including 3 M6+ events, with the largest being a M6.7. Very strange type of activity for this area. Now to some seismic plots. Below are the helicorder plots to the 4 closest seismic stations. CLICK HERE if you wish to see where they are located on a map. Although I am able to show WR8 in the program WAVES below, the data was corrupted and unable to open in SWARM somehow. However, you can tell some of the stations glitched out after the M5.3. Here is what the event looked like via seismograms from WAVES (note the odd waveform characteristics shown on the first 3 stations): 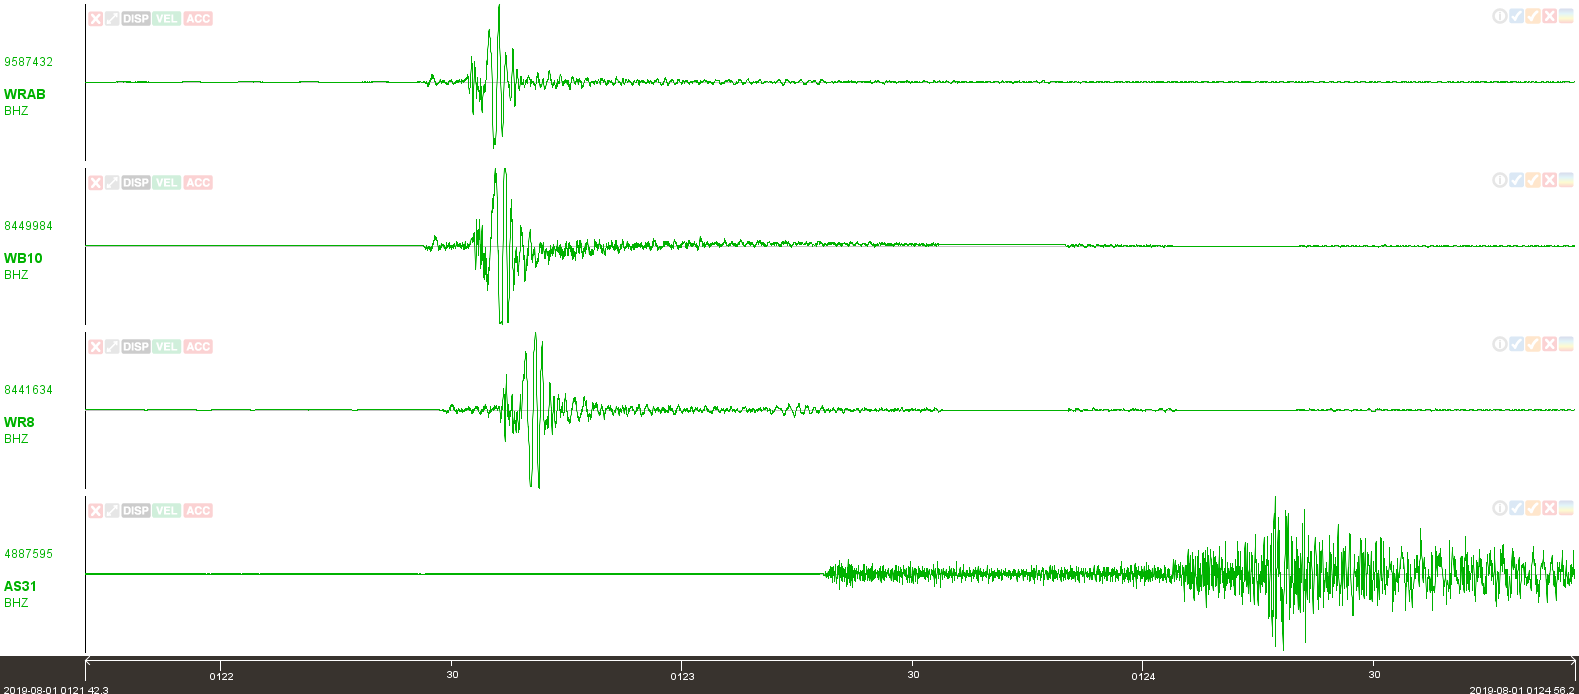 Here are plots from the closest seismic station to this event: WRAB. This is the same event from the same station. However, each plot is filtered differently. One is unfiltered, one has a 1Hz high pass filter, and another has a 0.8Hz to 6.0Hz band pass filter. Notice how odd this event looks? Right off the bat, I thought this is something other than a simple tectonic event. Now, why do I think this event was so strange? For starters, the waveform characteristics. Second, the moment tensor. Both seem somewhat familiar to me. They appear to be a possible underground collapse or the failure of a ring fault. What is a ring fault? A ring fault is a series of interconnected faults in a "ring" pattern around a volcanic caldera or ancient impact site. That is what peaked my interest, seeing there are supposedly no volcanic calderas or impact sites in this location (at least to my knowledge). So was this then a collapse of some sorts? Let's take a look at the moment tensor. 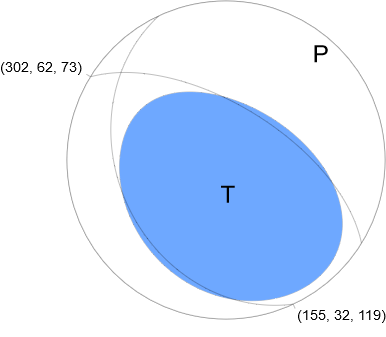 USGS moment tensor of the M5.3 (M5.4) near Tennant Creek, AU on August 1, 2019. This is the moment tensor provided by USGS. Notice the blue part? And notice how it kind of looks like a fried egg? I have seen moment tensors like this during underground collapses, whether human-caused or natural. Even the Kilauea eruptions of 2018 had moment tensors somewhat similar to this one. So what caused the M5.3? And why did this area see such intense seismicity in 1988? Is it possible there is more going on than just simple tectonics? After all, Australia is volcanic. Believe it or not, there are many volcanoes in Australia. Most of them are extinct, but they do have a few dormant ones. That being said, there are no known volcanoes in this area. That doesn't mean there won't be one in the future! Always keep an open mind! Take a look at the basic 3 moment tensor examples below. 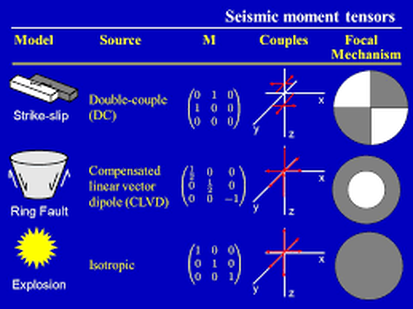 The detail of the image above probably isn't very good, but there are three basic examples. The moment tensors are very basic as well. Imagine the gray color on the moment tensors is actually blue (to compare to the USGS moment tensor). Note it shows strike-slip, ring fault, and explosion models.
Note the ring fault model. It seems somewhat opposite of the moment tensor for the M5.3, even opposite of other collapse events I have seen. Was this really an underground collapse or the failure of an ancient ring fault system? I don't know, but it sure would be interesting to find out! Regardless, the characteristics of this event were very strange. I have contacted Geoscience Australia to discover why the waveform characteristics and moment tensor were so peculiar. Hopefully they reply soon. When they do, I will post an update here on this post. Below is the seismic audio of this event from the closest station. It is kind of hard to hear, so use your headphones. Seismic audio is available for retrieval from the IRIS Time Series download source. The following is 5 minutes of data compressed into about 3 seconds of audio. Any more, and the audio would be hard to hear.
1 Comment
Darren Forbes
8/3/2019 04:23:43 am
There is an impact crater out there. Leave a Reply. |
AuthorBen Ferraiuolo is a fast learner and someone who will always stand for the truth. Visit "About Me" for more! Archives
November 2019
Categories |
 RSS Feed