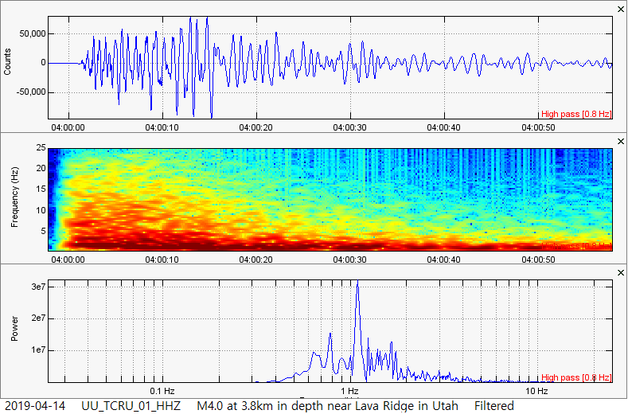
 Hey guys! A very interesting earthquake has struck the Black Rock Desert Volcanic Field in Utah. I personally believe this M4.0 was a volcanic earthquake. Overall, you be the judge! I will show some information and data pertaining to this event and don't forget to try to analyze these events yourself! If you have not already, please click the title of this post or "read more" to continue... 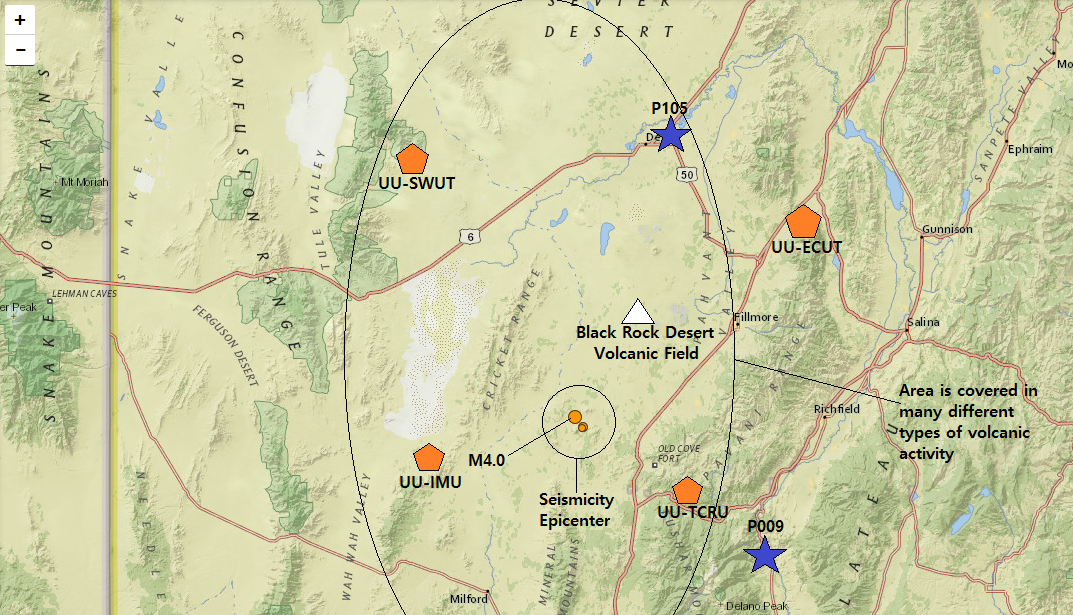 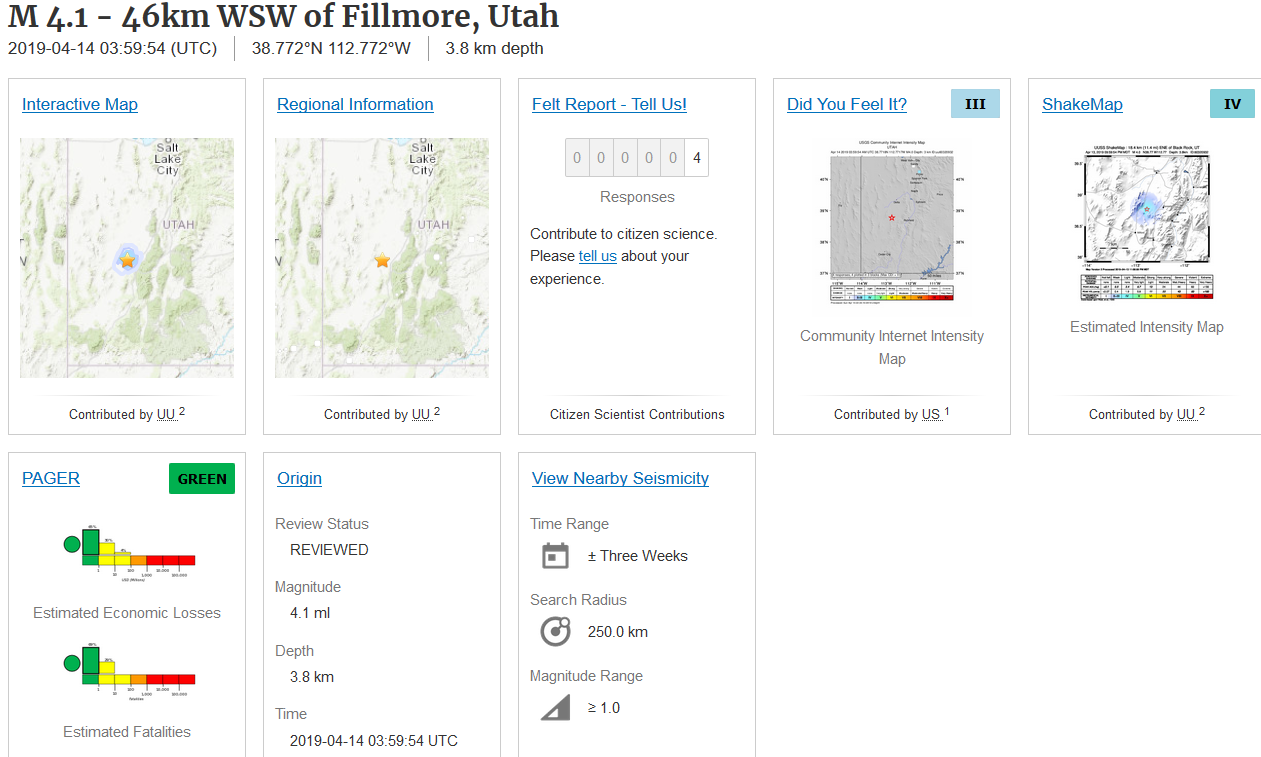 First off, I highly suggest you guys check out my recent blog post about the M5.3 and DLP-HF events in Hawaii. Please CLICK HERE to visit that post now. Also, if you wish to hear the seismic audio of this M4.0 earthquake in Utah then please scroll to the end of the post (if the video is not there, it is not up yet). Please also note this M4.0 struck Utah within 50 minutes of the M5.3 in Hawaii. I know they are likely not connected, but both locations have been relatively quiet lately and both saw a larger magnitude event than what usually occurs, all within 50 minutes. If you wish to see the past 2 days or so of seismicity for this area, please CLICK HERE. The first image above is the location of the earthquake epicenters with the M4.0 being marked. The orange pentagons are the 4 seismic stations I will use for the data below. Although station IMU is labeled, sadly it is glitching out and did not detect this earthquake due to instrument malfunctions. The center of the Black Rock Desert Volcanic Field is also labeled, along with the two nearest GPS deformation instruments (marked with a blue star). Many earthquakes that occurred as part of this sequence were not reported. So I highly suggest you download and analyze the data yourself, since I will only be showing some brief data about the 3 reported events. I will also show deformation data for uplift/subsidence from the two stations labeled as blue stars on the map above. I highly suggest checking out this area on Google Earth. There are a lot of volcanic goodies around this area! The second image you see is the event page for the M4.0. I know it says M4.1, but everywhere else it is labeled as a M4.0. I don't know why the event page only is showing M4.1, instead of M4.0. 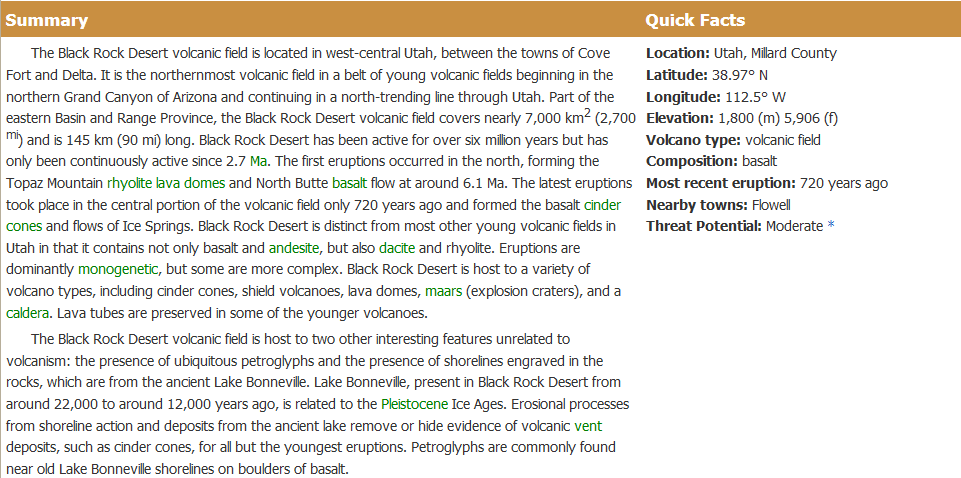 The summary directly above is from volcanoes.usgs.gov about the Black Rock Desert Volcanic Field. Note the threat potential is set to moderate, meaning the threat is somewhat low but that eruptive activity could begin again someday. If you wish to visit the page I got this from, please CLICK HERE. 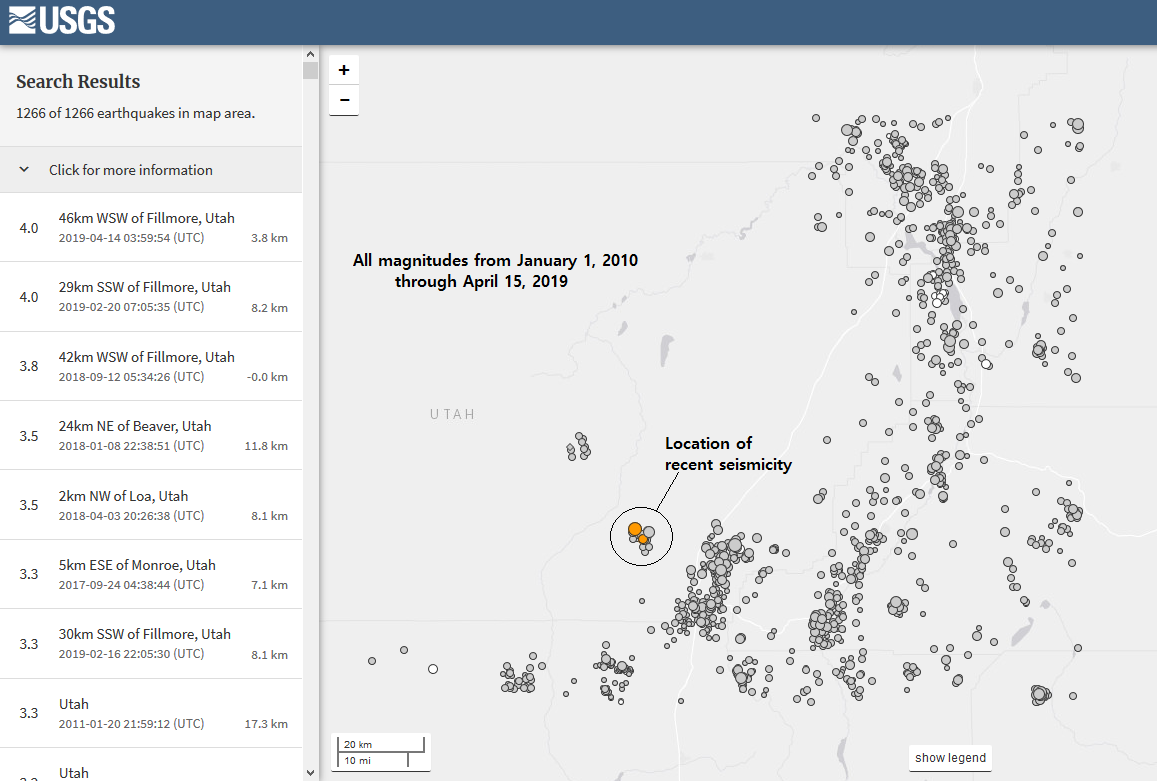 The image above is of historical seismicity for this area since January 1, 2010. Note there have been 1,266 earthquakes reported for this area, but far less for the actual earthquake epicenter. The epicenter is circled and notice there actually has been some concentrated seismicity in this area in the past years. If you wish to visit the map above on earthquake.usgs.gov, please CLICK HERE. Now remember the two blue stars on the map in the beginning of this post? Those are the two closest GPS deformation instruments to this location. Remember GPS deformation instruments record how the ground is shifting towards the north/south, east/west, and up/down (uplift/subsidence). Sadly, there are no GPS deformation instruments near the epicenter and these two instruments are some distance away. As you will see in the charts below, which show uplift/subsidence, subsidence seems to be the dominant trend. However notice there are many spikes in uplift which coincide with one another, even though they are many miles from each other. It is possible uplift could be occurring in this area, causing subsidence at these two stations. However it is hard to tell and I am no geodist. You be the judge! Below are the GPS deformation charts showing uplift/subsidence for the two stations labeled by blue stars on the map in the beginning of this post. Note the labels are very important to understand what you are seeing! 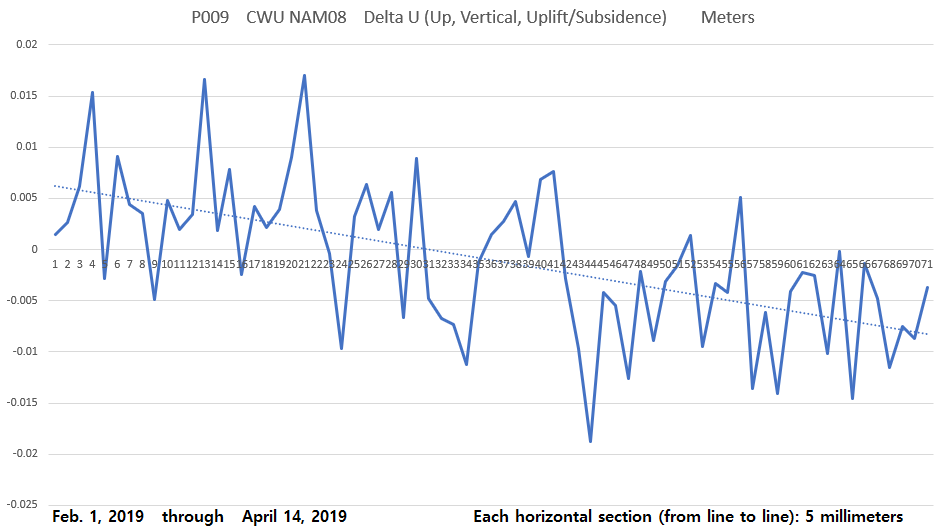 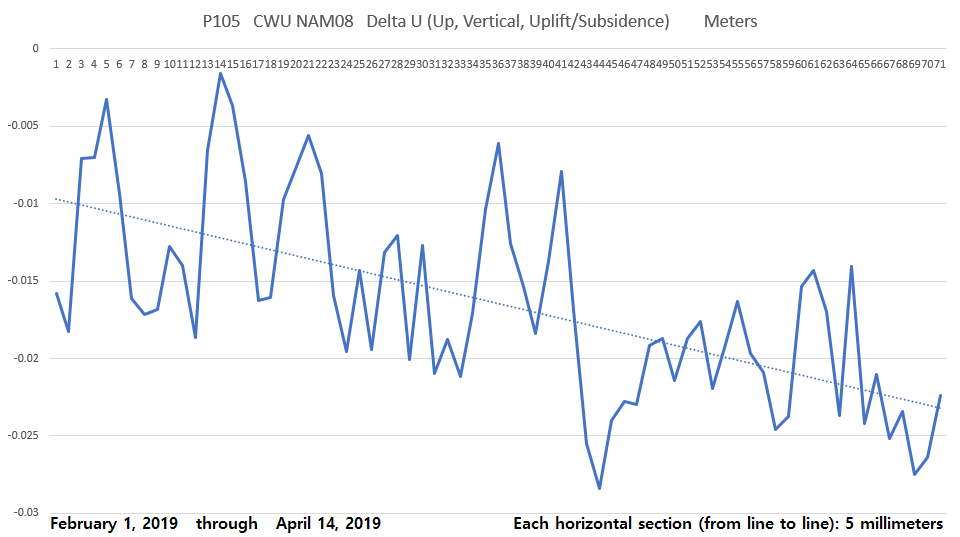 The following are 4 helicorder charts shown in slideshow format. These were generated by myself using the seismic program SWARM and data obtained from the 4 seismic stations labeled on the map in the beginning of this post. For all of the data shown in the rest of this post, it will come from the stations labeled on that map. Except for IMU. Although IMU is shown in the helicorder slideshow below, you can tell it is quite glitchy and actually does not show any real activity. Here are the 4 helicorder charts: And here are some random webicorder charts from the University of Utah archive. These were NOT generated by me, but by the U of U. Note the activity is centered at the bottom and MCID and MOOW are near the Yellowstone/Teton area. If you wish to see the actual locations of any seismic stations labeled in this post, please CLICK HERE. That link will bring you to the IRIS Gmap. A wonderful tool I quite literally use every single day. Simply enter any network code, for example UU, WY, IW, or US, click "Update Map" and take a look at all the seismic stations within that network you selected. You can also enter multiple networks at once. Play around with that tool! Without it, I would have a hard time doing what I do. Now the 3 reported events were a M4.0, a M2.7, and a M1.7. I will show those in order via my custom 3-plot images generated by myself using the program SWARM and data obtained from the seismic stations labeled on the map in the beginning of this post. Please go search Google for examples of volcanic earthquakes. Note how the lower frequency volcanic earthquakes seem very similar to this M4.0. That and the fact that this struck within a volcanic field, along with a shallow depth, suggests to me this was for sure volcanic in nature. Since TCRU is most likely the closest seismic station to this event, use that station as a reference point in regards to waveform/frequency characteristics. Here is a look at the M4.0: And here is a very zoomed-in look at the M4.0. TCRU is zoomed in just a tad bit more than the other 2 stations. Here is the reported M2.7: And here is the reported M1.7: The last event in the following video is the seismic audio of the M4.0 earthquake in Utah: LINK: https://youtu.be/gf3CqBwk7_U
0 Comments
Leave a Reply. |
AuthorBen Ferraiuolo is a fast learner and someone who will always stand for the truth. Visit "About Me" for more! Archives
November 2019
Categories |
 RSS Feed