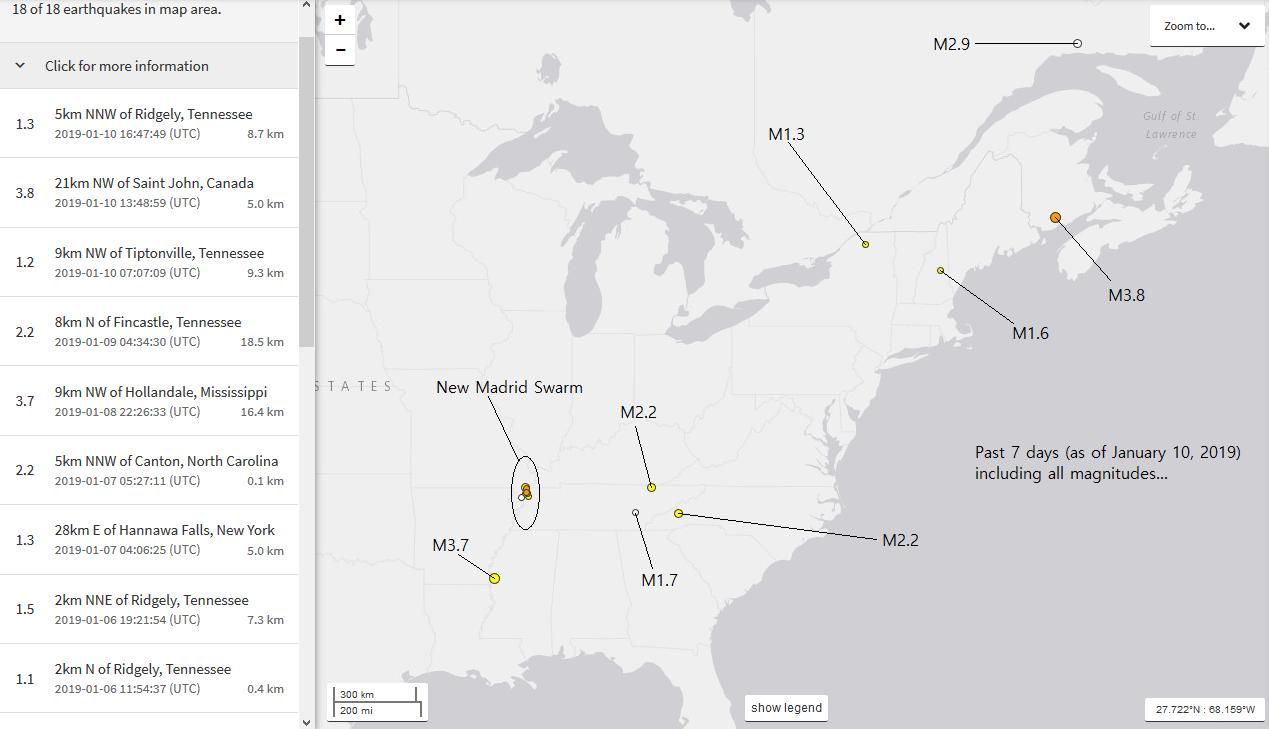
 As usual, please click the title of this post or "read more" to continue... As you can see in the image above, there has been some interesting seismicity as of the past 7 days for the eastern half of the United States. There was a M3.7 in Mississippi (shown in a second) and a M3.8 in Canada (shown in a second) just to the east of Maine. Some other smaller events were scattered around the area including some swarming right within the New Madrid seismic zone. Of course events like these do happen, but is there a larger earthquake approaching for the area? Only time will tell. Lets first review the M3.8 to the east of Maine. 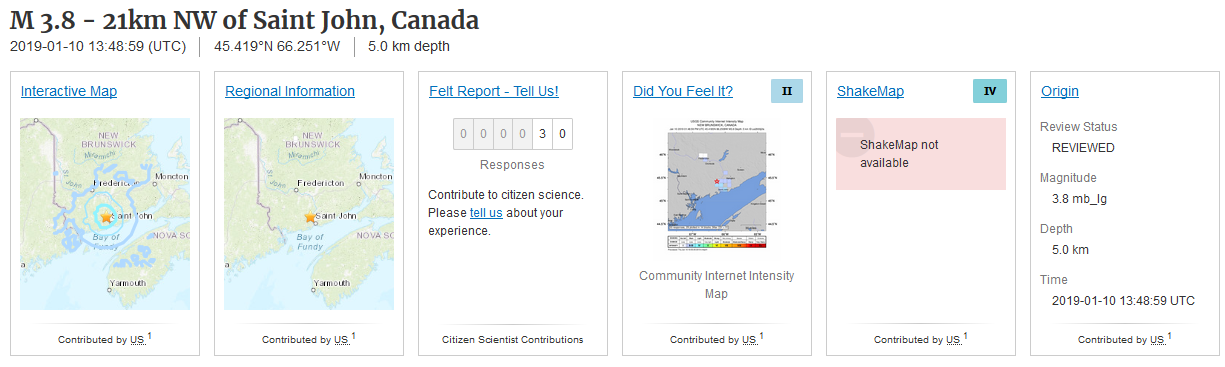 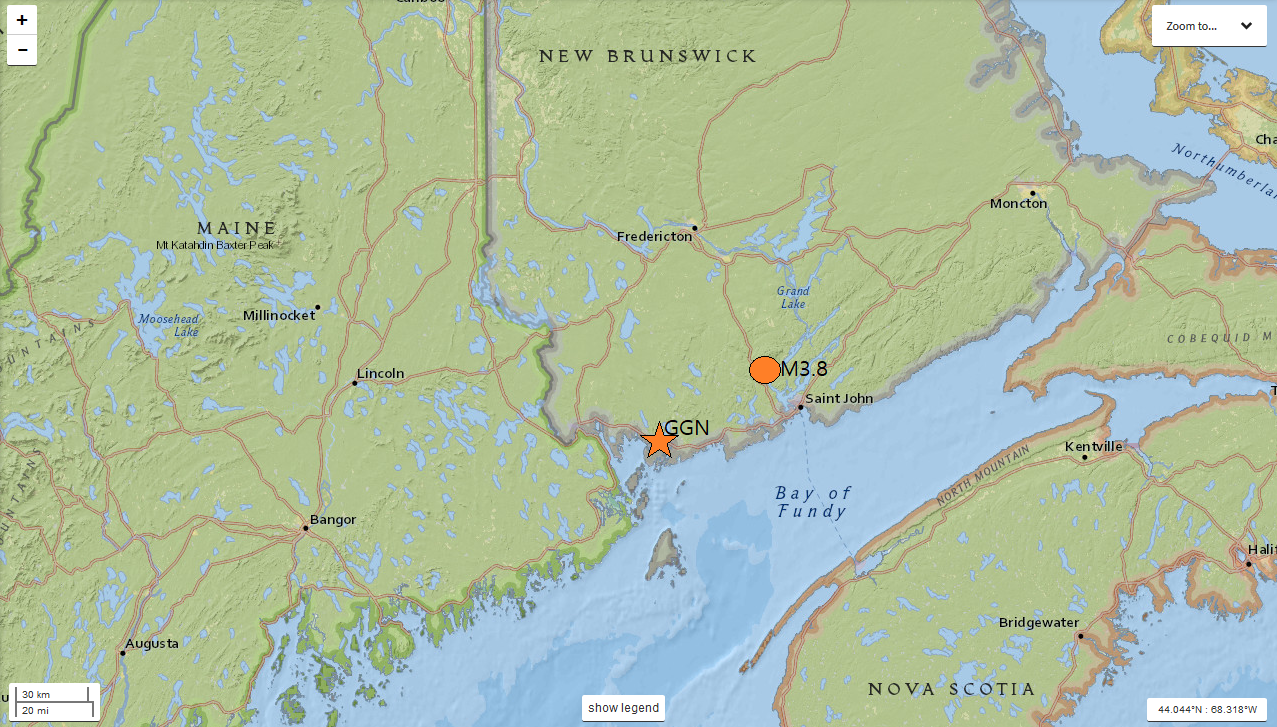 On January 10, 2019 at 13:48UTC, a magnitude 3.8 earthquake struck at supposedly 5km in depth just east of Maine. Over 30 people reported to USGS that they felt this event. Remember those are only the people who decided to take time out of their day to report this! It is likely many more people actually felt it. In the first image above, you can see the event page for this earthquake (USGS). The second image you see shows the location of the earthquake in regards to the closest seismic station, GGN in the CN network. This is definitely a very interesting location for an earthquake! As you will see below, this event was very peculiar. While viewing the following plots, please always remember to read chart labels first and pay attention to any captions beneath any images. All seismic plots were generated by yours truly using data obtained from IRIS using SWARM. 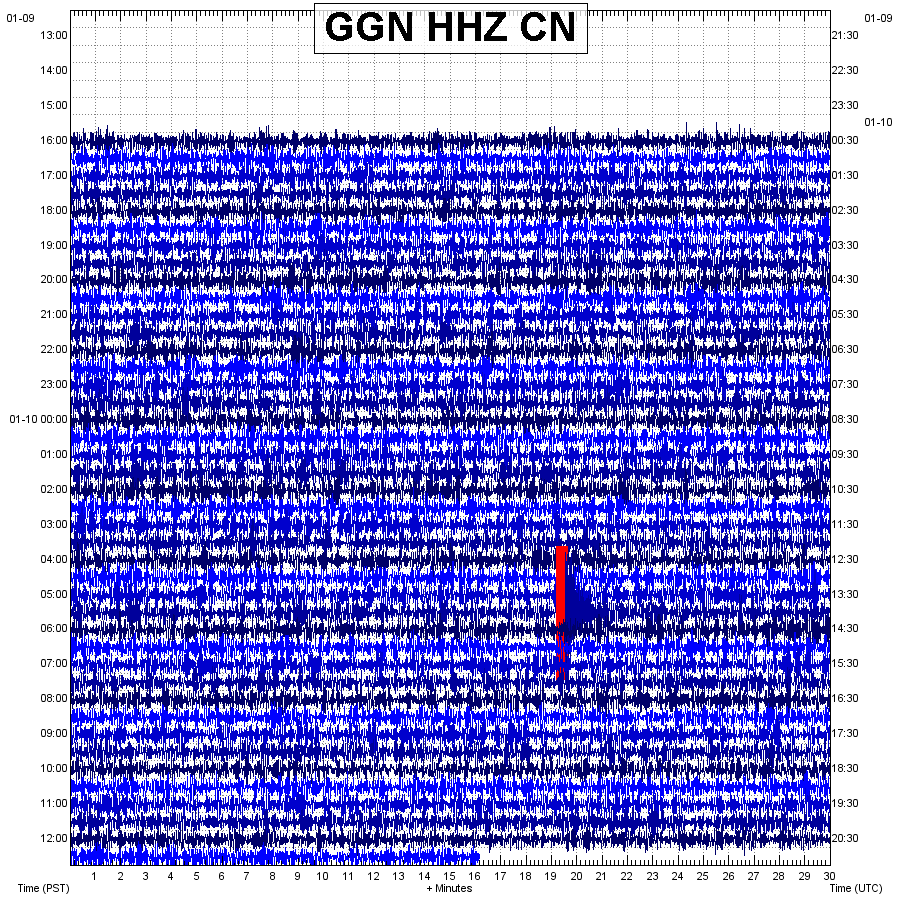 The custom helicorder for station GGN in the CN network. You can clearly see the earthquake, since it is the only event where the amplitudes were cut. 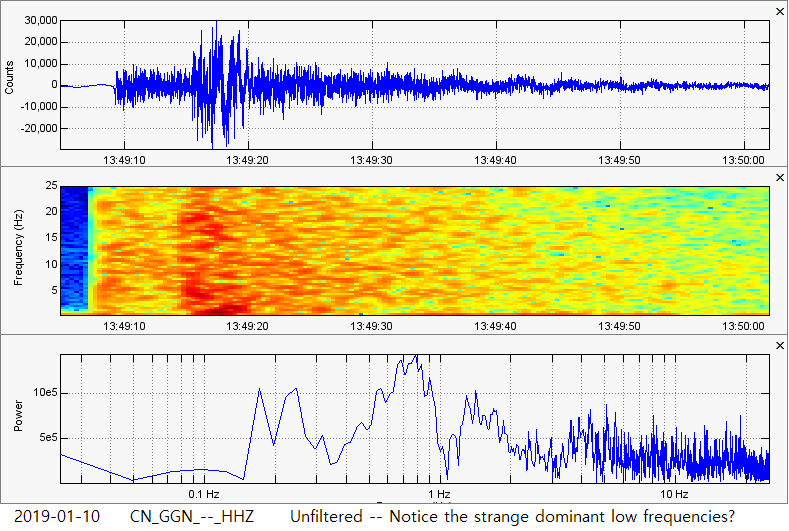 As labeled, this 3-plot image has no filter attached. Notice the strange and powerful dominant low frequencies between 0.4Hz and 1Hz? That is extremely odd for an earthquake of this magnitude, especially for this location. Why were the frequencies so low? Again, the most powerful part of this event had dominant frequencies between 0.4Hz and 1Hz. 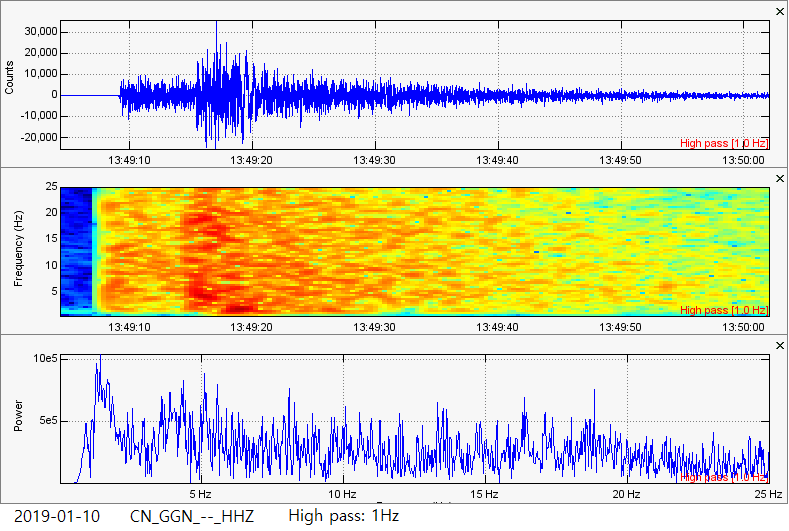 For this 3-plot image, all frequencies below 1Hz were filtered out, in other words "deleted". Although this contains a 1Hz high pass filter, we can still obviously see strong low frequencies. This is NOT a low frequency earthquake, it just has some very strong low frequencies. 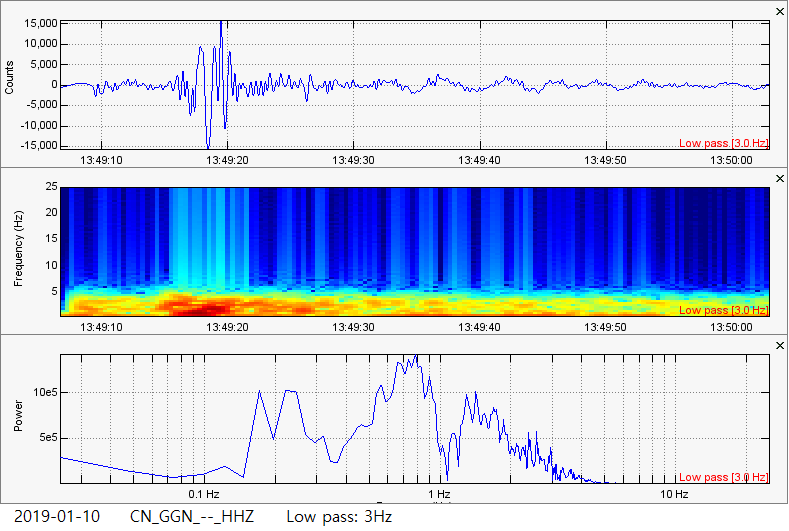 Now this 3-plot image is the same exact earthquake, except with a 3Hz low pass filter. Opposite of a high pass filter, this 3Hz low pass filter will "delete" or filter out all frequencies above 3Hz. This will show us the strongest low frequencies of this earthquake. Again, low at how strong the low frequencies are! This truly was an odd earthquake. What process could have created this event? Who knows. I bet the seismologists in the area are as puzzled at this as I am! M3.7 in Mississippi 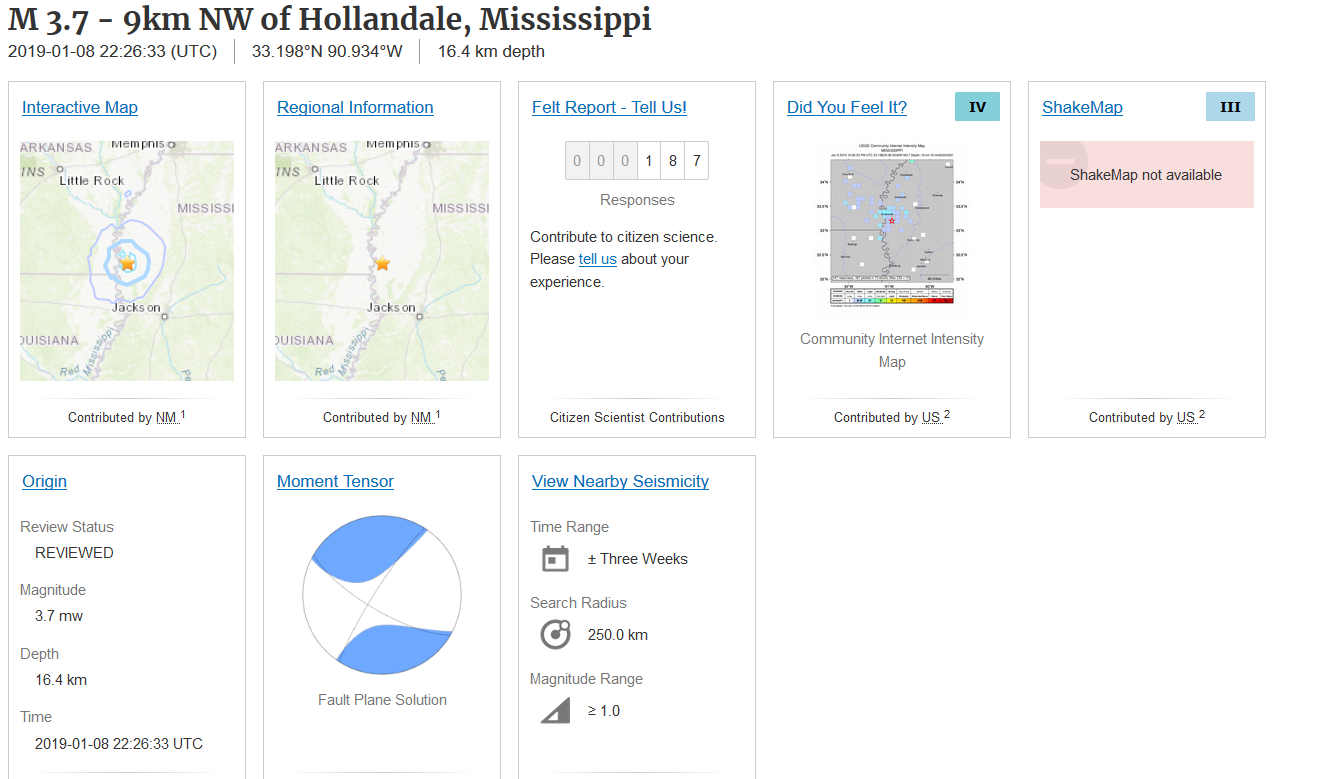 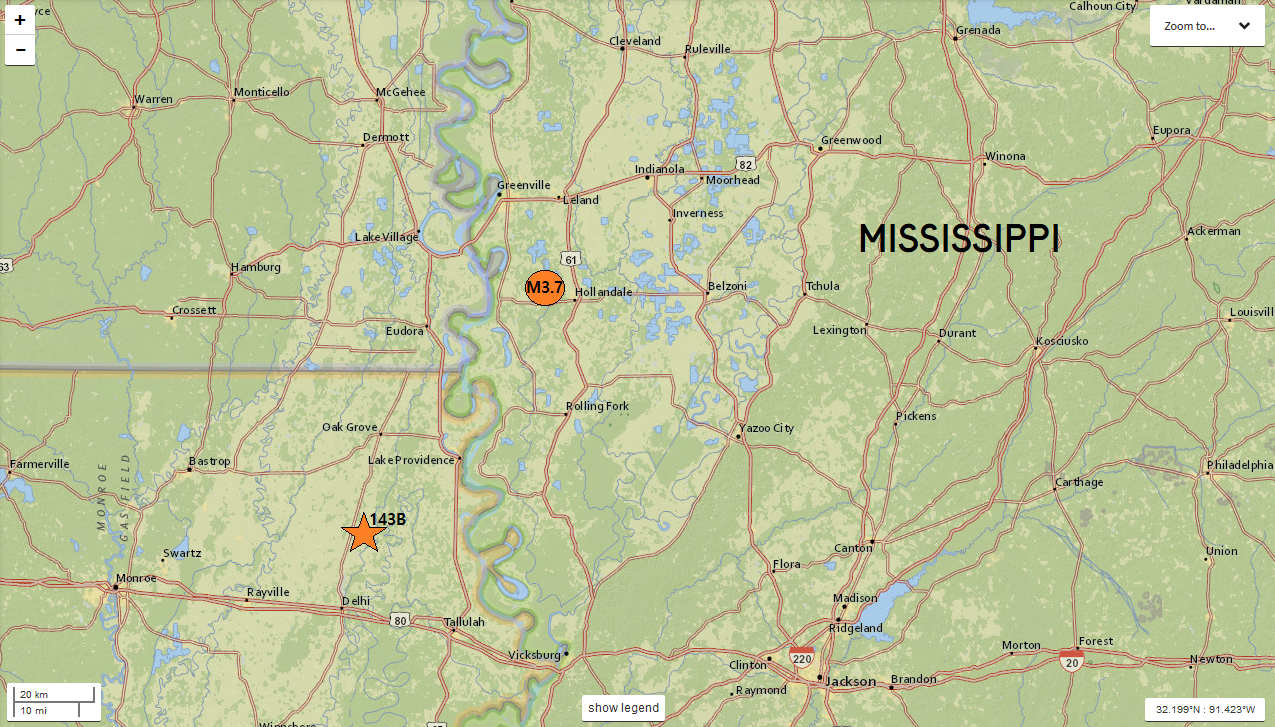 Now about a day and a half before the M3.8 hit near Maine, a M3.7 earthquake struck around 16.4km in depth just barely to the west of Hollandale, Mississippi. It struck at 22:26UTC January 8, 2019 (3:26pm MST, same date). You can see the event page for this earthquake above. Apparently, over 187 people felt this event over a good sized distance. The second image you see is the location of the M3.7, at 16.4km in depth, in regards to the closest seismic station. Over the past few days there has been some slight swarming within the New Madrid seismic hazard zone. Could those earthquakes be related to the M3.7 in Mississippi? Could be! Below I show the seismic plots to this event from the closest seismic station: 143B in the N4 network. As always, read chart labels first and pay attention to any captions. 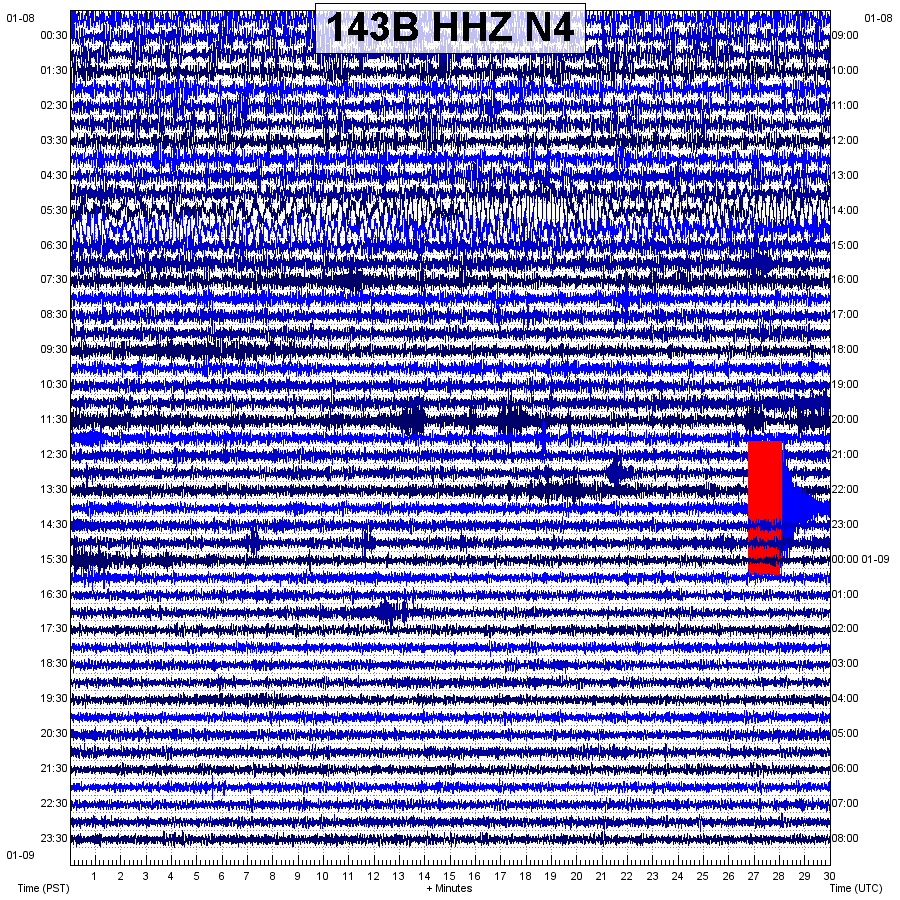 The custom helicoder for station 143B in the N4 network. You can clearly see the earthquake. It appears there were no aftershocks, which I find odd for an earthquake of this magnitude. 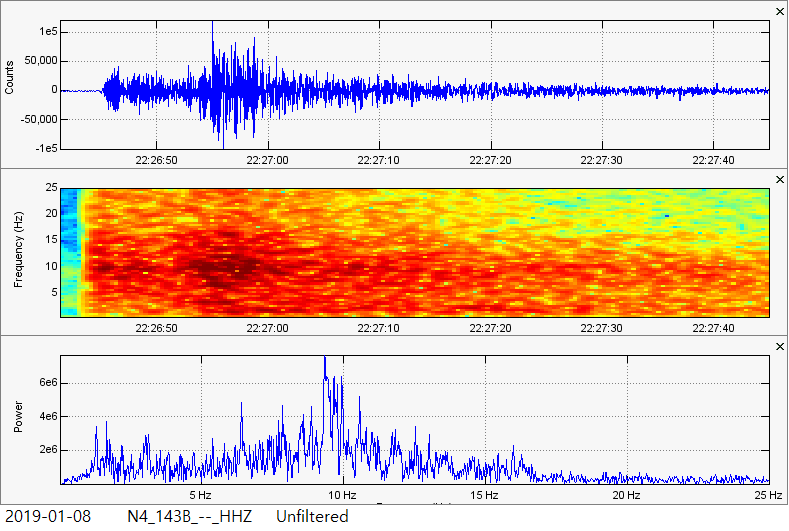 This M3.7 at 16.4km in depth seems to be a normal tectonic event with normal frequency ranges. Dominant frequencies remain between about 9Hz and 12Hz. Why were there no notable aftershocks? Regardless, this event was reportedly felt by many more people than the shallower M3.8 that struck near Maine. Why is that? Actually, I have no clue. I will continue to monitor this area, among others, and will notify you if anything major occurs. Have a great day!
0 Comments
Leave a Reply. |
AuthorBen Ferraiuolo is a fast learner and someone who will always stand for the truth. Visit "About Me" for more! Archives
November 2019
Categories |
 RSS Feed