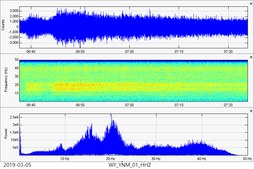
 This past week of seismicity in the USA, and the world as well, has sure kept many amateur and professional seismologists busy! Alot of different things have been occurring lately and many different swarms and larger-than-normal quakes have been striking some odd areas. In this post I will deal with the recent strong M3.4 that hit Tennessee, a strange but normal looking M4.1 hit Poland in Europe, and Steamboat Geyser erupted for the 8th time of 2019 (the 40th time since it reactivated in early-2018). As usual, please click the title of this post or read more to continue... M4.1 in Poland 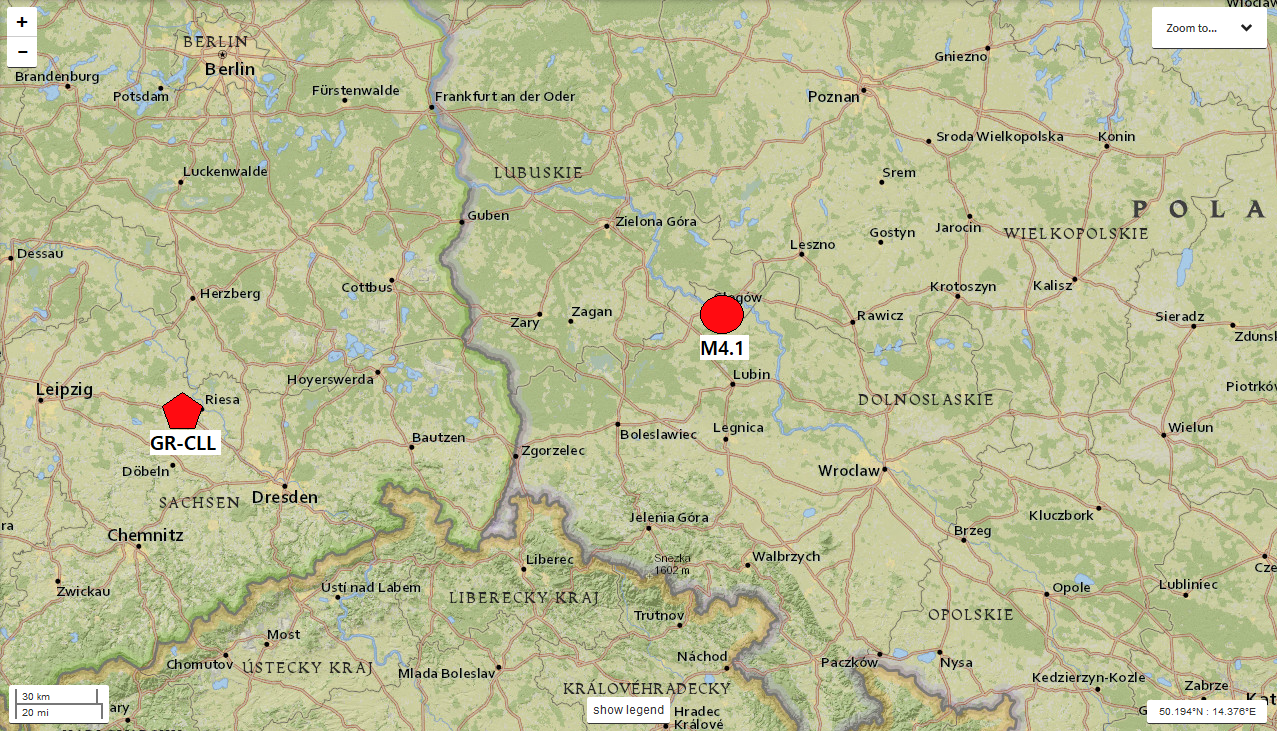 The location of the M4.1 that struck Poland in respect to the closest seismic station to detect this event. 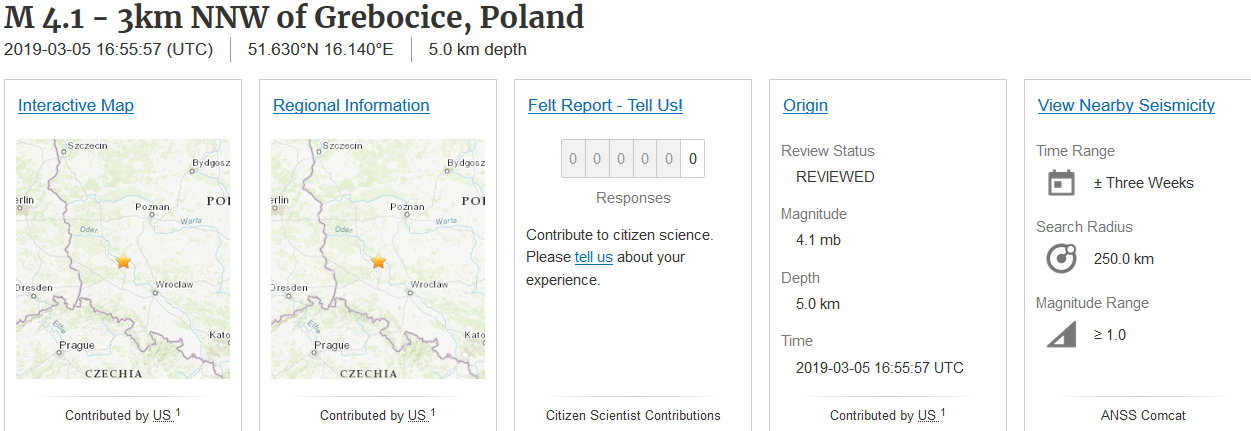 This past week of seismicity has been odd. Not just for the United States, but also for the world! First off, if you haven't heard about the recent M3.3 and aftershocks that struck Yellowstone just within minutes of the large M4.5 in Colorado, then please CLICK HERE to visit that video I made. Again, seismicity has been getting strange! Although Poland does see earthquake activity from time to time, it doesn't happen often much so it is worth noting. At 16:55UTC on March 5, 2019 a M4.1 earthquake struck western Poland. Apparently, nobody reported feeling it even though this M4.1 struck around 5.0km in depth. Either it is true nobody felt it, or nobody in Poland even knows what USGS is. So it is possible people near the epicenter felt the earthquake, even if the DYFI is at 0. Below I will show the plots to this M4.1 that struck Poland. Remember to always pay attention to chart labels and any captions beneath any images. 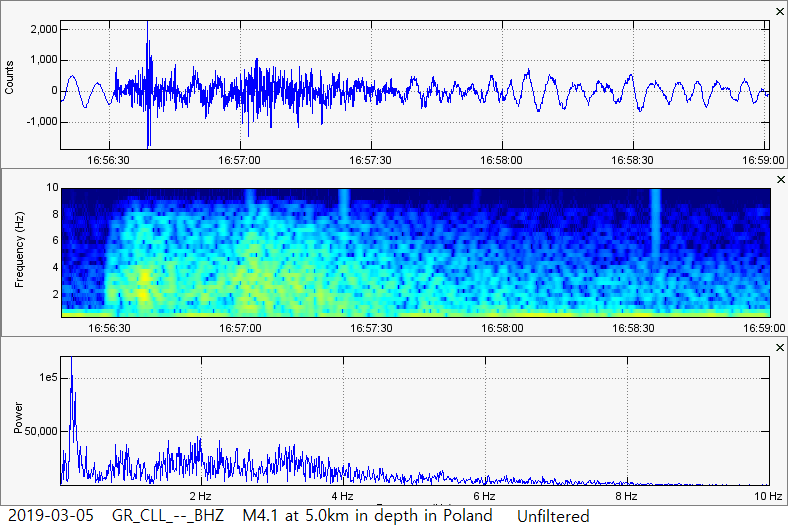 This, at least to me, appears to be a normal tectonic event. However do not hold me to that since I have no clue what fault this event stuck on. 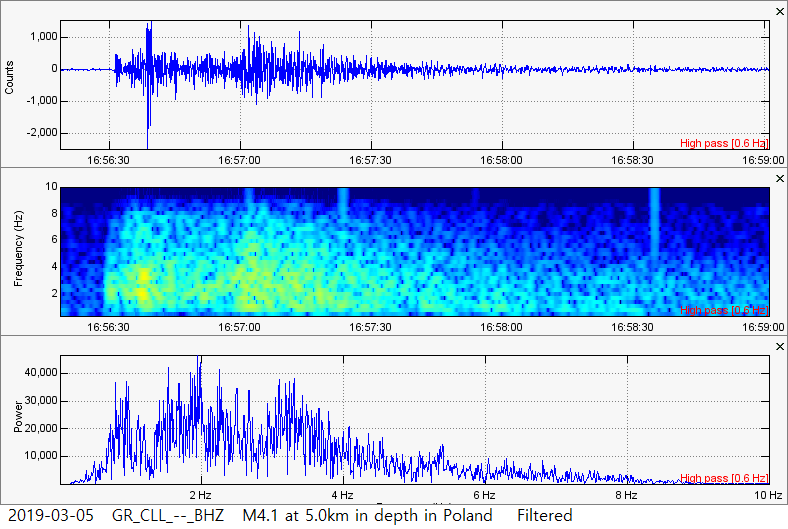 This is the same 3-plot image as shown above, however a 0.6Hz high pass filter was added to mostly remove the background microseisms that broadband stations detect so well. M3.4 in Tennessee 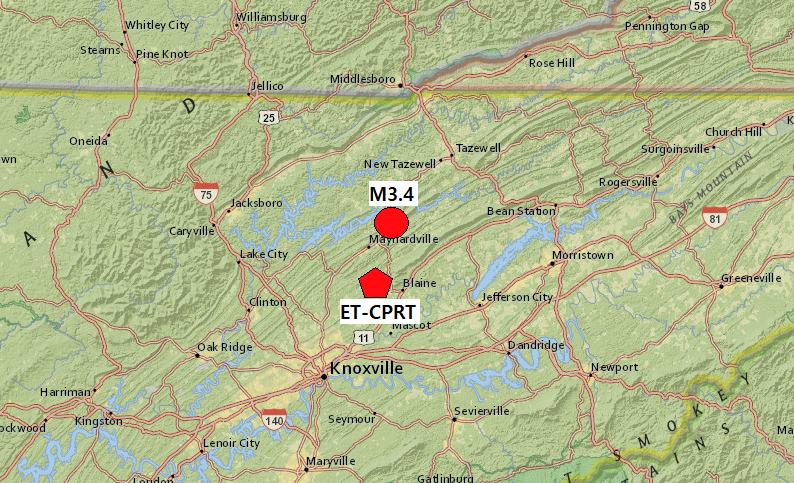 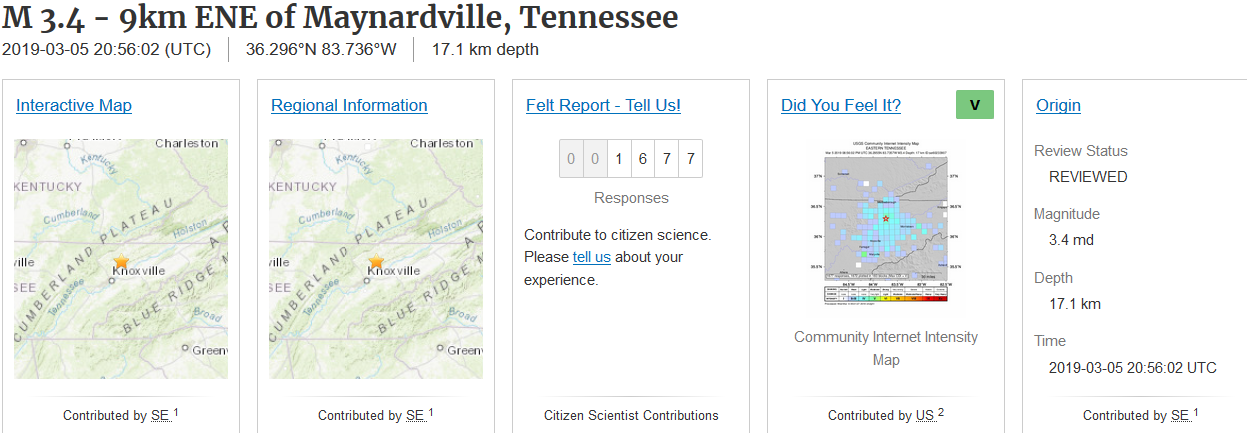 Along with the M4.1 in Poland, a M3.4 struck Tennessee near Maynardville. It struck on March 5, 2019 at 20:56UTC at 17.1km in depth. Tennessee does see earthquake activity but even more so lately. Remember, on December 12, 2018 at 9:14UTC a M4.4 struck near Decatur, Tennessee at 7.9km in depth. So why is there such an increase in activity lately? Now the first image above shows the location of the M3.4 at 17.1km in depth in relation to the closest seismic station. The 2nd image is the USGS event page for this earthquake. Although this was a deeper M3.4, how the heck was it felt so strong? 1,677 people reported feeling this to USGS! And that is only the people that decided to send a report to USGS! WOW! I believe that is the most people I have ever seen for a DYFI report for a M3.5 or below! Below are the top magnitudes recorded by the seismic stations around the area: 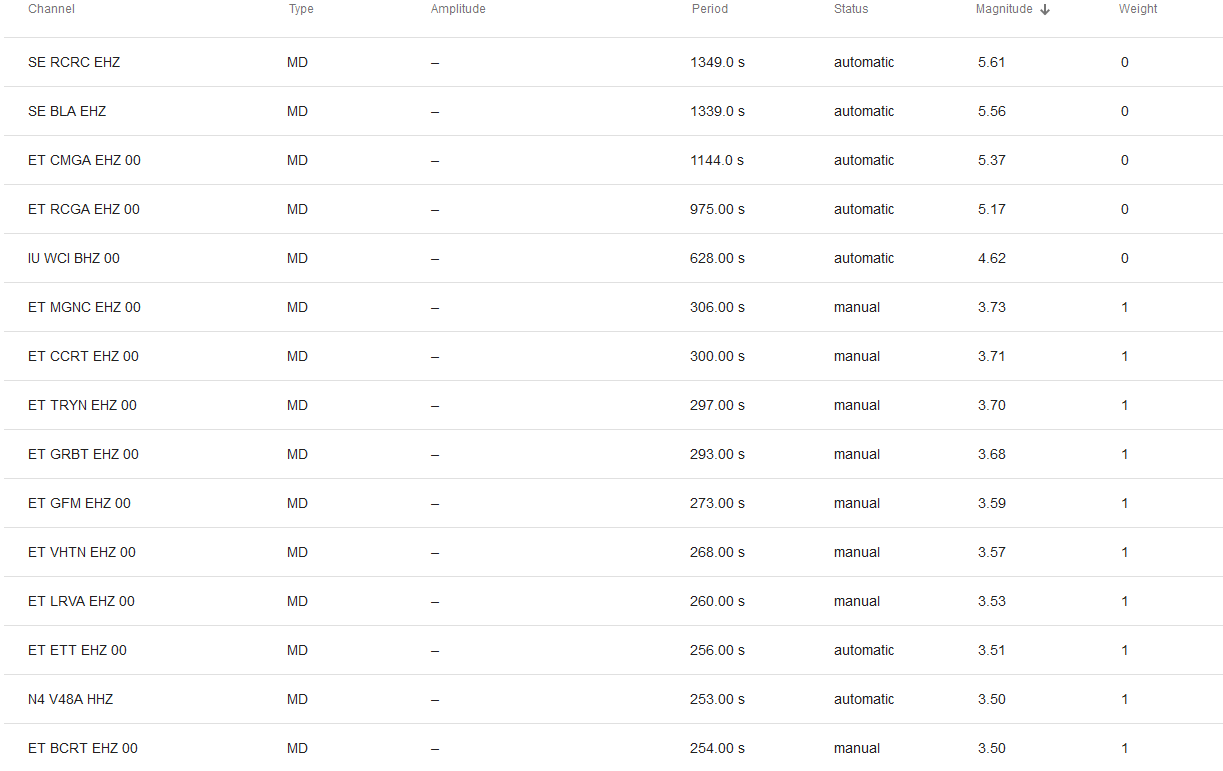 Below I will show the helicorder of this event from the closest seismic station along with an image showing 3 incremental 3-plot images of this earthquake. As always, please remember to read chart labels and captions beneath any images. 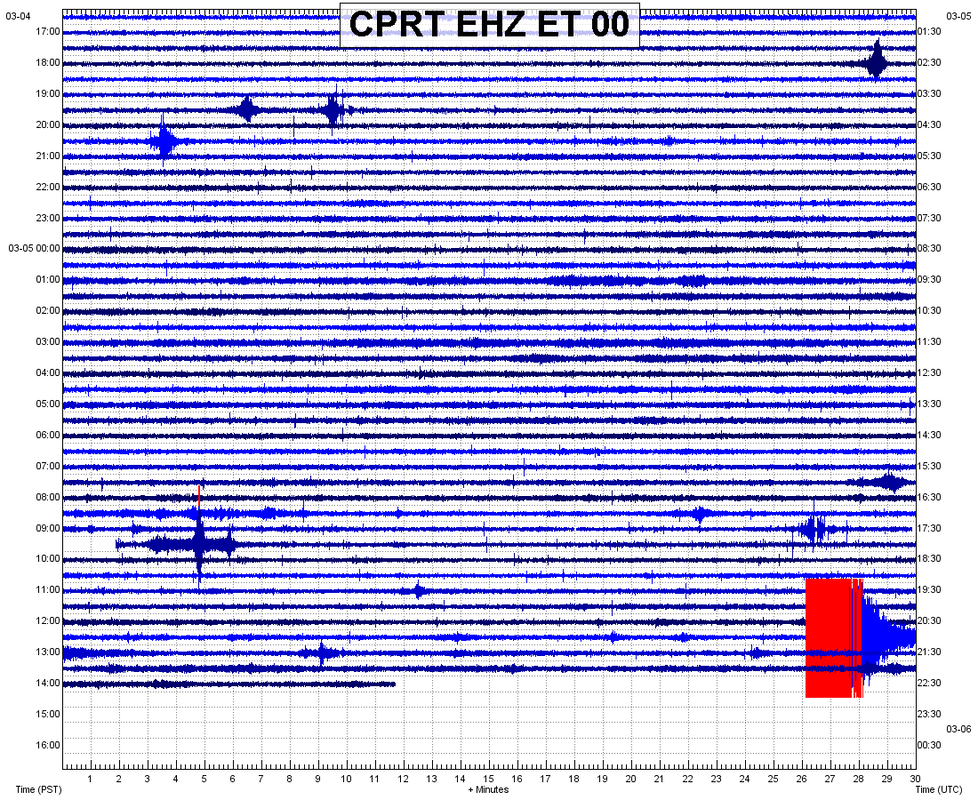 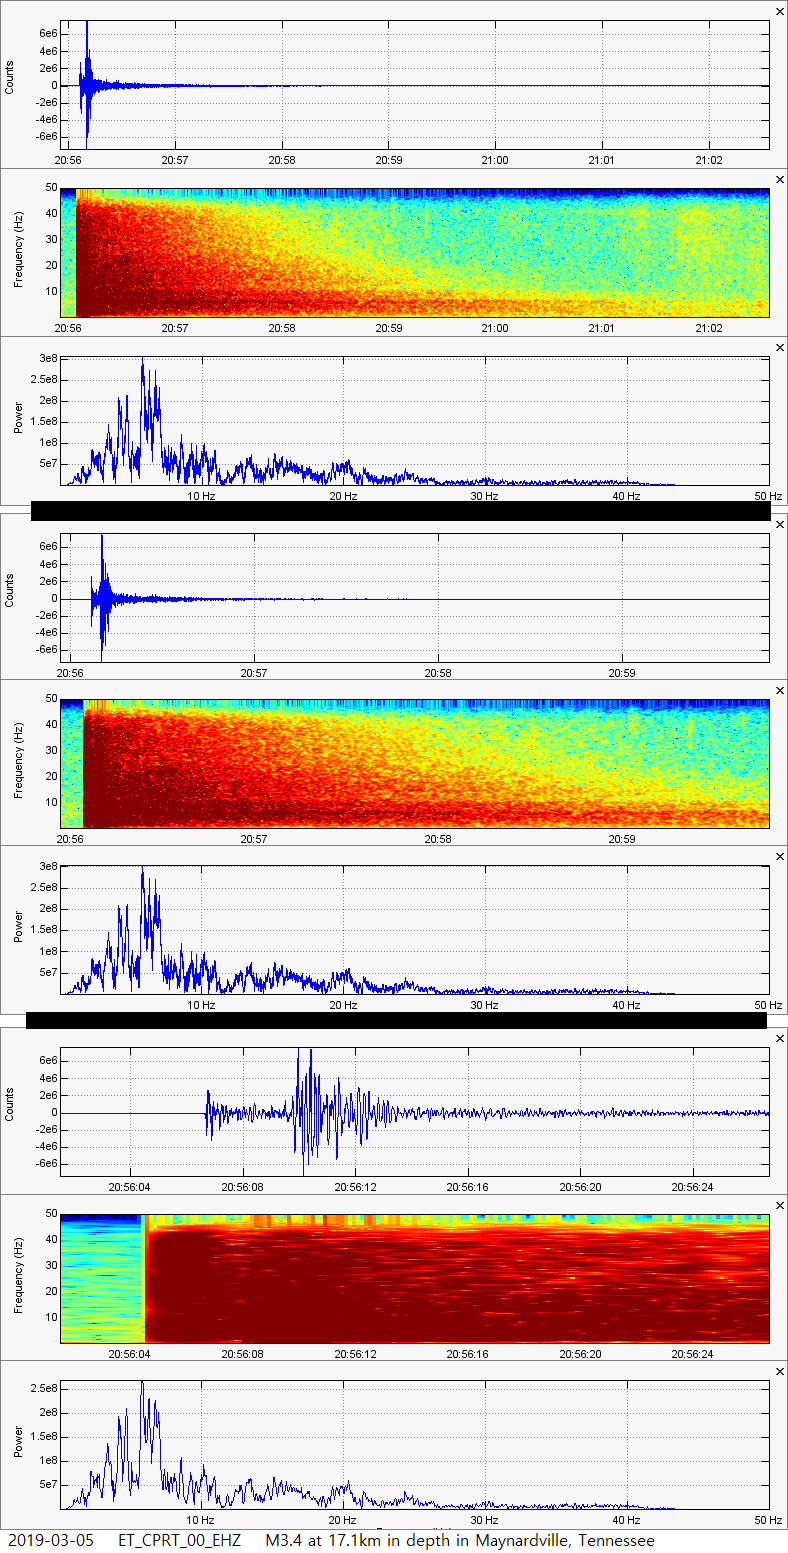 This shows 3 "zoomed in" looks at this M3.4 in Tennessee. Notice it looks extremely strong for a M3.4, not to mention the higher-than-normal DYFI counts! Steamboat Geyser erupts again! 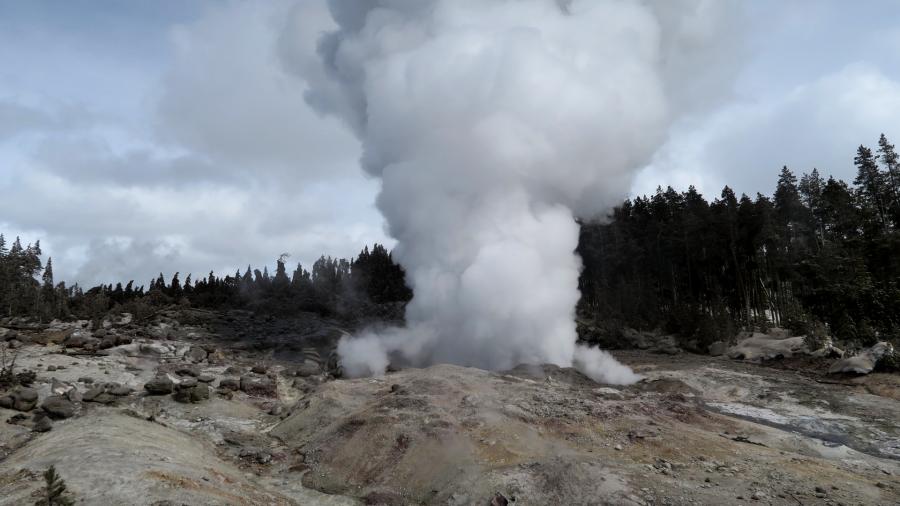 Steamboat geyser in the steam phase of eruption on March 16, 2018, just a day after the first water (hydrothermal) eruption of 2018. Photo taken by Behnaz Hosseini. The infamous Steamboat Geyser, which resides in the Norris Geyser Basin at the Yellowstone super-volcano, erupted for the 8th time of 2019 (the 40th time since it reactivated in early-2018) on March 5, 2019 (just before midnight on March 4 if you live in Mountain or Pacific Time Zones). First off, if you would like to see the seismic plots and images to every single Steamboat Geyser eruption of 2018, then please CLICK HERE. If you would like to see the seismic plots and images to every single Steamboat Geyser eruption that has occurred so far in 2019, then please CLICK HERE. So this most recent eruption was the smallest Steamboat Geyser eruption ever recorded on seismic station YNM, the station closest to Steamboat Geyser. Station YNM resides inside the Norris Museum and is basically only a few yards or so away from Steamboat Geyser. When the Steamboat eruptions were far stronger in 2018, the surface vibrations of the eruptions would also show on station YNR which resides a few miles away from Steamboat. Since late-2018 to now, the Steamboat eruptions are far too small to appear on seismic station YNR............. Until today! As you will see below, the 8th eruption of 2019 was the smallest ever recorded! However it appeared on seismic station YNR! How is that possible if the eruption was too weak and the previous weak eruptions never appeared on YNR? I have no idea. But let's check out the data, shall we? Remember to always read chart labels and any captions beneath any images. Lets show the two helicorders first in slideshow format. Although helicorders found on my website here are usually generate by me, these were generated by the University of Utah. Note on YNM you can see the seismic trace of the Steamboat eruption almost near the middle of the chart. It may be somewhat hard to see since it was quite weak. Now switch to YNR real fast... Notice the trace looks like it appeared on YNR at the same exact time as the trace on YNM? I didn't want to just go on that, since it is not good to only use helicorders or webicorders for research. So lets take a look at the plots. 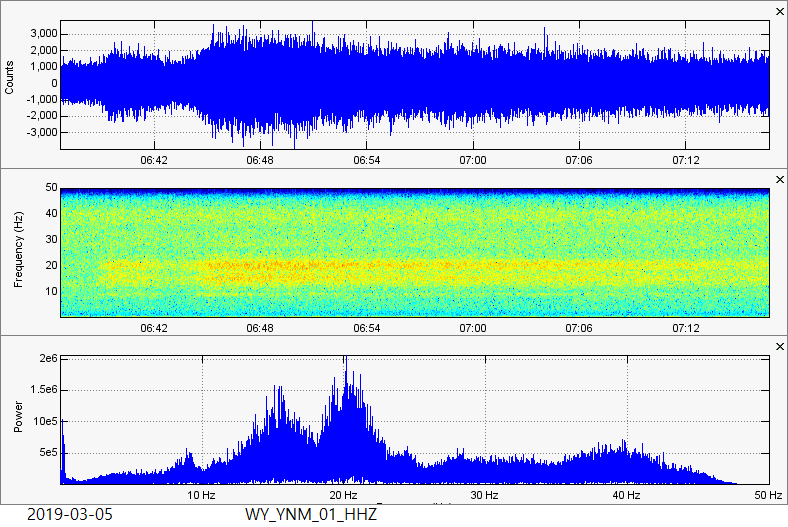 Note that the 3-plot image above is of the 8th Steamboat eruption of 2019, as shown from station YNM. Please note the first burst in the eruption around 6:38UTC (time mark not shown, but you can see 6:38UTC is where the first burst started). Now the main eruption burst started somewhere around 6:45UTC or so. Please keep the pattern of the spectrogram (the colorful plot in the middle) in mind as you look at the plots below. 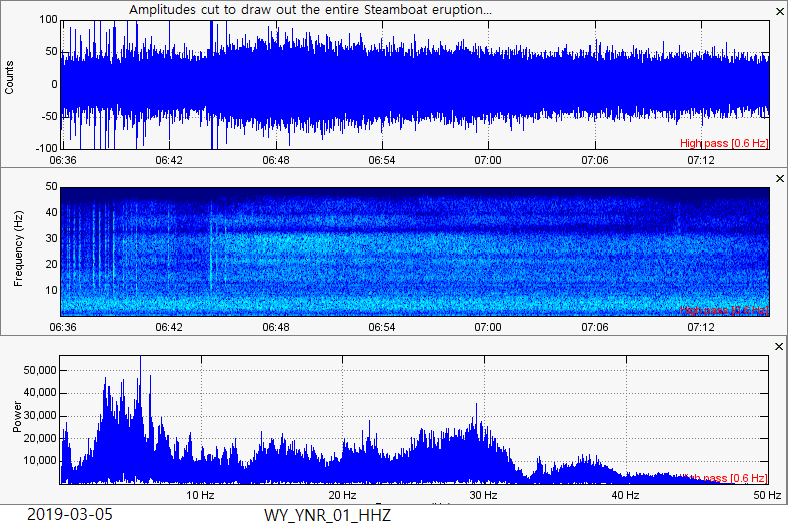 Holy crap! YNR really did capture the 8th Steamboat eruption of 2019! How is that possible if the surface waves were too weak? Regardless, you can clearly see the same exact pattern on YNR as you saw on YNM. Not only on spectrogram can you see the pattern, but on the seismogram plot as well! 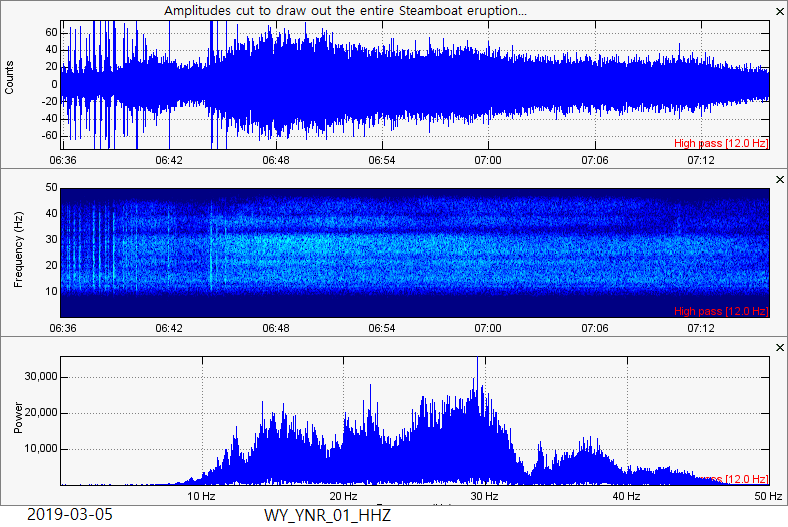 Now this 3-plot image is filtered with a 12Hz high pass filter. This will show only the Steamboat eruption. Well, except for the strange spikes at the beginning. We can confirm that YNR did for sure detect the Steamboat eruption on March 5, 2019. The amplitudes are extremely tiny, yes, but it detected it nonetheless. So why do you think this was possible? All of the other weaker eruptions didn't even show! Below I will show this 3-plot image along with the 3-plot image from YNM. I will put it in slideshow format so you can compare the two.
0 Comments
Leave a Reply. |
AuthorBen Ferraiuolo is a fast learner and someone who will always stand for the truth. Visit "About Me" for more! Archives
November 2019
Categories |
 RSS Feed