 Hey guys I am back once again! Sorry it has been a while since I have put out a blog post. Life has been pretty crazy and busy lately and as time goes on my YouTube videos and blog posts may slow down. Do not fret! I will always still be around. But in order to advance my career in seismology, there will be times in the future where I do not post any content. However if anything major occurs worldwide, and especially in the United States, just know I will report it as soon as I can. Well there was a M3.3 earthquake in Texas reported recently along with another M3.0. Although the station is some distance away, this earthquake should have shown higher frequencies than what we saw. But this earthquake seemed to have low frequency characteristics, with another event about an hour or two prior that was smaller but carried the same characteristics. So why was that event not reported? Also, about 6 hours or so prior to the M3.3, there were some interesting low frequency events. One did look like a mine blast but the others are likely not to be mine or quarry blasts. There was also a M2.2 earthquake that struck in Massachusetts on the east coast of the USA that contained some very high frequencies. What does all this mean? I don't know. But the activity in Texas reminds me of some deep magma movement, most likely deeper than 5-8km, but that is just my theory. So it is nothing major but I will present the data and you be the judge. There was also a strange M5.5 in SE Africa not too far from Mayotte. There was also a very peculiar M2.5 chemical explosion at the Oroville Dam in California. What could it be caused by and why would there be any major explosions at a dam??? Just as always, please click the title of this post or "read more" to continue... Texas M3.3 and Unreported Seismicity 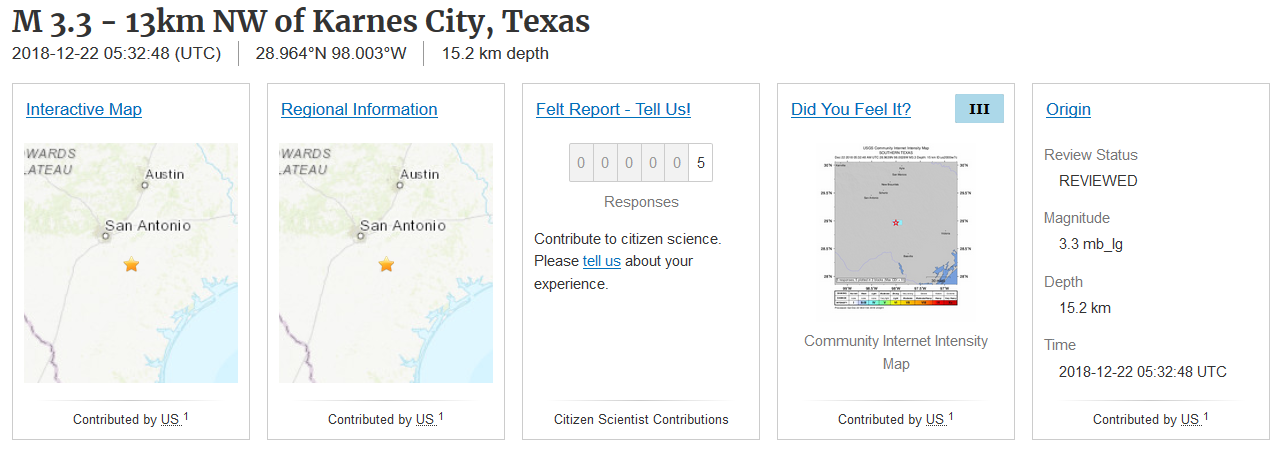 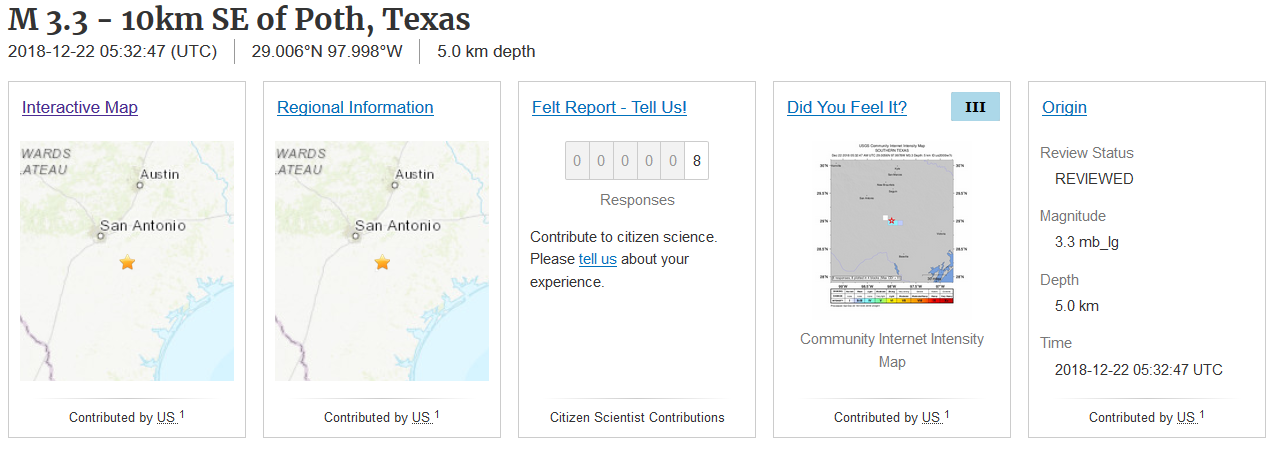 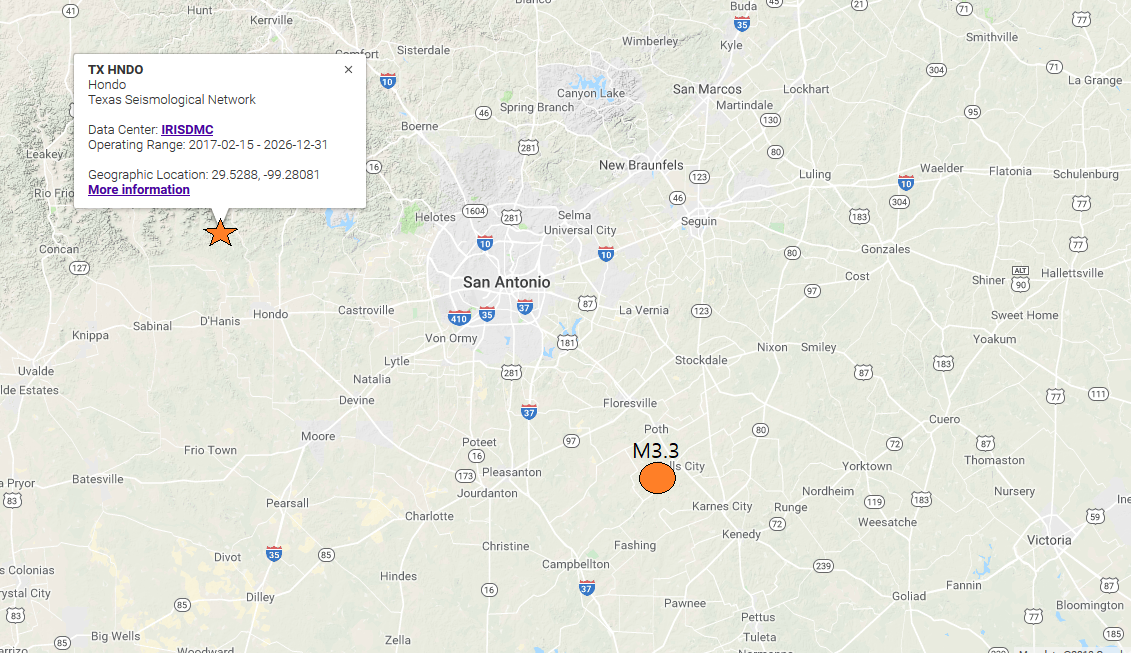 On December 22, 2018 at 5:32UTC a magnitude 3.3 earthquake struck SE of San Antonio, Texas at a reported depth of 15.2km. The first image you see above is the event page for this earthquake as of about 6:00UTC (same date). Notice how already there have been 5 people that reported feeling this earthquake. Now the 2nd event page you see is the updated version. They changed the depth from 15.2km to 5km and they also slightly changed the location. As you will see below, this earthquake was preceded by multiple unreported events. One does seem like a quarry or mine blast but the rest do not seem like quarry or mine blasts. All of these events shown below, including the reported M3.3, do have dominant low frequencies. Remember magma can cause high frequency events, yes, but most of the time you see a long duration earthquake with dominant low frequencies you know that it is likely magma had a hand in creating this event. However there are some other processes that can create these. It seems like these events were occurring near the same depth and location as the M3.3 and they were not extremely strong. These events near the epicenter most likely had slightly higher frequencies but still remained below the 5Hz line. Regardless of cause, there are some events that were not reported. The third image you see shows the location of the closest seismic station (orange triangle) to the M3.3 and the 3.3 is marked with an orange circle. The M3.0 occurred right near the M3.3, where it is likely the unreported seismicity occurred as well. Although the station is far from the event, it should have showed higher frequencies but it didn't. Is this normal activity for this area or is there some magma flowing around 6-10 miles or so beneath the surface? Remember the roof of the most shallow part of the Yellowstone magma system is around this depth so it is nothing too concerning. However please monitor this area closely if these events start to unfold at a rapid pace. 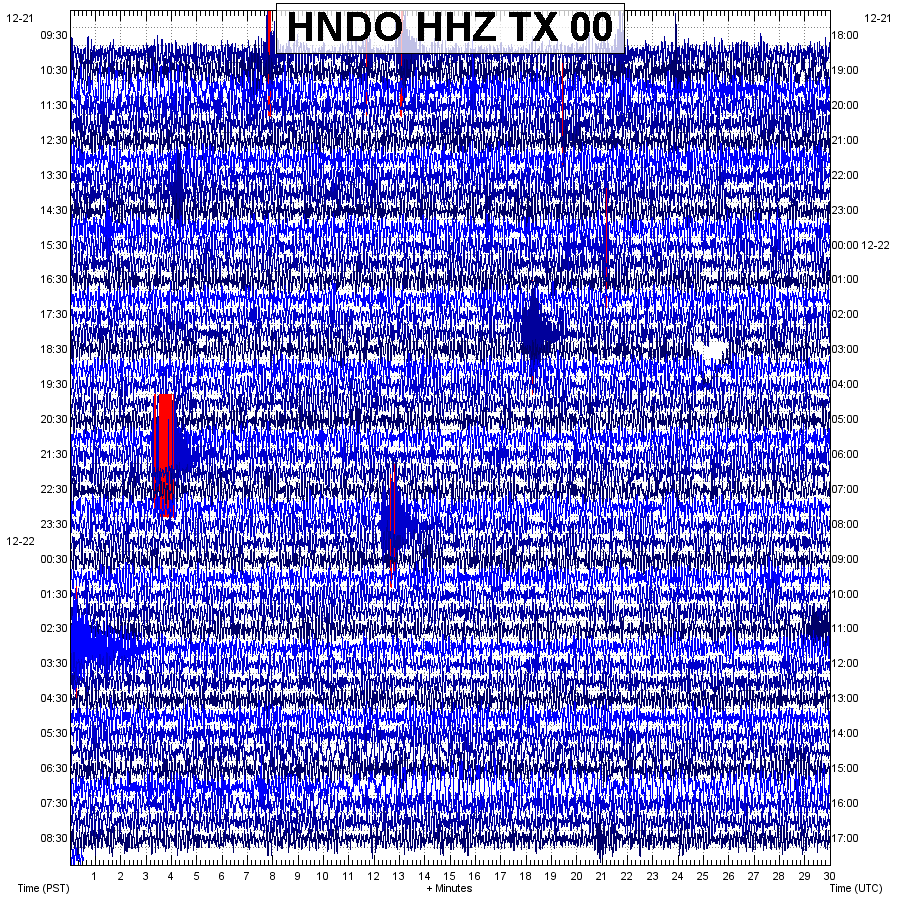 Above you can see the helicorder for the closest seismic station to this event, HNDO. The reported M3.3 is near the middle on the left hand side and the M3.0 is almost just beneath it. You can see other unreported events but know a few of the tiny increases in energy are surface noise. I will show the unreported events below first and then show the reported M3.3 and 3.0. Please remember to always pay attention to chart labels and any captions you may see beneath any images. 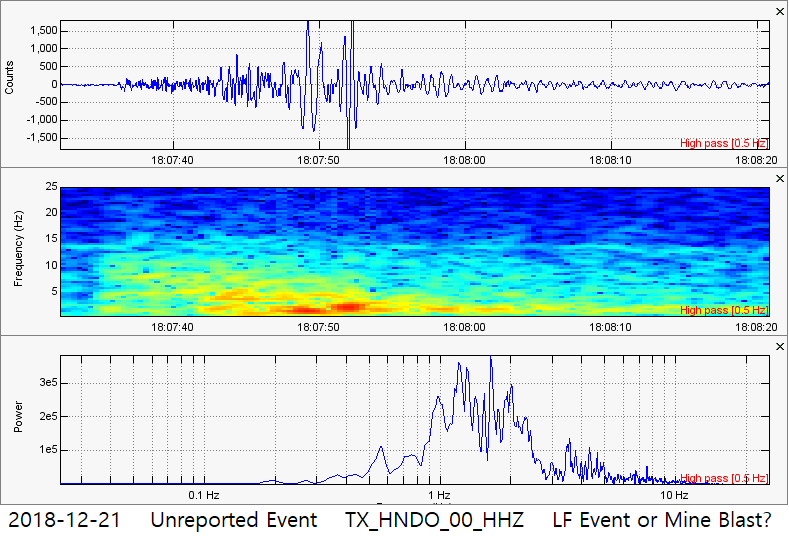 Here is the first unreported event for the time period shown in the helicorder image above this plot. To me, this does appear to be a mine or quarry blast. However, in conjunction with the other seismicity and possible LF events, it is possible this is NOT a mine blast but is related to the ongoing seismicity we have seen the past day or so for this area. But you never know. Notice dominant frequencies between 1Hz and 2Hz. 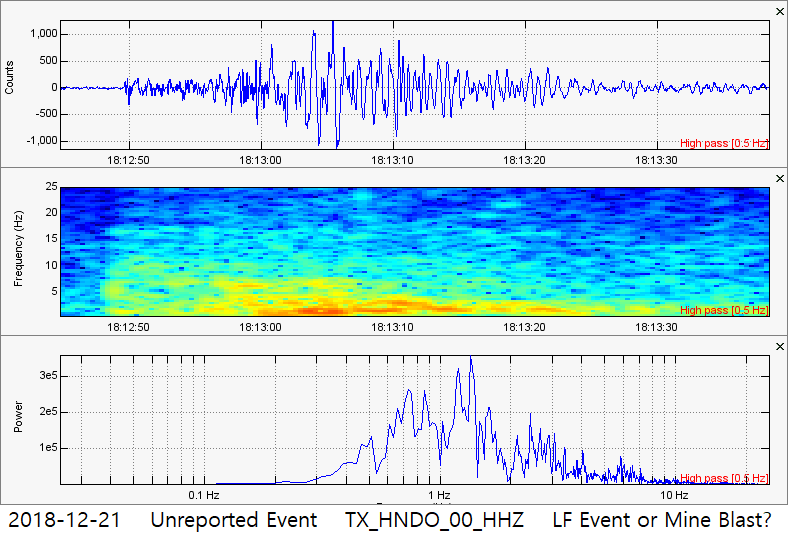 Now here is the next unreported event for most likely the same area as the M3.3. Of course I put out the possibility this could be a mine blast, but I highly doubt it. The characteristics are very similar to the reported M3.3 but the frequencies are slightly lower. Notice dominant frequencies between 0.6Hz and 2Hz. 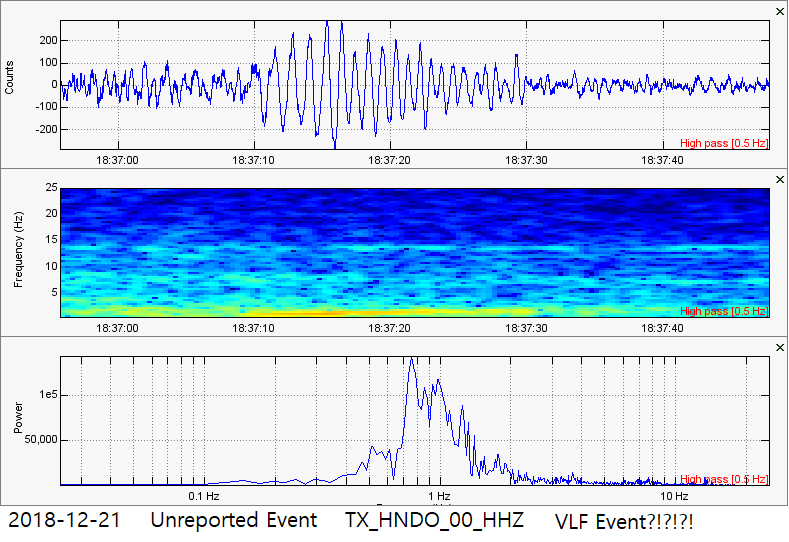 Now this is the craziest event for the time period of the helicorder shown in the beginning of this blog post. Of course the characteristics of this event are different, but the shape of the waveforms almost makes it look like the Mayotte event. But it is nowhere near that. This was most likely a VLF (very low frequency) or a normal LF event (with the lowest frequencies possible) earthquake for this area in Texas. But how the heck could this occur in Texas? Regardless, this was an enigmatic event. Notice dominant frequencies between 0.7Hz and 1Hz. 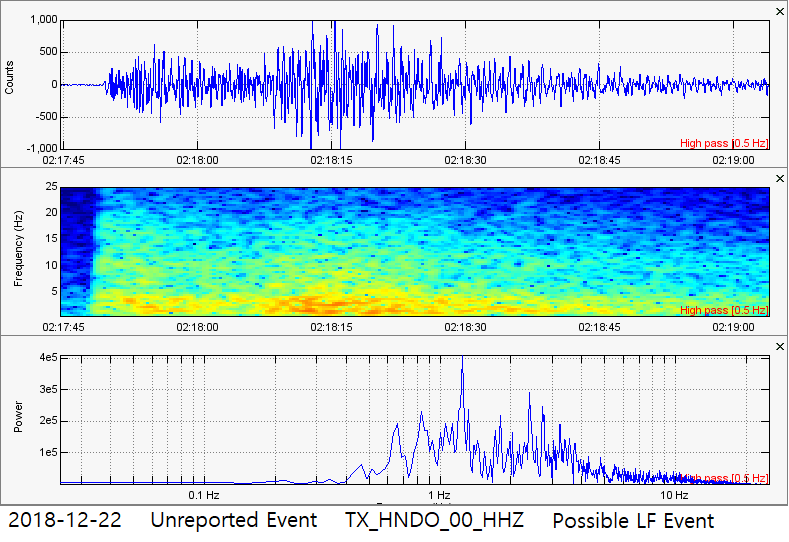 Now this is the last unreported event for this area prior to the M3.3. Notice how there are some strong frequencies reaching to about 4Hz-5Hz but the majority of the strength remains between 1Hz and 3Hz. This earthquake is almost an exact copy of the M3.3 that came after (except that it was about half the strength). So what is going on just SE of San Antonio, Texas? 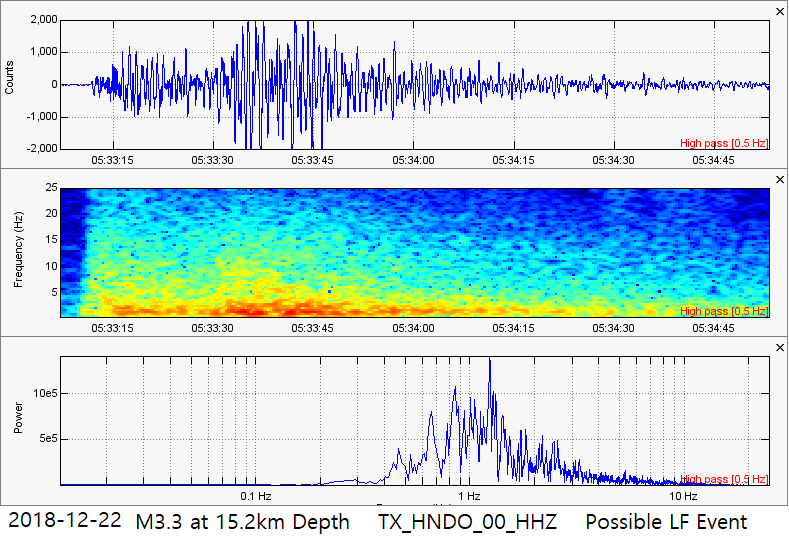 Finally here is the reported M3.3 that occurred at 15.2km (revised to 5km) in depth just SE of San Antonio Texas. Remember times and dates are always in UTC for these plots. This earthquake did occur some distance away from this station, but we should see much higher frequencies than what we see here. Notice this event carries almost the same characteristics as the unreported event just prior. However these events do carry dominant low frequencies between about 0.8Hz and 1.5Hz. So what is going on in Texas? Why are the earthquakes that have been occurring here been occurring at a far lower frequency than what we should see? Could there be some deep magma movement? Or is all as it should be? Regardless of cause, these events are extremely interesting (including the possible VLF event). 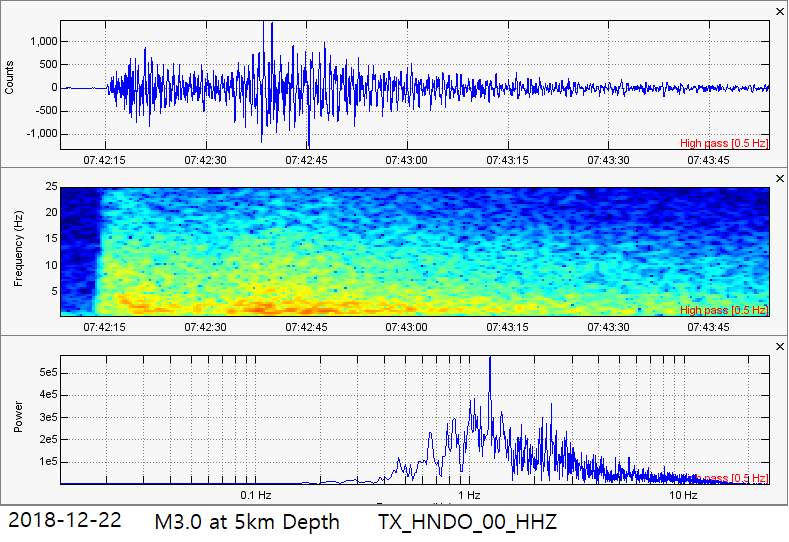 Now here is the next event to occur. It was reportedly a M3.0 at 5km in depth with characteristics almost identical to the M3.3 and a couple of the unreported events. Notice the dominant frequency rests at about 1.4Hz with the strongest frequency range between about 0.8Hz to 3Hz. Is this really another low frequency event? Or is there something in the ground near this station that is filtering out higher frequencies? Who knows. Regardless, these are some very interesting events! 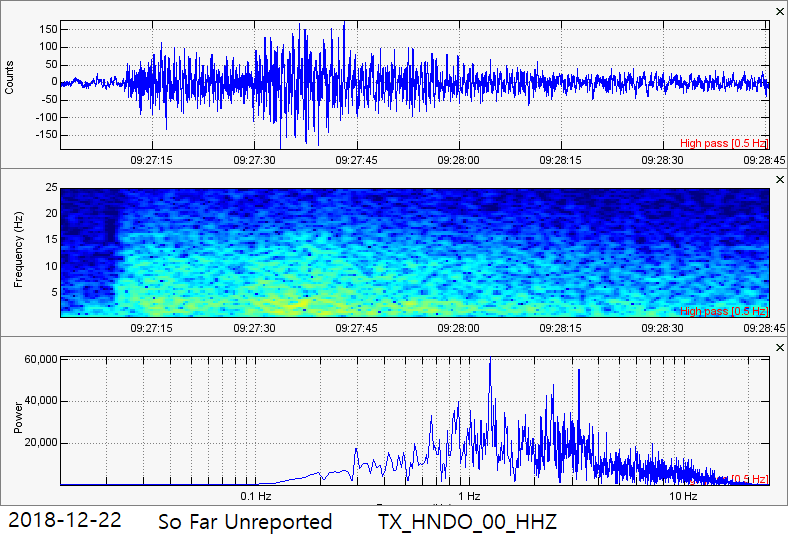 Here is a much smaller event that occurred some time after the M3.3 and M3.0. Notice the characteristics look nearly identical to the reported earthquakes. This one has so far not been reported but is extremely small. During this time period there was some weak low frequency background tremor occurring but it is currently unknown whether that should be occurring or not. I will monitor this area closely in the coming days and will report any more changes. 2 Quakes Strike the East Coast 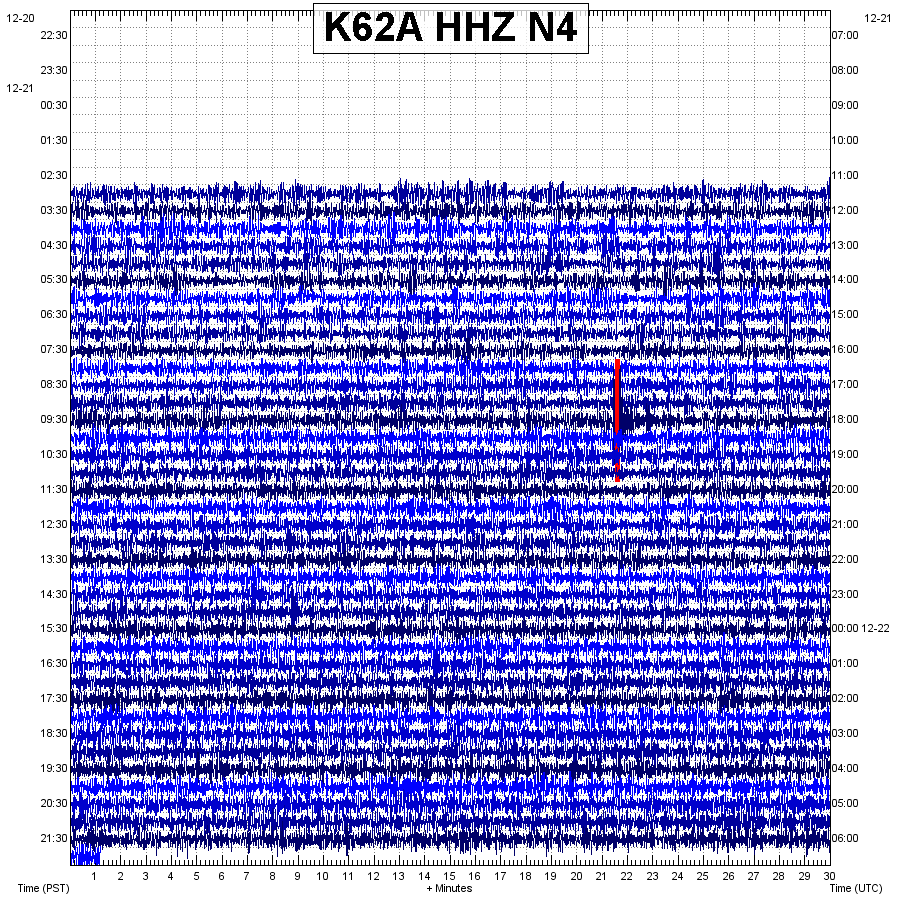 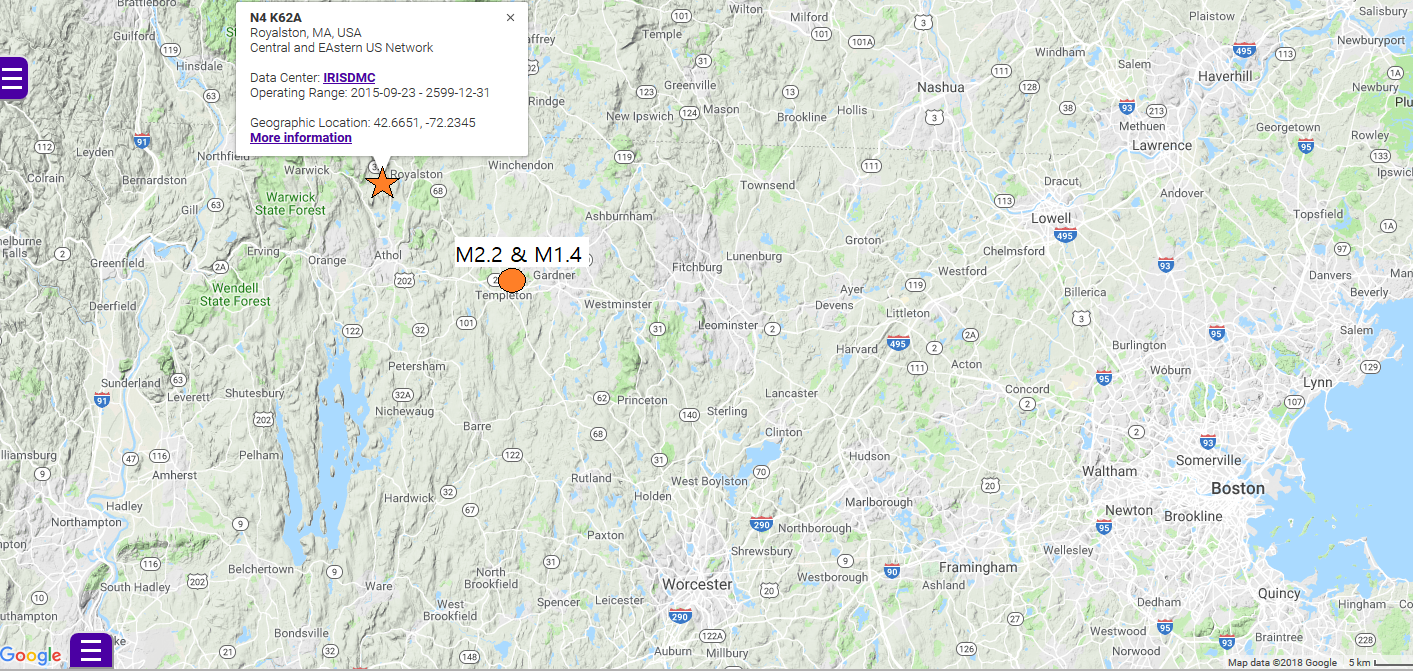 Here is the section of this post for the Massachusetts quakes that occurred near the same time the seismicity in Texas was occurring. The first image you see above is the helicorder for the time period of the 2 quakes and for the closest seismic station to these events: K62A. The second image you see shows the location for the closest seismic station in regards to the 2 earthquakes that occurred. The 2 earthquakes struck pretty much in the same location. Below I will show the event page for each quake along with the seismogram/spectrogram/spectral plots. Remember to always pay attention to chart labels and any captions beneath any images. 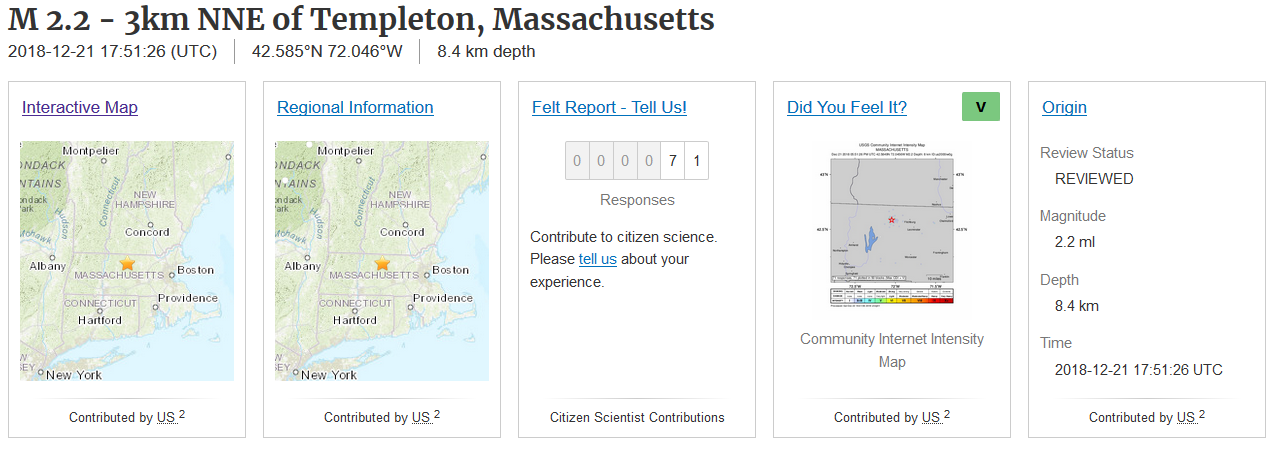 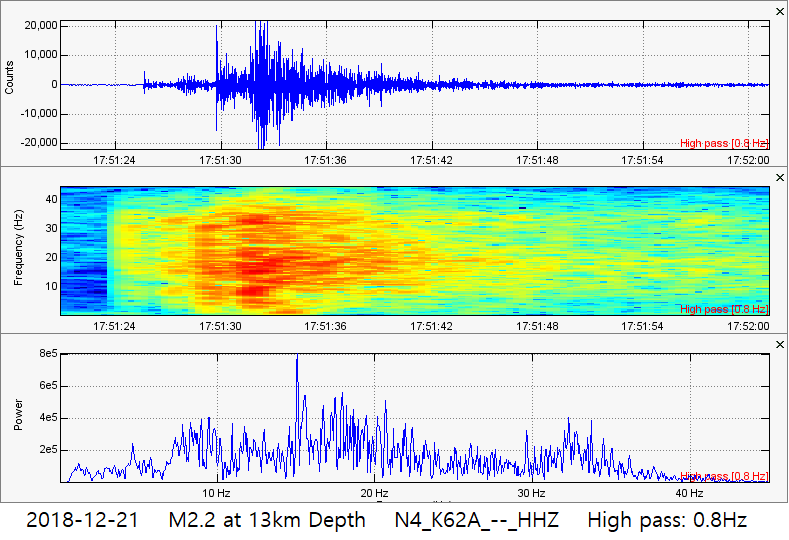 Here is the event page and appropriate plots for the M2.2 in Massachusetts which struck at 13km in depth (later revised to 8.4km in depth) on December 21, 2018 at 17:51UTC. Notice how over 71 people reported feeling this earthquake! And remember those are only the people that decided to report feeling it to USGS, not the actual number of people who felt it. Notice the plots are slightly different. I had to extend the frequency range to 45Hz on the spectrogram and spectral plots simply because this event had some very, very high dominant frequencies. This one was a very weird earthquake. Notice the strongest frequency seems to be about 15Hz but the dominant frequency range extends from about 15Hz to about 23Hz. No wonder so many people felt it! I also wouldn't be surprised if people also heard this event. Who knows, maybe this is another mystery boom (if indeed this was heard as a boom). 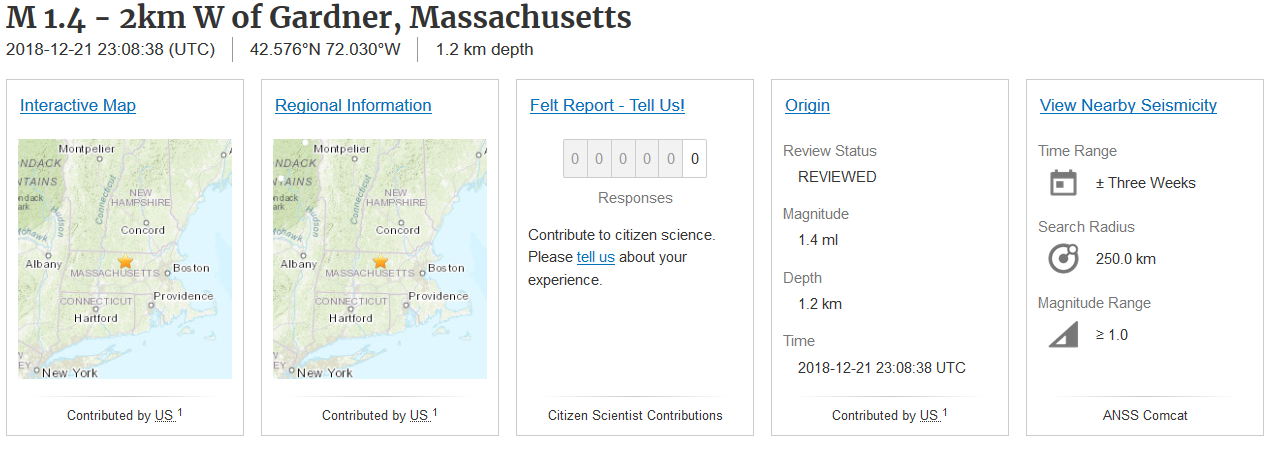 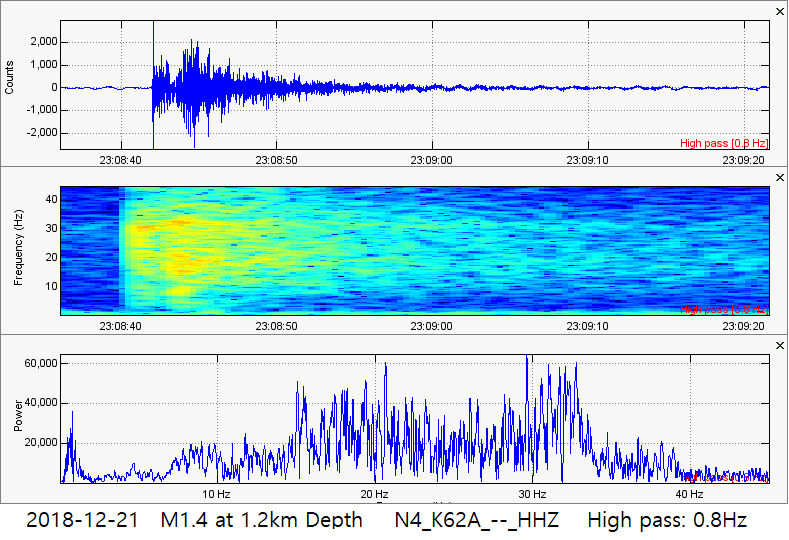 Here are the plots and event page for another earthquake that struck near the same area just a few hours later. It was reportedly a magnitude 1.4 earthquake striking at a very shallow depth of 1.2km on December 21, 2018 at 23:08UTC. Notice I extended the maximum frequency range on the spectrogram and spectral plots to 45Hz. This earthquake carried some pretty high frequencies as well. Notice the dominant frequency range of this earthquake appears to be around 15Hz to 34Hz. It is strange because for both of these earthquakes, they were quite weak below 10Hz or so. What process caused these two events? I don't know but I would love to find out! Strange Explosion at Oroville Dam in CA 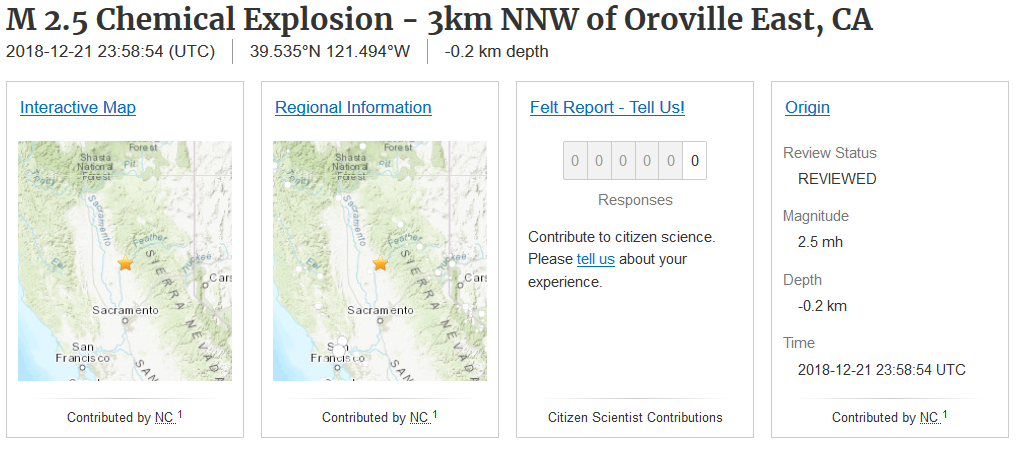 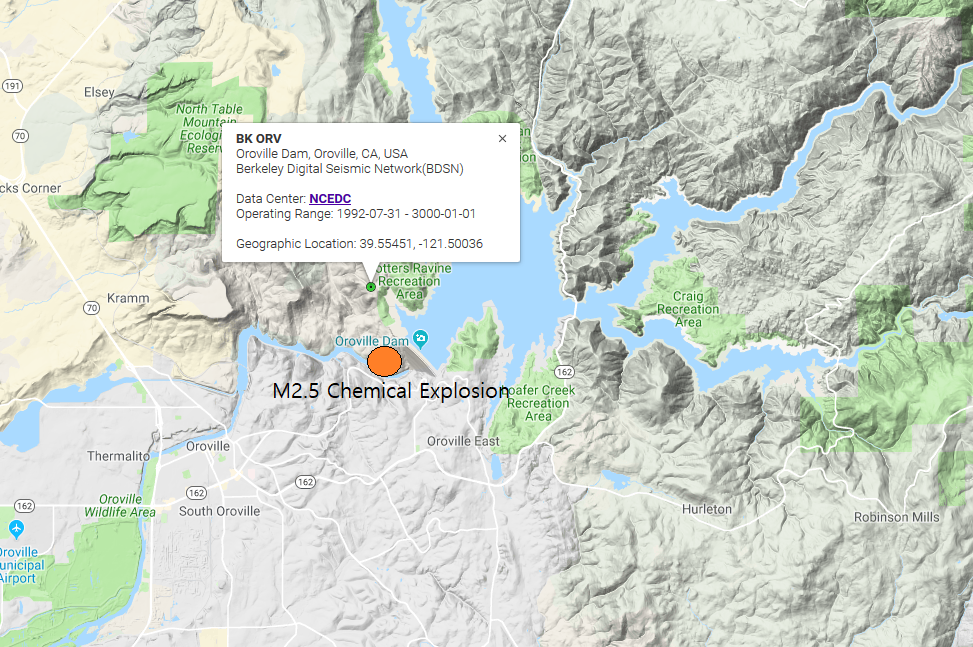 On December 21, 2018 at 23:58UTC, a very peculiar magnitude 2.5 chemical explosion occurred right behind the Oroville Dam in California. The first image you see is the event page by USGS. Notice nobody reported feeling it. So why was there an explosion at the Oroville Dam? Why would there ever be an explosion this large right here? And also how could USGS tell the difference between a chemical explosion and a normal explosion? The second image you see shows the closest seismic station to this peculiar M2.5 chemical explosion. Notice the explosion occurred directly behind the dam. So what is going on here at Oroville Dam? I have seen tiny explosions reported there before but this is the largest by far! As you will see in the plots below, this was an extremely weird event! I am still scratching my head about this. 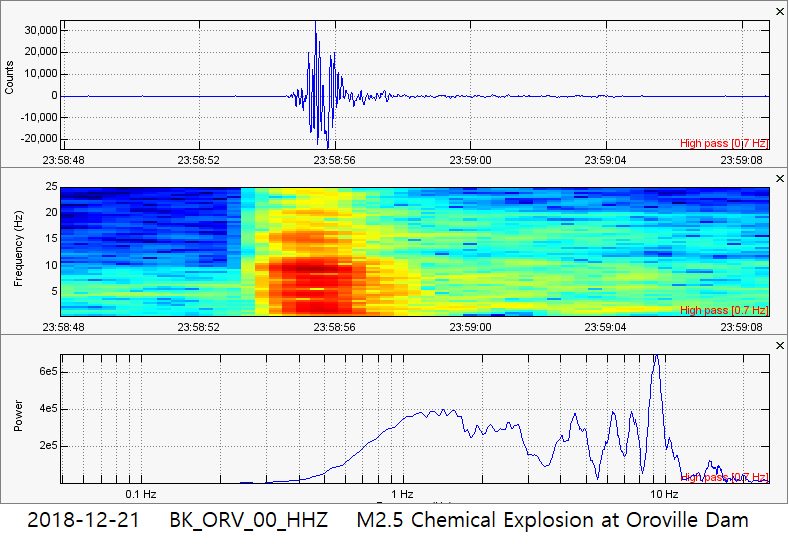 Check this out! This was again reportedly a M2.5 chemical explosion at the Oroville Dam in California. Something that doesn't make sense is how long this event lasted. It was a 2.5, yes, but it only lasted about 5 seconds or so. It was extremely short lived and contained some absolutely odd characteristics. What event could even cause something like this? And why would there be chemical explosions this large occurring at a dam? Very odd... M5.5 Strikes Africa's SE Coast near Mayotte 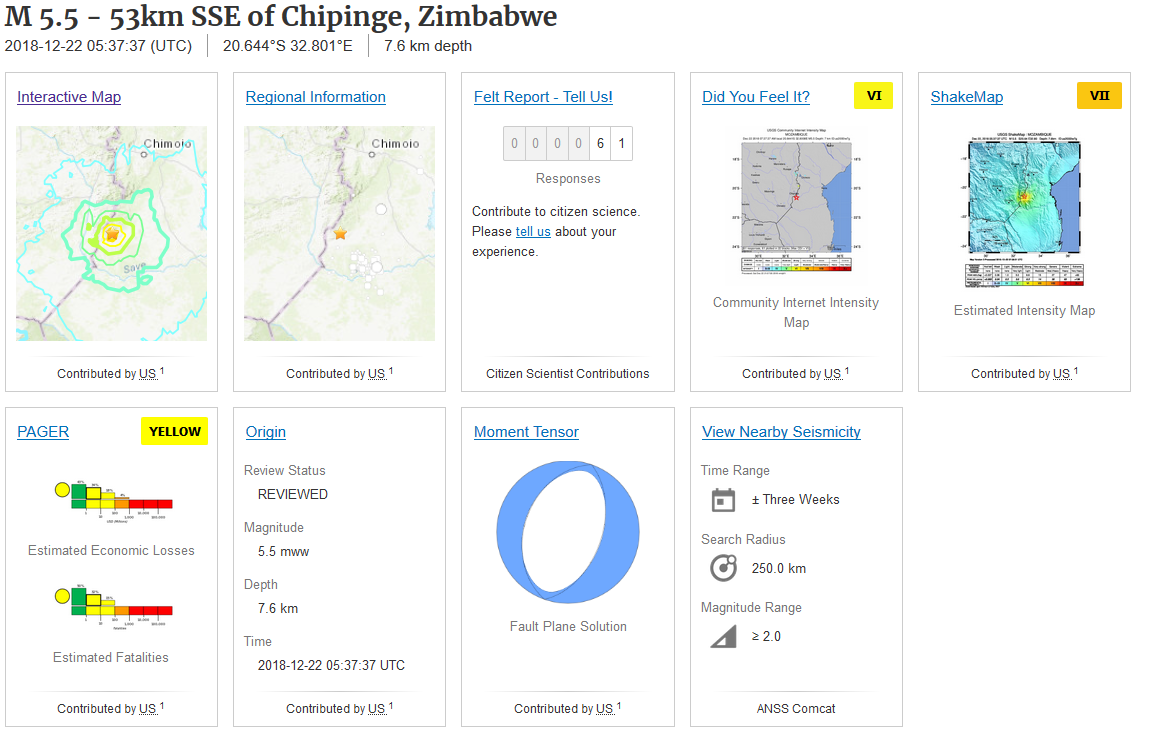 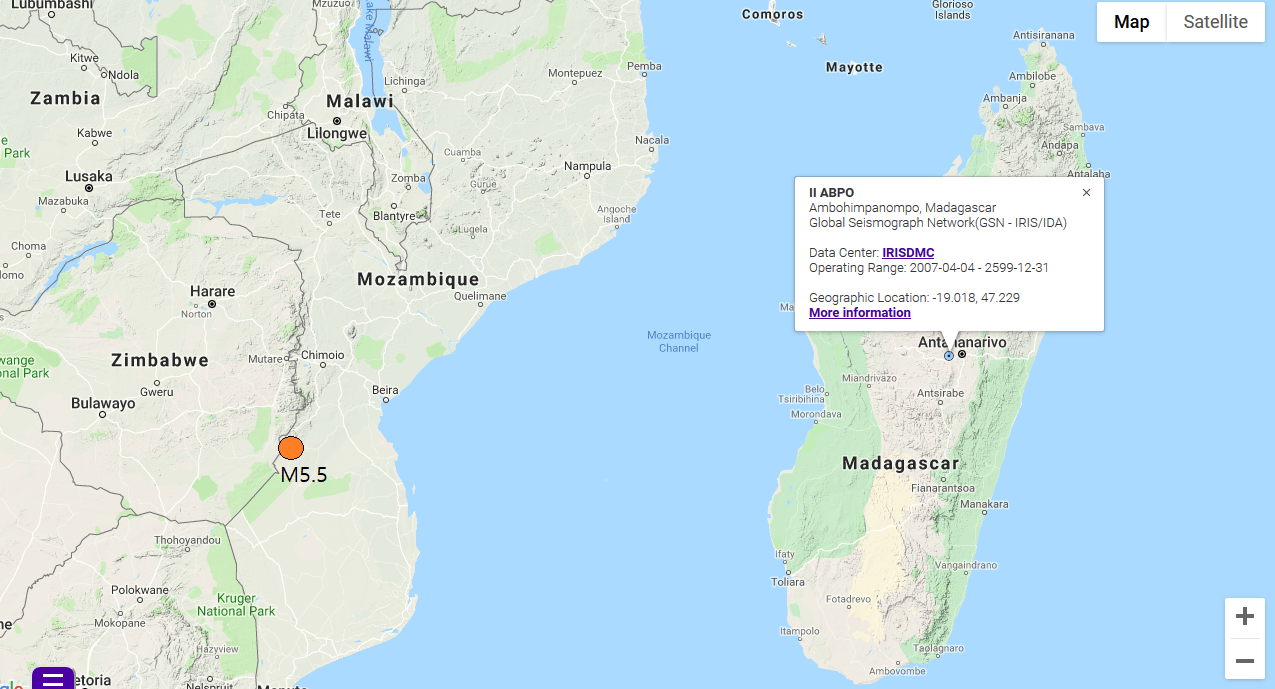 On December 22, 2018 at 5:37UTC a magnitude 5.5 earthquake struck at a shallow 7.6km in depth on the border of Zimbabwe and Mozambique in the SE portion of Africa. The first image you see is the event page by USGS. You can see 61 people have already reported to USGS that they felt this event. It was quite strong and probably scared the crap out of the people living in this area. The second image you see shows the location of the M5.5 in respect to the seismic station I used to generate the plots below. This earthquake occurred not too far from Mayotte (the location of the recent seismic mystery Nat Geo talked about). This earthquake also contained some very strong, very low frequencies that reminded me of the low frequencies put out by the mysterious Mayotte event. I will show the plots to the M5.5 below. Please remember to always pay attention to any chart labels and any captions beneath any images. 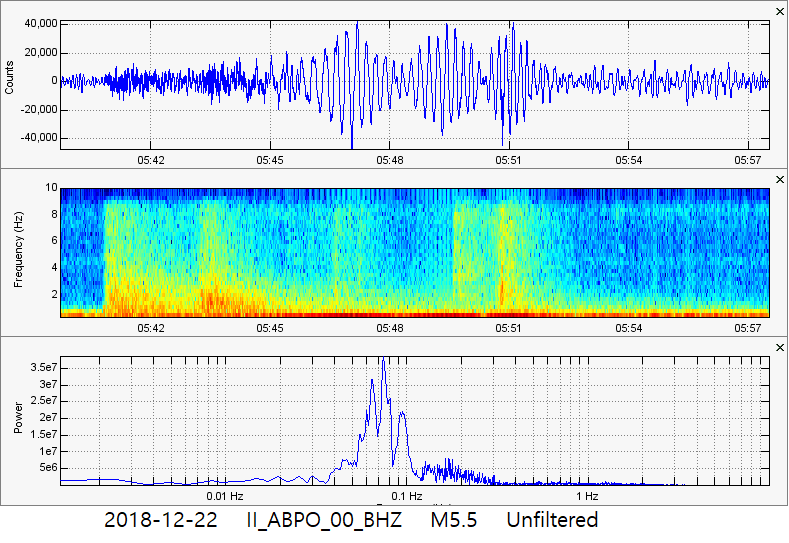 Here is the M5.5 and a possible aftershock. These plots are completely unfiltered so you can see all frequencies. I did this to show you the strongest part of this earthquake carried dominant frequencies around 0.074Hz which is extremely low, even for a station this far away. Of course the station is some distance away, as you can see above, but it should not be showing such low frequencies. This earthquake reminded me greatly of the Mayotte event that stumped seismologists worldwide. This M5.5 also occurred somewhat near Mayotte. Could this be connected to the same process that caused the Mayotte event? Maybe... Let me know what you think! 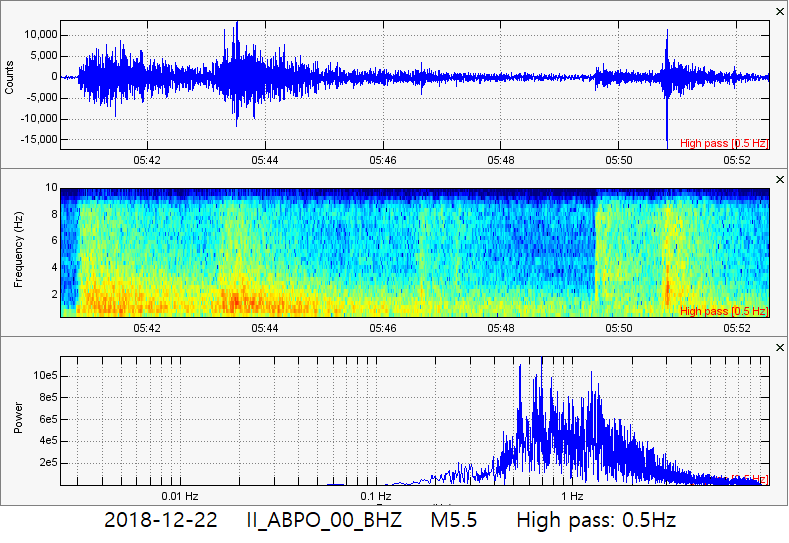 Here is the same M5.5 from the same exact station except the lower frequencies were filtered out using a 0.5Hz high pass filter. Notice the M5.5 but also a possible aftershock at the end of the plots. The dominant frequencies here are between 0.5Hz and 2Hz. So what is going on all across the world lately? It seems the past day or so there have been some peculiar events. Please join me in monitoring these areas and use my website here to teach you how to do it. I hope you all have a wonderful Christmas and God bless!
1 Comment
Amy
12/22/2018 05:17:46 pm
12-22 around 2008 and 2025 UTC might be two unaccounted for events as well. Leave a Reply. |
AuthorBen Ferraiuolo is a fast learner and someone who will always stand for the truth. Visit "About Me" for more! Archives
November 2019
Categories |
 RSS Feed