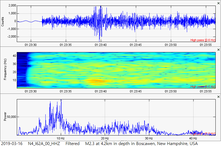
 Hey guys. If you follow my work, then you probably have realized I have been mostly absent the past few days. Don't worry! I am still around! Life is just getting busier and some other things have to take priority. However I am still actively monitoring volcanic areas and checking recent quakes so anything major that occurs will definitely be reported. In this post I am going to quickly show some data pertaining to 2 earthquakes that occurred today. A M2.3 in New Hampshire and a M2.2 in Texas. As usual, please click the title of this post or "read more" to continue... M2.3 in New Hampshire 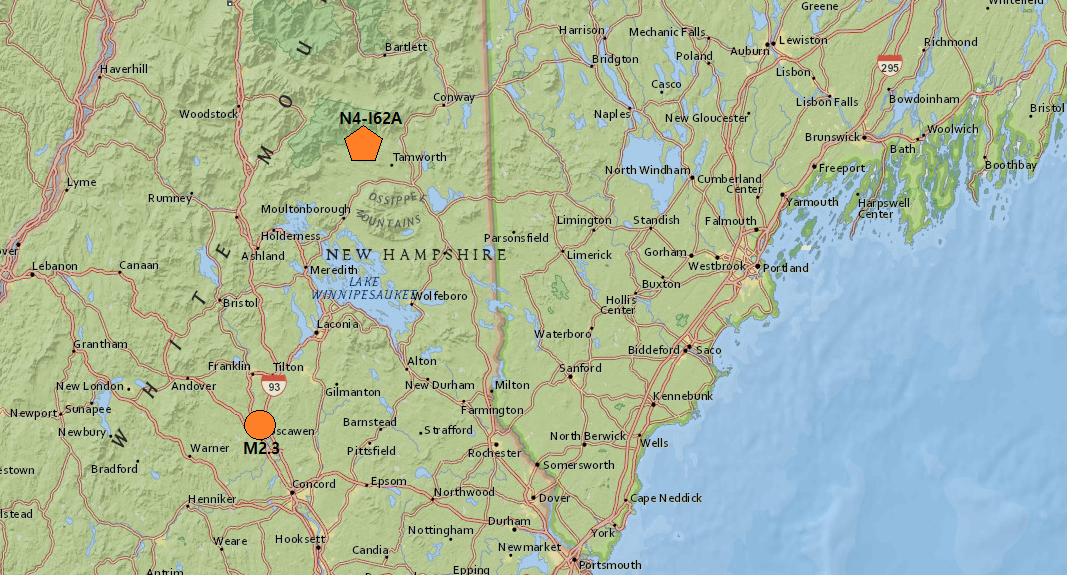 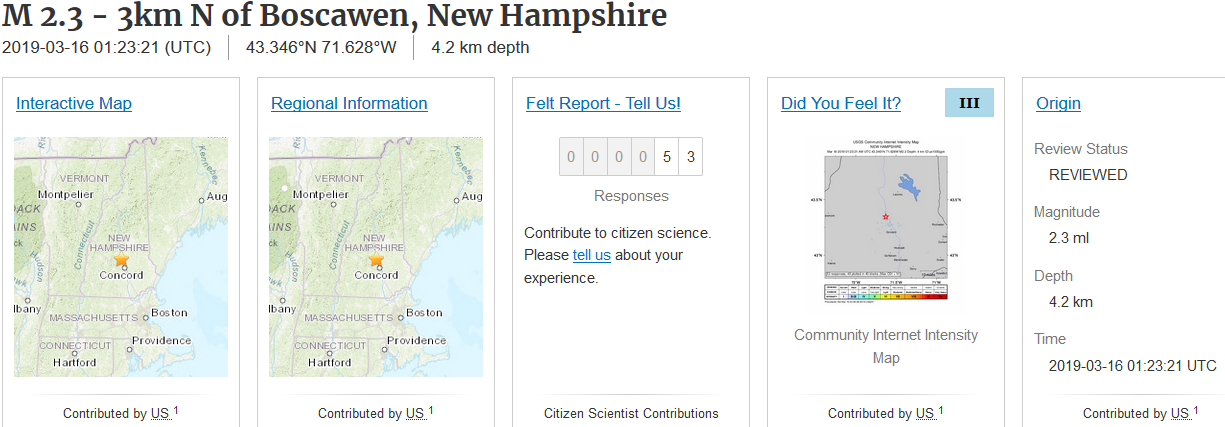 On March 16, 2019 at 1:23UTC, New England, specifically Boscawen, New Hampshire, was shook by a M2.3 earthquake at 4.2km in depth. This area does see some seismicity from time to time but it is worth mentioning whenever swarms or single earthquake events occur in this area. The first image above is the location of the M2.3 in relation to the closest seismic station: I62A in the N4 network. This will be the station used for the following plots. The second image you see is the USGS event page for this M2.3. Note over 53 people felt this event! Remember, that is only the number of people that reported feeling this to USGS. It is likely many more people felt it. That is a good amount of people for a simple M2.3! As you will see in the plots below, this does seem like a normal tectonic event. However, I am unsure of what fault this event took place on so that theory could be very wrong. For the following plots, remember to always read chart labels and any captions beneath any images. 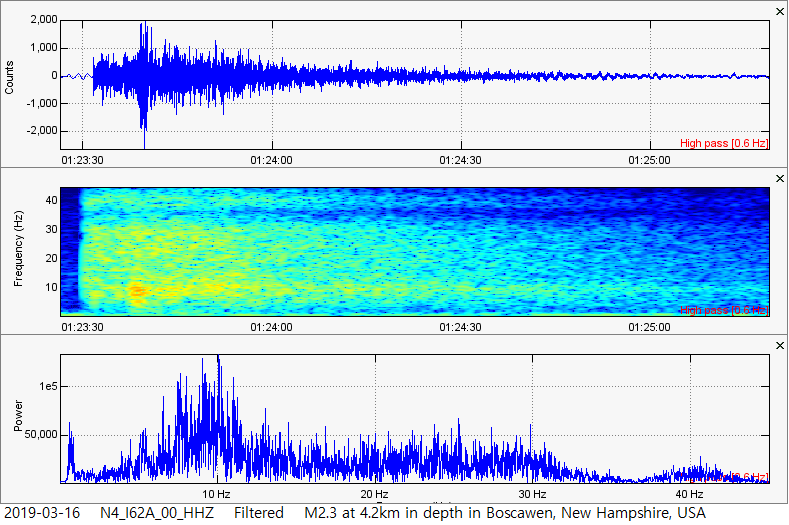 Note the frequency extent on the spectrogram is 45Hz. A 0.6Hz high pass filter was also added to remove the background microseisms. 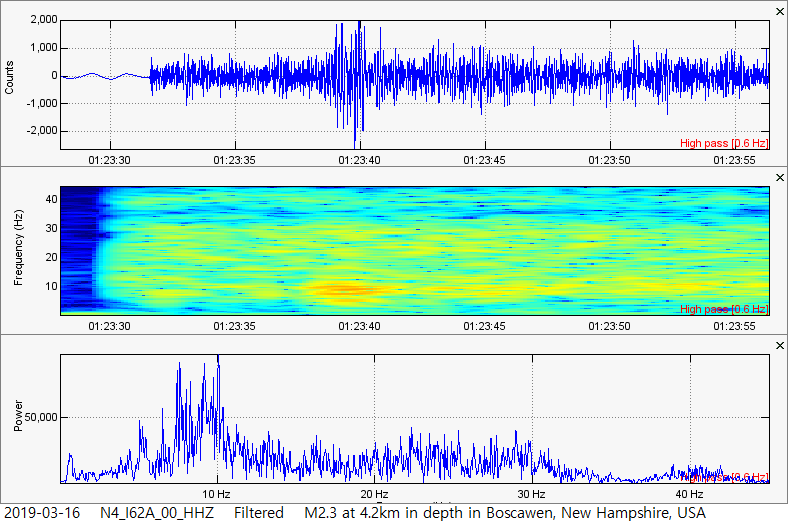 This is the same event as shown above, however "zoomed in". Also note the frequency extent on the spectrogram is 45Hz. A 0.6Hz high pass filter was also added to remove the background microseisms. M2.2 in Texas 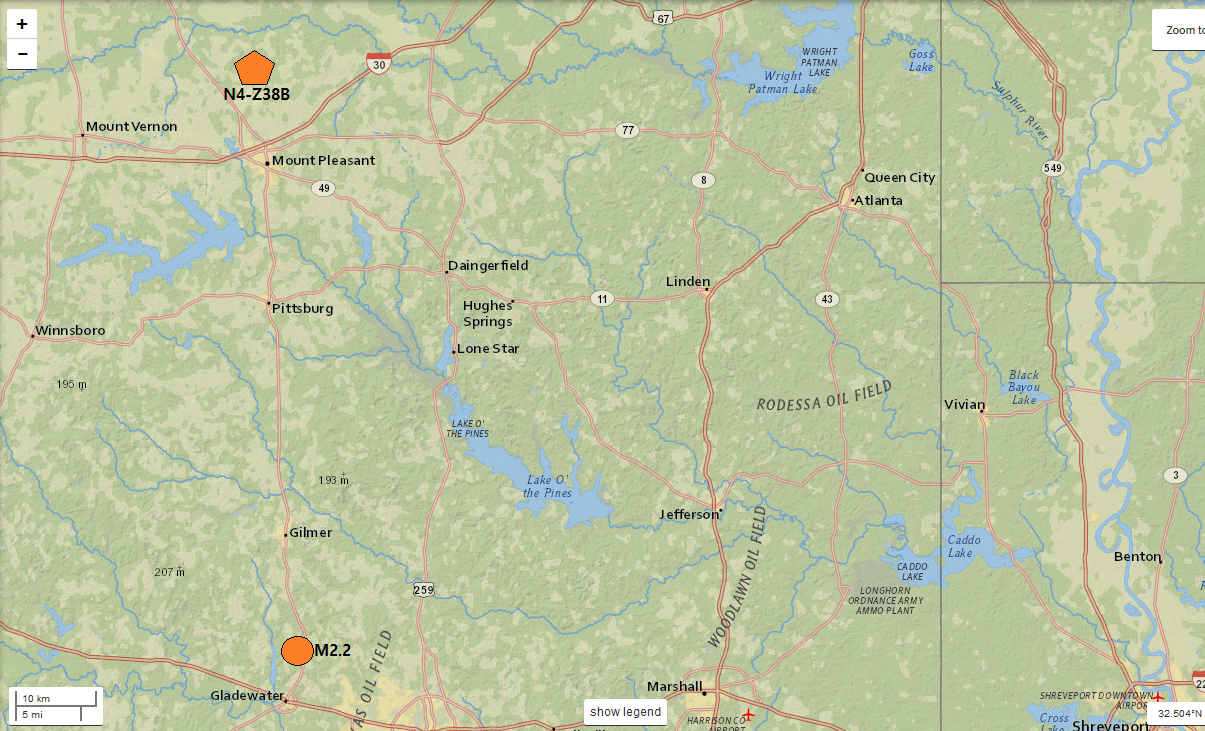 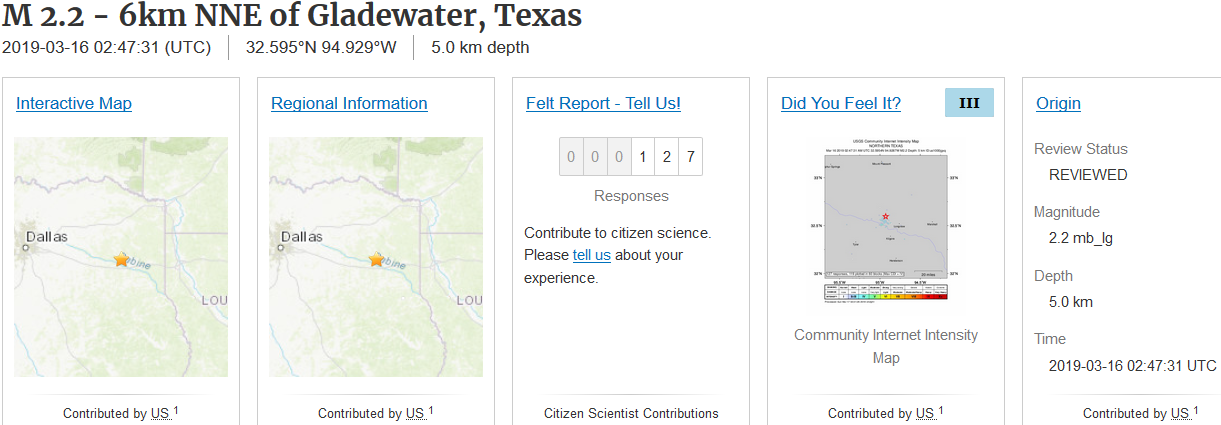 Sadly the closest seismic station, according to USGS, is roughly 20 miles to the north. However it still detected this event quite well. This was a M2.2 earthquake at 5.0km in depth on March 16, 2019 at 2:47UTC, roughly just 1 hour and 24 minutes after the M2.3 struck New Hampshire. Surprisingly, this was a strong M2.2! It was reportedly felt by many more people than the M2.3 in New Hampshire. Over 127 people reported feeling it! Wow! Remember, those are only the felt reports, not the actual number of people that felt it. I have looked into this earthquake and it seems strange. It is possible two events occurred near the same location near the same time or this really is just one earthquake. However, as you will see in the plots below, it does look like there was a possible secondary increase in energy. This was the only seismic event during this day for this location. It was a lone wolf. But then again, what caused this earthquake? It doesn't look like USGS has any faults labeled in the area but you never know! I will continue to keep an eye on this area via the few stations around the epicenter. For the plots below, always remember to read chart labels and any captions beneath any images! Sorry this post was quick, but I will be back soon! If you ever need any additional information or plots from additional stations, please do not hesitate to shoot me an email. I can create custom plots or charts for you when I have the time. 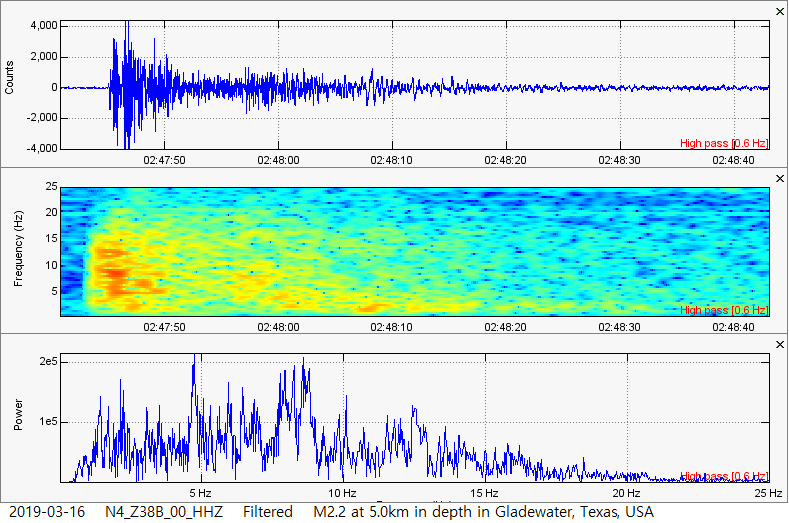 Amplitudes were slightly cut to draw out the smaller ones. Also notice how, just before the 02:48:00 mark, there appears to be a secondary increase in energy? I doubt these are just the surface waves, although they do contain surface waves from the initial event. Either this really is showing 2 events, or I really am having trouble picking the correct wave arrivals. Who knows. Lemme know what you think! 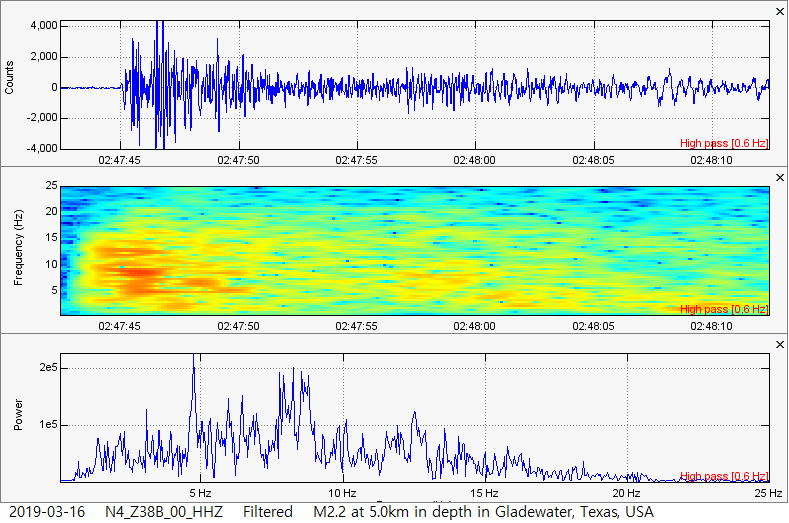 This is the same M2.2 as shown above, however "zoomed in". Also, amplitudes have been slightly cut to draw out the smaller ones.
1 Comment
Kate
3/20/2019 11:06:13 pm
Ben, Leave a Reply. |
AuthorBen Ferraiuolo is a fast learner and someone who will always stand for the truth. Visit "About Me" for more! Archives
November 2019
Categories |
 RSS Feed