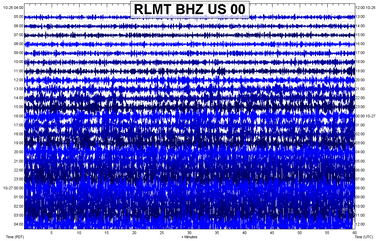
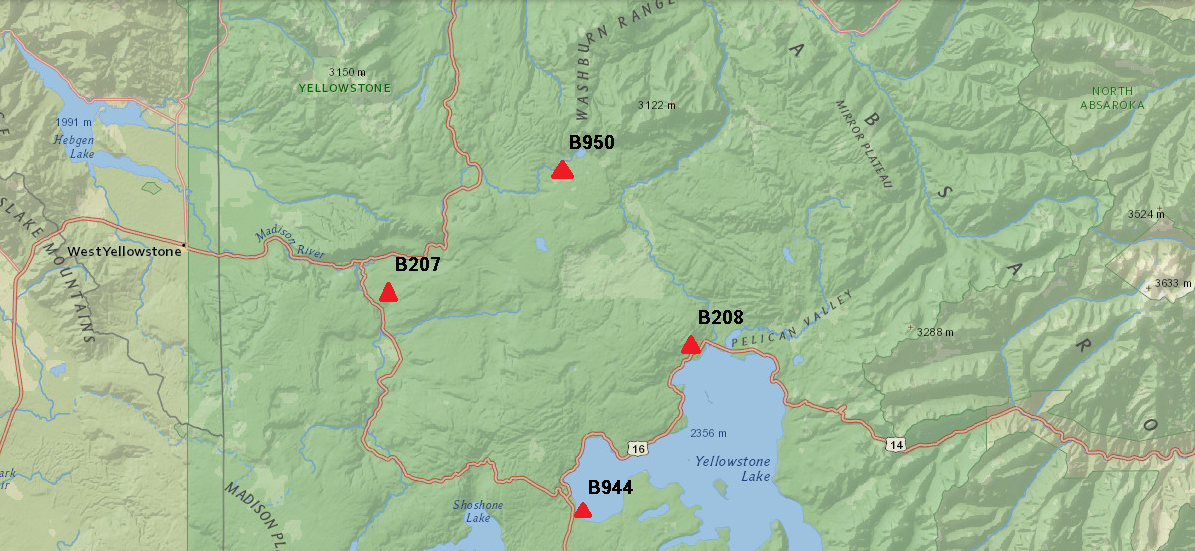
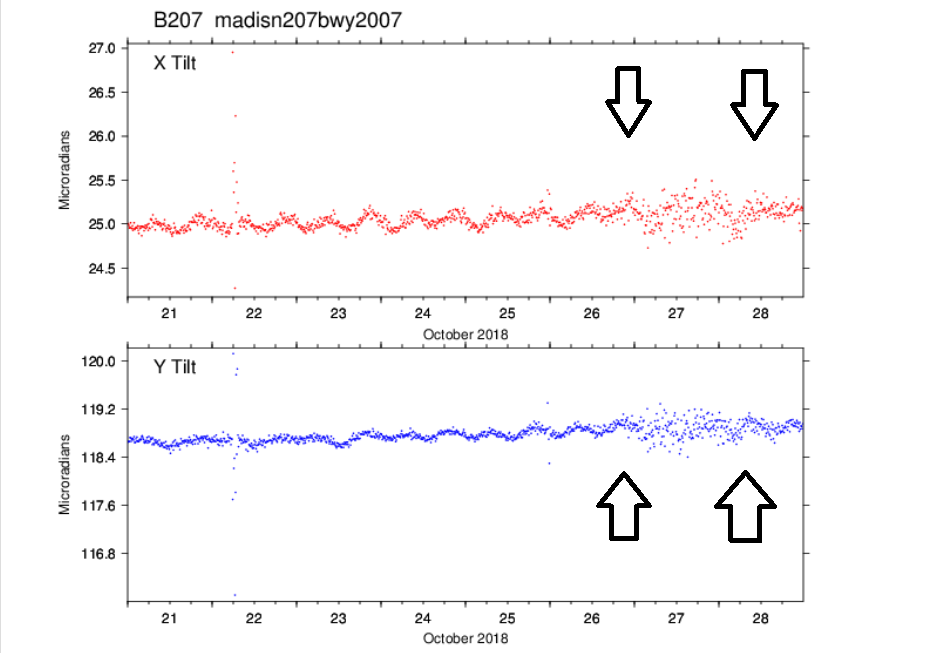
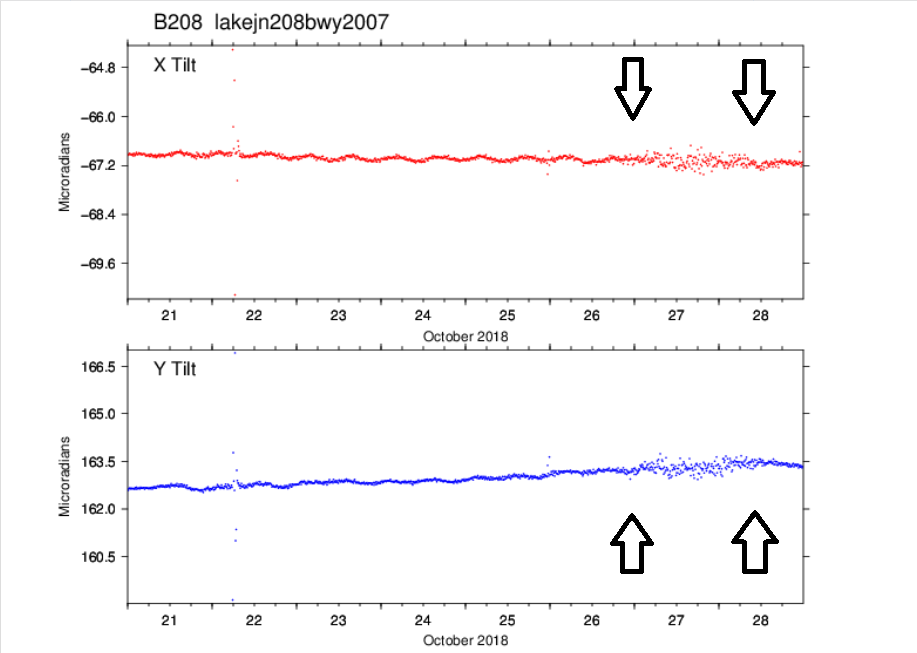
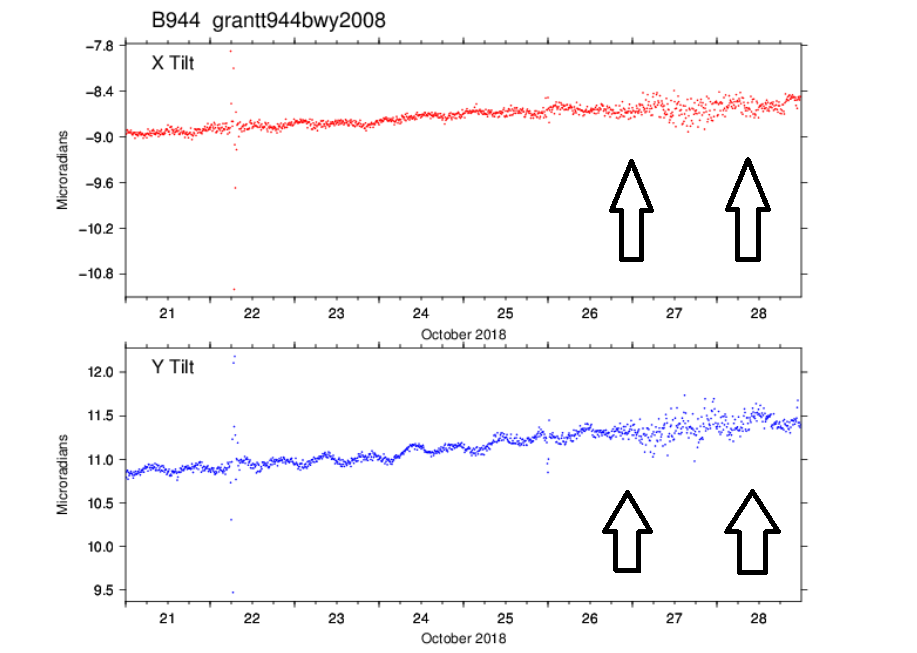
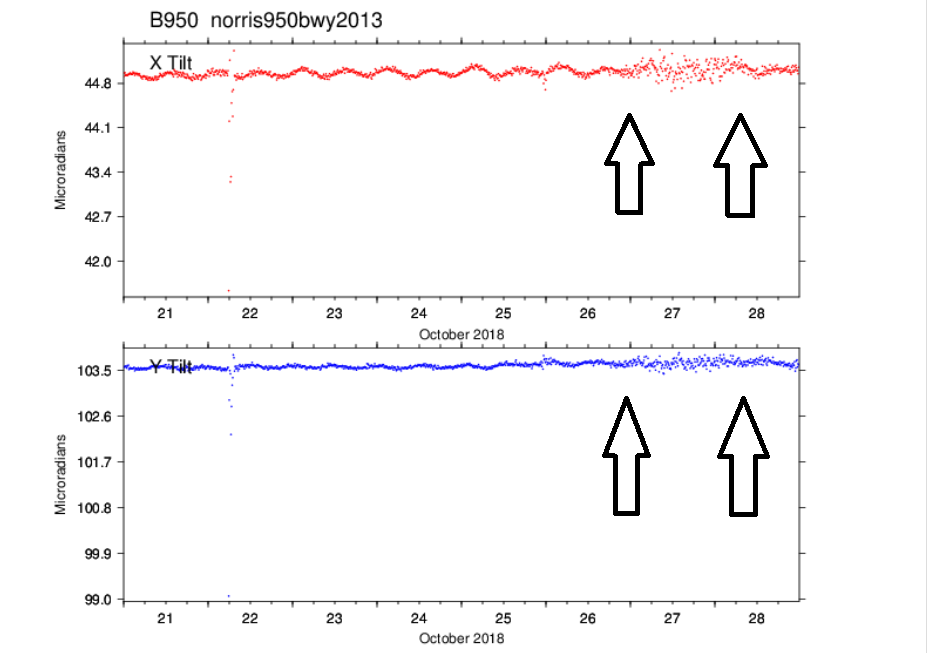
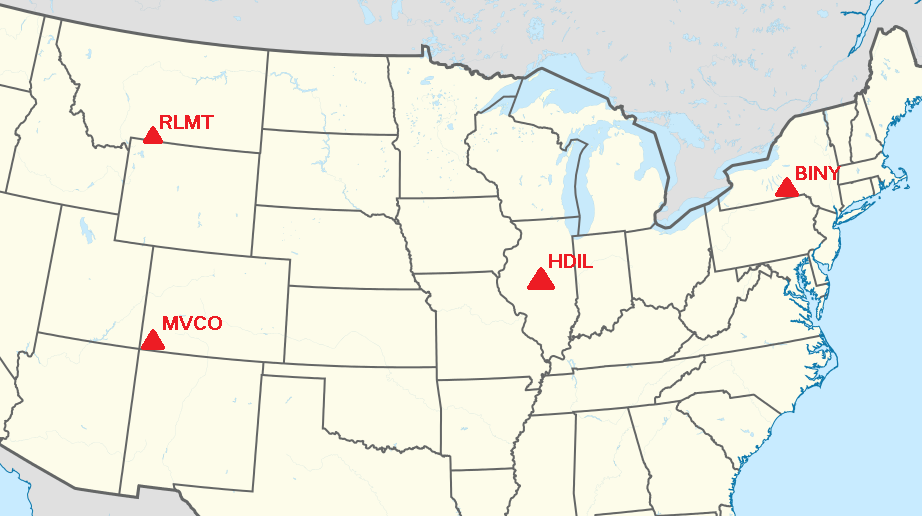
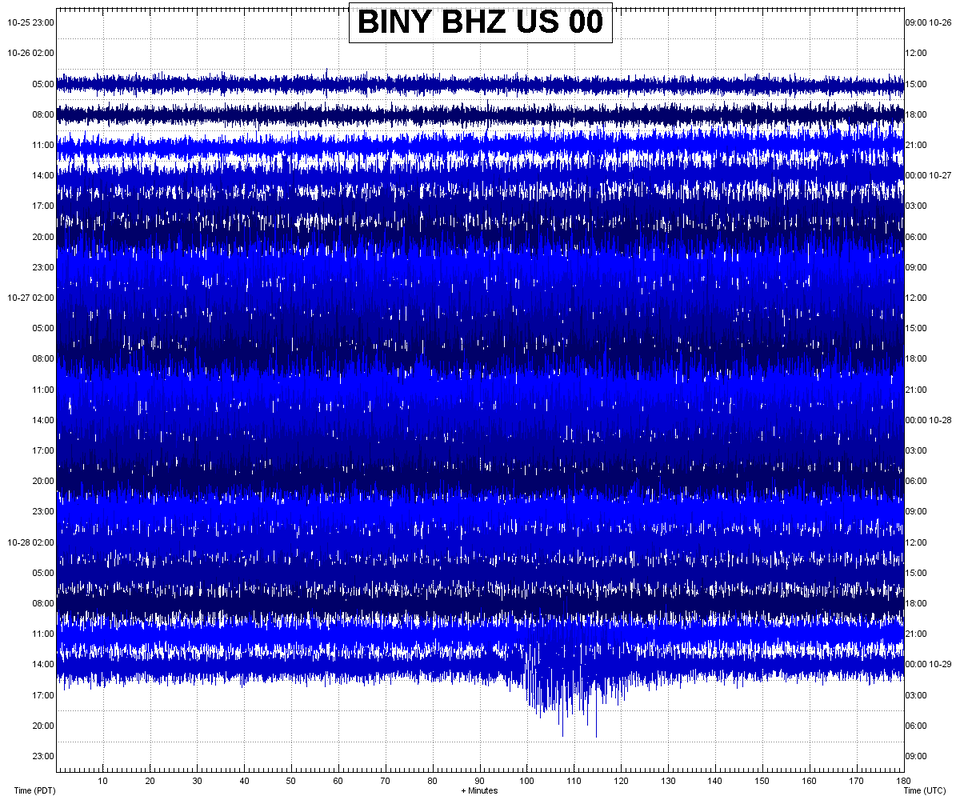
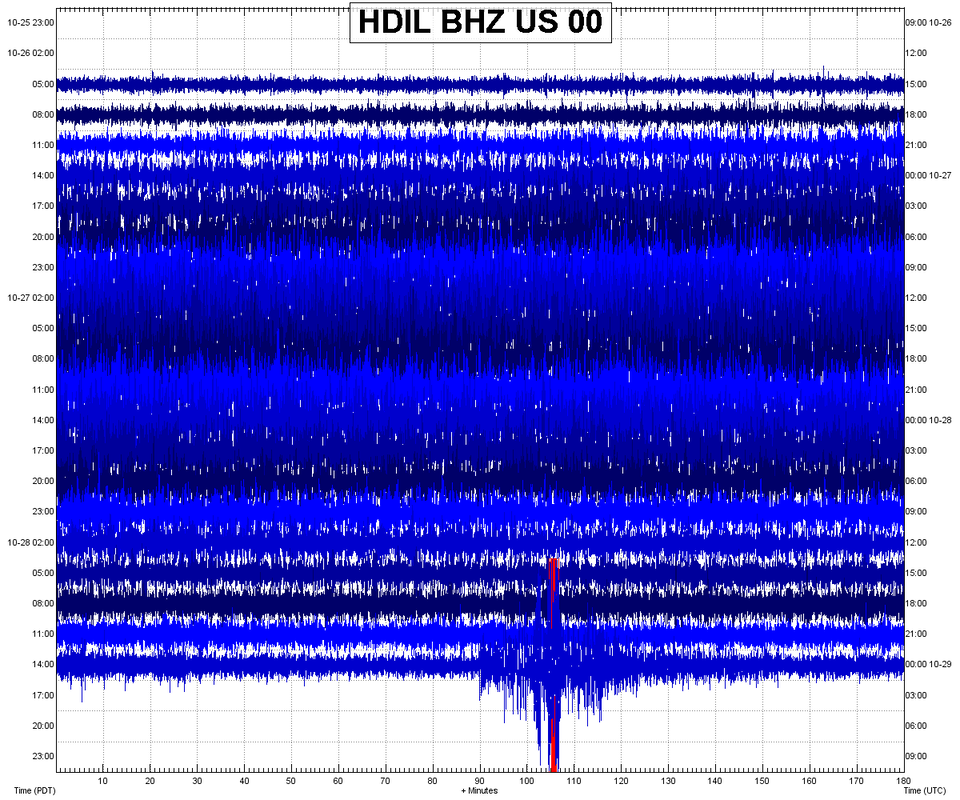
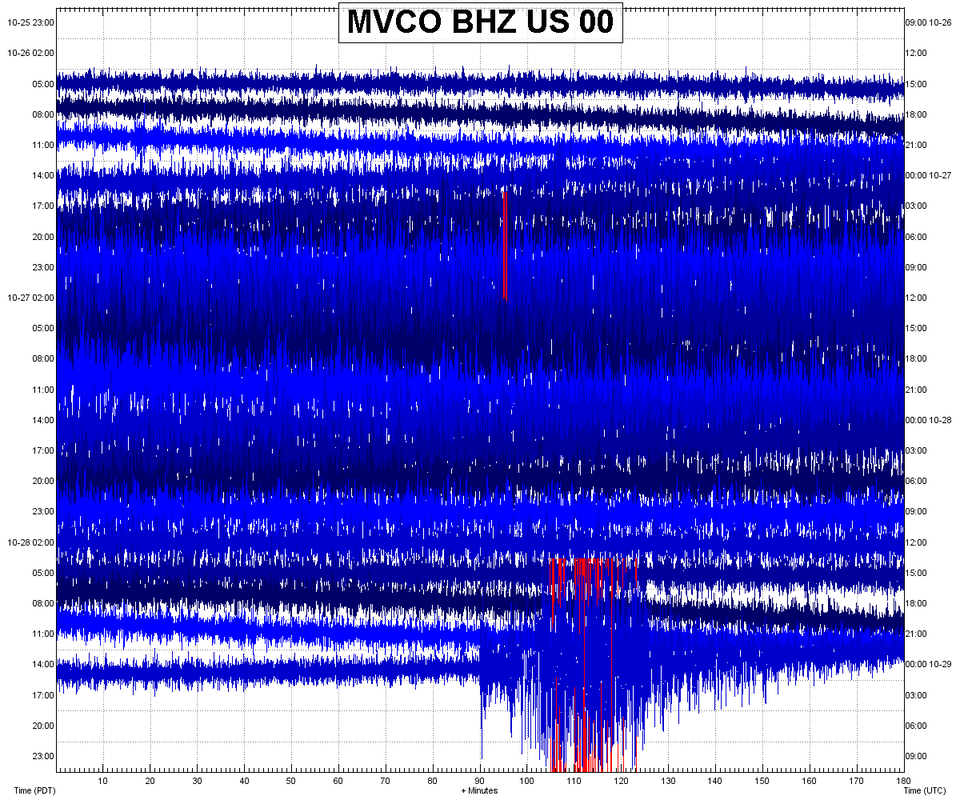
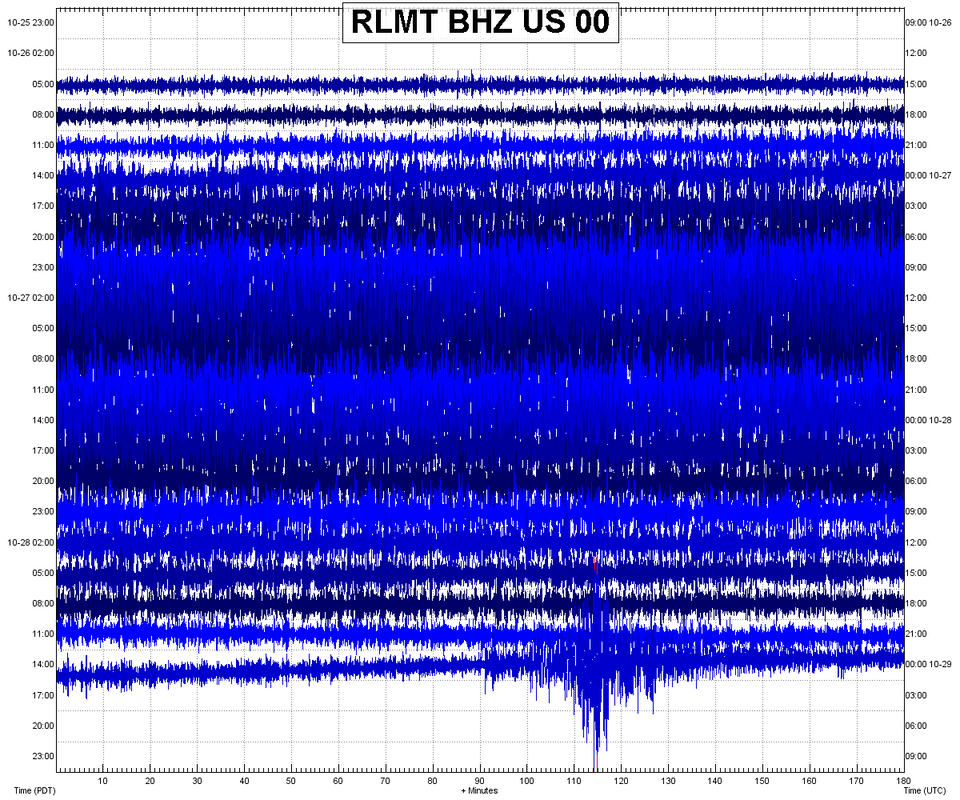
 I recently uploaded a video detailing the re-emergence of a very strange vibration. It carries dominant low frequencies of around 0.1HZ-0.3HZ but the weirdest thing about this event is the fact that it is showing on a large majority of seismic stations from Washington state all the way to the east coast in New York. Whatever this may be, it has been seen before. This vibration is one of the first puzzling discoveries I ever made in regards to seismology. This vibration/tremor is quite strong, though not strong enough to feel, and lasted about 36 hours or so from around 1:00UTC October 27, 2018 to around 12:00UTC October 28, 2018. It is hard to pick a definite beginning for this event since it is very emergent (meaning it is very slow-building). This post will quickly show new data sources that confirm beyond a shadow of a doubt that this "tremor" is quite real and may occur again at any time. PLEASE CLICK THE TITLE OF THIS POST OR "READ MORE" to continue this post! So before I start, this blog post really won't make much sense to you unless you watch the video that has to do with this event. If you have already watched this video, please skip this part and scroll below. You can either watch it here or goto this link here: https://www.youtube.com/watch?v=v7LJFrk-ZuM& Now if you are thinking, "Oh geez, this video is way too long!", then you can goto the link for the video and scroll down to the description box. There you will find the parts to this video (that way you can skip to the part you are interested in). The "tremor", which was felt basically across the entire United States (and probably Mexico and Canada too), has since mostly subsided. Since the event was extremely emergent, meaning it built up very slowly, it was hard to pinpoint a definite start and end point. However it is obvious the "tremor" increased exponentially around 1:00-2:00UTC October 27, 2018 and started to die down around 12:00-13:00UTC October 28, 2018, as you will see in the custom helicorder images shown at the end of this post. So that means this strange vibration lasted longer than 36 hours!!! So remember how I said in the video that about a day or two after I would create a blog post showing the tilt meters, run by UNAVCO, at Yellowstone to see if this vibration was detected? Now how would I even begin to suspect that this continental-wide "tremor" would appear on the tilt meters? It is because this is not my first rodeo. It did the same exact thing last year when I was stumped as to how this same event could even be possible! The last nationwide "tremor" that was equal to or greater than this event was exactly 11 months ago on November 27, 2017. Below are the tilt meter data images from the instruments at Yellowstone. The first image I show is the location of the tilt meters in question. The black arrows on the tilt meter plots point towards the time of increased activity. Please note that the increase of activity on the tilt meters directly coincide with the increase of activity shown on the helicorders. Now I usually do not like using helicorders much for seismological analysis, but since this event carries such a low frequency and such a long time frame, it is seen best on helicorders rather than seismogram/spectrogram plots (though it still shows). The tilt images below are for a 7 day time period. Always pay attention to chart labels!!! Gee, wasn't that interesting? So now we have yet another type of data source that can confirm the presence of this nationwide "tremor". It definitely is not a coincidence that these instruments detected an increase in activity at virtually the same exact time period as the "tremor" in question. So now we know this event is very real and that it literally has nothing to do with glitches, waveform scaling, or anything like that. This really was a nationwide vibration. What the heck could cause such a thing??? Now below I will show this "tremor" on 4 select seismic stations across the country. The image shown first is the location of each station in respect to the United States. I can show many, many more but I do not have the time right now. Not much more data is needed, however, to confirm that this event actually took place. Now preparing an applicable theory as to the cause of this "tremor" is still beyond me. It will require much more additional research. However if any of you want any additional data or images, please feel free to email me. The helicorders below are generated by yours truly using data obtained from IRIS and using the program SWARM. Note each line is 60 minutes (1 hour) long. Three helicorders will be shown for each station, basically because this event lasted so long. They will be uploaded in "slideshow" format so please use the arrows in the top right corner to browse through the images. If you wish to save any image, feel free to do so. But just know that the detail is not that good with images uploaded to Weebly. If you wish to obtain full detailed images, please email me. All 4 stations shown are in broadband vertical (BHZ) data format. The station codes for each station are as follows: US_RLMT_00_BHZ, US_MVCO_00_BHZ, US_HDIL_00_BHZ, and US_BINY_00_BHZ. If any of you wish to see the same data I am seeing then please use those codes on the dataselect download website which you can find here: http://service.iris.edu/fdsnws/dataselect/docs/1/builder/ As you can see, even with only preliminary data, this "tremor" is very real and was felt from coast to coast. So, what in the heck could this be caused by? Feel free to comment and let me know below or, if the comment section below is not working, please comment on my YouTube video or send me an email. This will most likely happen again soon in the next 2 weeks so keep an eye out! I will update you guys if it does happen again. Stay safe out there guys! Now real quick, I just had a great idea (as I was finishing this post) about how to visualize this "tremor" in regards to the helicorders. The 4 images directly below are for the same stations shown directly above. However instead of 3 helicorders per station (and 24 hours per helicorder), it will now only be 1 helicorder per station. Why? Because I have seriously augmented the time frame of each line for the helicorders. Remember how in the helicorders above that one line is equivalent to 60 minutes (1 hour)??? Well the helicorders below are set to a staggering 180 minutes (3 hours) per line! And each helicorder below shows 72 hours from start to finish (not the 24 hours that you are used to seeing)! Again, since this "tremor" carried a strong but low frequency and lasted over 36 hours or so, this will show it even better! Remember the program SWARM can help you analyze data as large as this or as small as one millisecond with the seismogram/spectrogram/spectral plots.
You can clearly see below that these 4 stations (and many, many more) saw an increase in energy at virtually the same time. But if this is not a seismic event, how can that be? These stations are hundreds upon hundreds of miles away from each other! Note: The United States is 1,582 miles long and 2,680 miles wide! Enjoy!
12 Comments
Rico
10/31/2018 09:30:42 am
Thak you very much for your hard work, Ben.
Reply
Ben
11/1/2018 08:15:26 pm
Thank you much!!! God bless
Reply
Karen Jones
11/1/2018 04:13:41 am
I found this very interesting. Thank you Ben for all your hard work. Much appreciated.
Reply
Ben
11/1/2018 08:18:51 pm
Thank you lots!!! It can be time consuming, but it is very fun to me! God bless
Reply
Leslie
11/1/2018 06:10:07 pm
This is really cool, Ben! It is incredibly interesting that all increased in activity at the same time. Which of course, suggests that it wasn't movement across the plate. Have you thought about emailing USGS and asking them? We know that the plate does move west for most of the year, until it reverses and moves east for several months. Not actually sure about the actual time frame or whether it is the whole plate or just the northwest area of the plate that moves this way. Trying to remember what article I read or where it was but it was an article talking about the cascadia subduction zone. I am also very interested in the topics you address, just wish I had more time. You are going to love going to university! Just wish I had taken more geology classes as electives.
Reply
Ben
11/1/2018 08:17:51 pm
Thank you for the support! And I might email them. I am trying to compile more data first, though. This stuff really is fun for me so I think going to school for it will be awesome. God bless!
Reply
Amy
11/10/2018 09:16:05 pm
Nov 10th 1820 MST MCID started showing increased activity again. Could you take a look and see if this is related. Thank you for your time and energy. I always look to see if you have a new blog post or youtube video!
Reply
Amy
11/11/2018 10:48:25 pm
Also on MCID 11-11 1800-2300 MST
Reply
Ben
11/14/2018 04:00:55 pm
Awesome. Thank you for checking my blog and YT channel when you can. And it did seem like this "tremor" did increase a little bit but I think it has died down. I am still monitoring closely for this event to happen again. God bless!
Reply
Interesting. Is it possible this is a continental or global adjustment of the compression in the crust. If so it should show start time variance pointing back to the origin. It's had to tell from the plots, but there appears to be some variance in start time. Seasonal variation may also be related to the Sun line, and it's reversals around June 21 and December 21. Puzzles are always interesting.
Reply
Ben
11/19/2018 04:34:06 pm
Possibly. It just happened again November 15-16. And yes it does show some variance in the arrival times but I am still having a hard time pinpointing the source. I was thinking maybe it is a much larger epicenter (like multiple states or half the country). But the frequencies are extremely low but very powerful at the same time. It is for sure an awesome enigma! Im currently looking for research papers done on this topic but I cannot seem to find anyone who has noticed this in past years. I will update you guys if I find anything.
Reply
Amy
11/22/2018 09:54:14 pm
Is it happening again right now?
Reply
Leave a Reply. |
AuthorBen Ferraiuolo is a fast learner and someone who will always stand for the truth. Visit "About Me" for more! Archives
November 2019
Categories |
 RSS Feed