 Hey guys. There has been some interesting activity once again! The Olympic Peninsula in Washington state, which doesn't see magnitude 4 quakes too much, got struck by a 4.1 and then a M1.3 aftershock. The North Pole also saw a magnitude 4.4 earthquake and Yellowstone just recently saw a very weird 9-minute earthquake swarm with peculiar characteristics. I will show the data from these events. PLEASE CLICK THE TITLE OF THE POST OR "READ MORE" TO READ MORE!!! Washington State M4.1 Quake: At 11:09UTC November 19, 2018 (3:09am Pacific Time November 19) a magnitude 4.1 earthquake struck at reportedly 39.3km in depth almost directly under the center of the Olympic Peninsula. It was followed by a magnitude 1.3 aftershock just 50 minutes later near the same location. This is a very weird spot for an earthquake. We don't see many of these near this epicenter. If you didn't know, I live in Bothell, WA which is just northeast of Seattle. As you can see below, this earthquake was felt a great distance away by a large amount of people. Now you may say 87 people does not sound like a lot. But notice two things: 1. This earthquake occurred at 3 in the morning for this area, meaning a lot of people were asleep during this, and 2. More people don't know where/how to report an earthquake than those that do. Whenever I see a number of felt reports I usually like to double it to imagine the actual amount of people that felt it. It may not be completely accurate but it is worth doing. 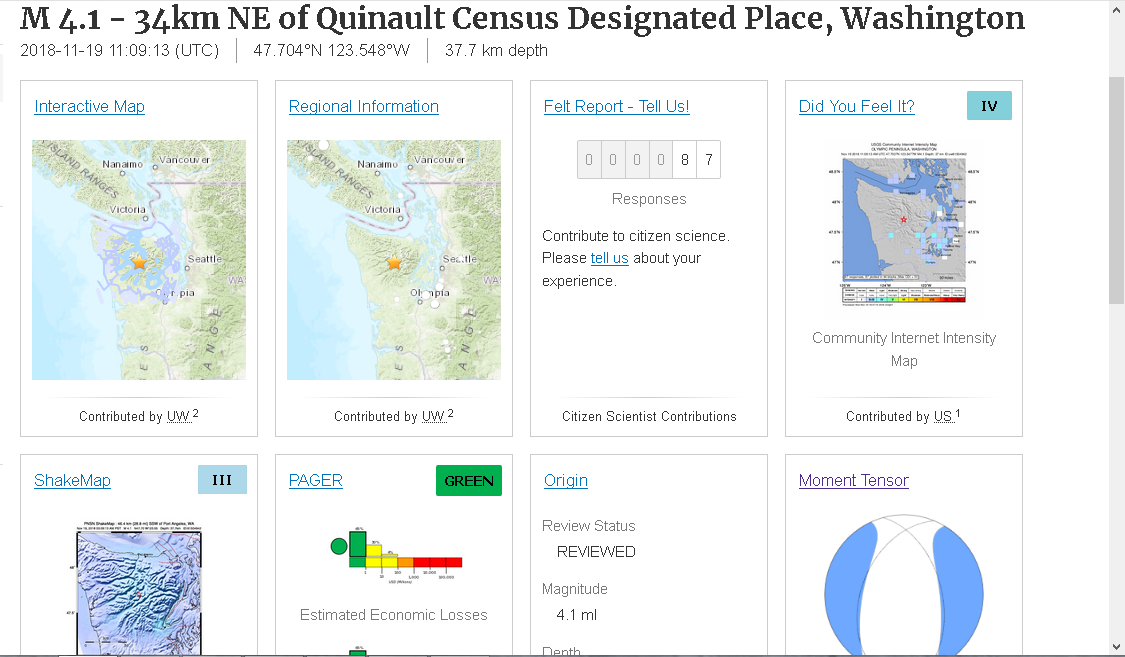 The event page generated by USGS for the M4.1 in Washington state. 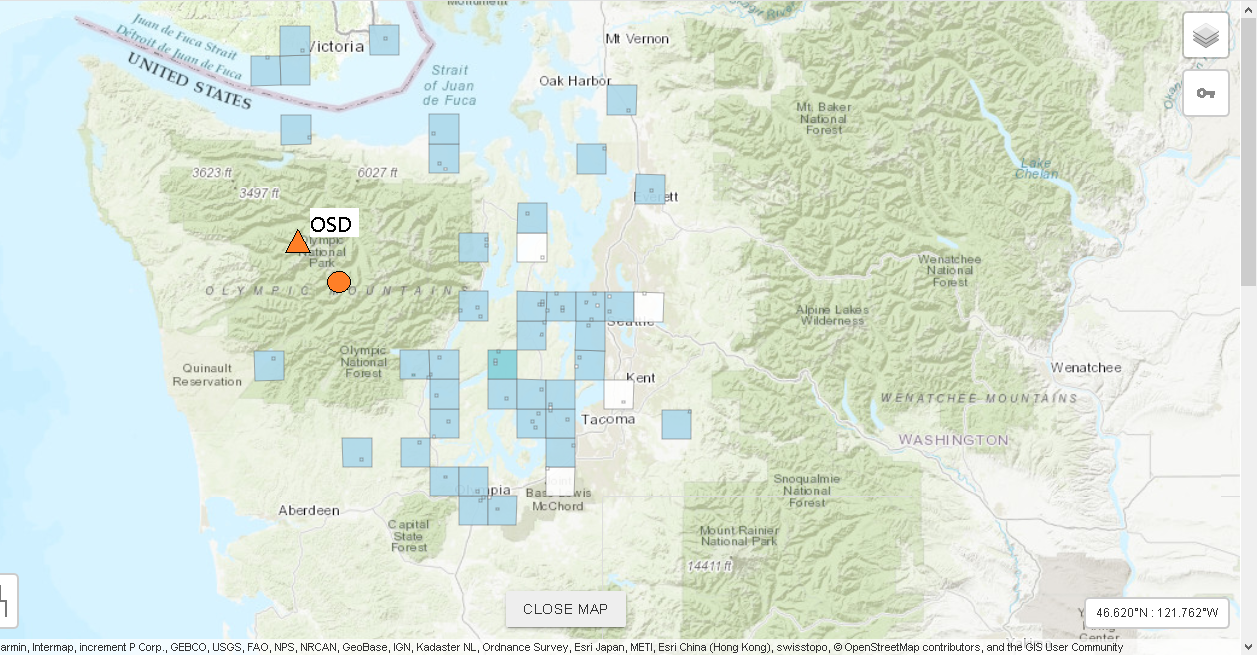 In the two images above, you first see the event page for the M4.1 earthquake submitted by USGS and PNSN. Now look at the second image. Look at all those felt reports! If you live near this area and was awake at 3am then you should have felt it! There was even one felt report in Portland (not shown). Now there are many stations that resides somewhat near this area. Thankfully there is a very reliable seismic station very near to where this M4.1 occurred. It is station OSD in the UW network, shown in the image above. The orange circle represents the location of the M4.1. In the following seismic images below, all generated by me except the last one, the data was retrieved from the closest seismic station to this event: UW_OSD_--_EHZ. Remember to always pay attention to chart labels FIRST before you read the data. Also please pay attention to any captions beneath any images. 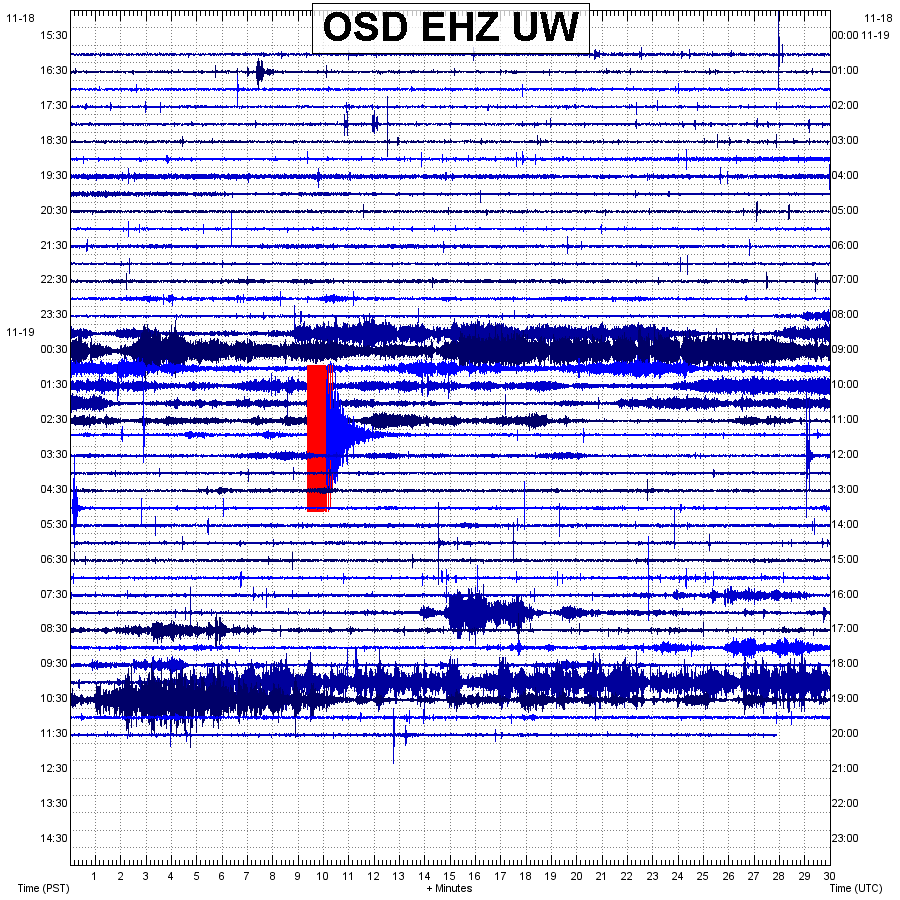 Here is the seismic "chart", helicorder, for station OSD. You can obviously see the strong M4.1 quake but the aftershock you can see just before the 12:00 mark on the right. 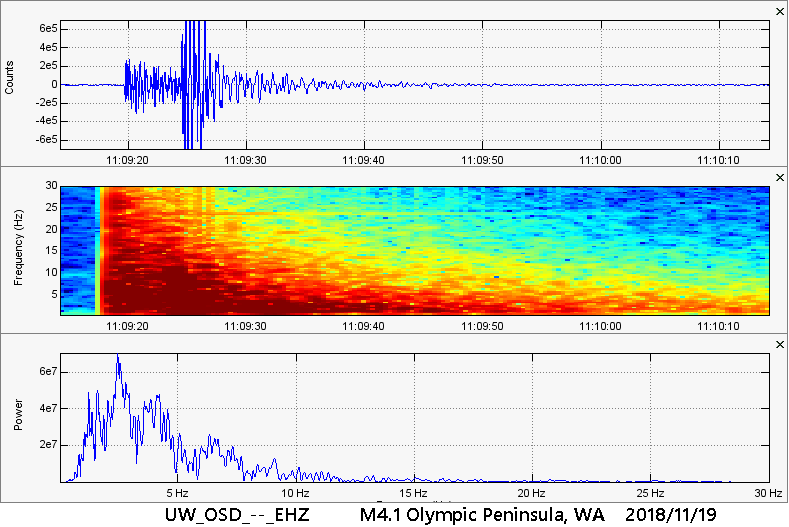 Here are the seismogram/spectrogram/spectral plots of this earthquake. Notice something strange. See how the spectral plot and the spectrogram plot both show dominant frequencies below 5Hz? Well this station is very close to the epicenter so why are we seeing such dominant low frequencies? Obviously there were some strong high frequencies but the strongest ones were below 5Hz. I am not calling it a low frequency earthquake, but it is definitely lower than what I would expect. Regardless, this was a somewhat rare event since the Olympic Peninsula does not see too much seismicity. 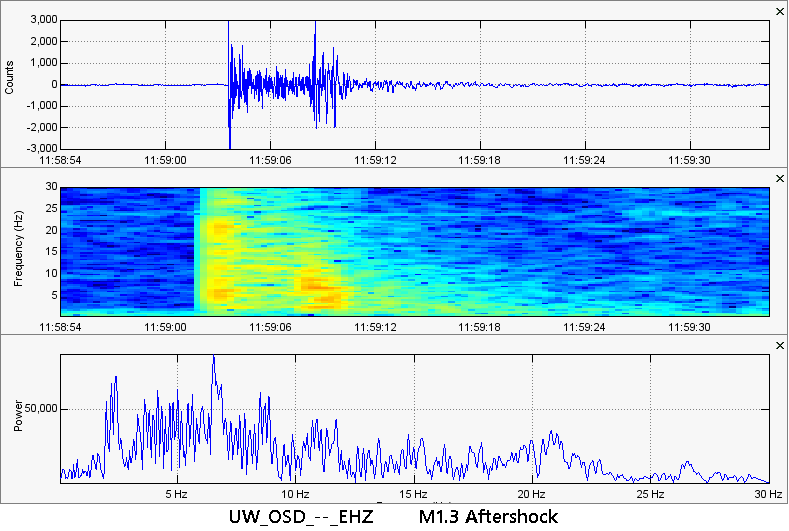 Here are the plots for the M1.3 aftershock which struck just 50 minutes after the initial M4.1. Notice how the frequencies are more spread out on the spectral plot? This one contained much more power within the higher frequencies than the M4.1. 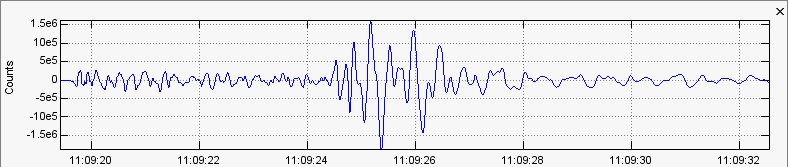 Here is a very zoomed-in look at the M4.1 earthquake via a seismogram plot.  This image was NOT generated by me but by the PNSN. This shows the earthquake and the distant stations it appeared on. Notice how OSD is the closest station, of course. You can find this by visiting the event page at this link: https://pnsn.org/event/61504942#overview. So what caused these two earthquakes (M4.1 and M1.3)? The initial M4.1 showed much lower frequencies than I have seen in a while for magnitude 4's. Regardless, this is a very interesting event. Even the location of the quake is strange. M4.4 at the North Pole: At 4:14UTC November 19, 2018 (8:14pm Pacific Time November 18, 2018) a magnitude 4.4 earthquake struck at reportedly 10km in depth, very near the North Pole. Now, in regards to USGS and earthquakes that occur far from seismic stations, 10km is always set if they are unable to locate a correct depth. Of course earthquakes can occur at 10km so it is tough to tell when any event occurs at 10km exactly (since that is the depth USGS uses when they are unsure). So it could have been deeper or shallower. No one may ever know........... Except maybe Santa! 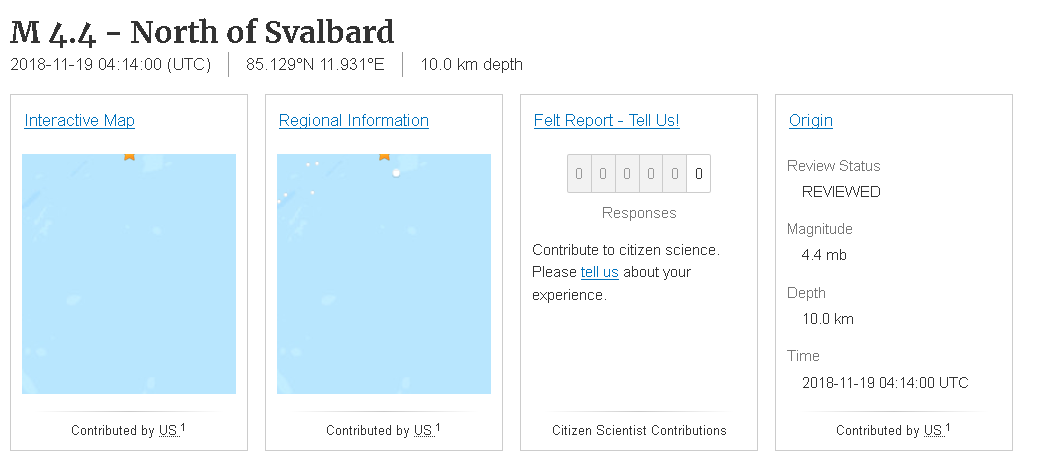 The USGS event page for the M4.4 near the North Pole. No one has reported feeling. That doesn't mean no one felt it guys! Just that no one reported it to USGS. I bet internet may be a little spotty up here! 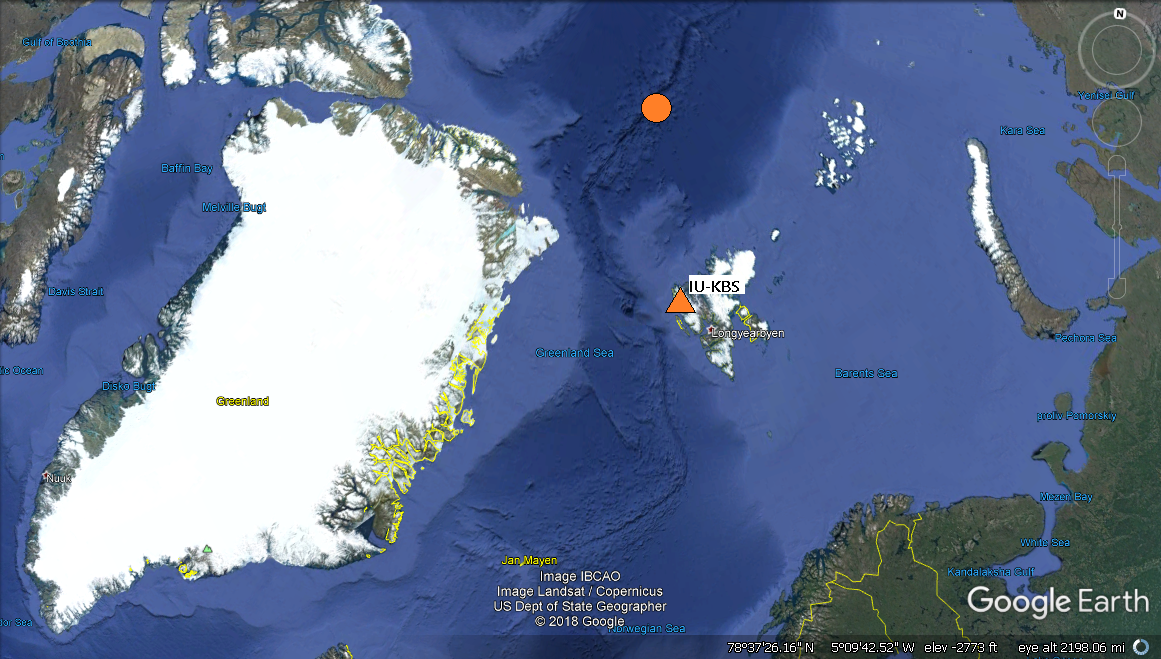 So the first image is obviously the event page for this earthquake. Now this earthquake occurred so far north, so very near the North Pole itself, that the map on earthquake.usgs.gov had a hard time zooming in to the location! I literally had to copy and paste the coordinates into Google Earth to get a good look. The orange circle represents the location of the M4.4 earthquake and the orange triangle is the location of seismic station KBS in the IU network (the closest active station to this event). In the seismic images below please remember to always read chart labels FIRST before looking at the data and, as always, pay attention to any captions beneath any images. Since KBS was the closest station to this event, that is the station I used for generating the following plots. 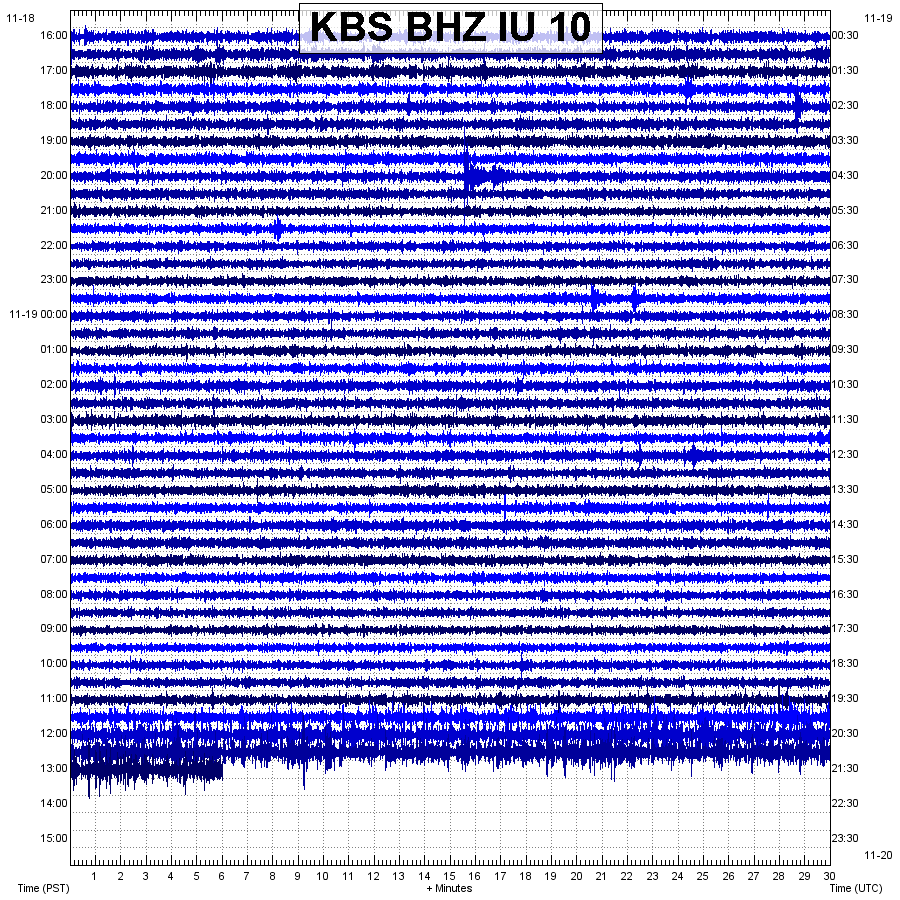 Not all that you see here is "surface noise". Station KBS has been detecting some very strange LF, low frequency, activity the past few days (if not longer). I am unsure what this means but this background "tremor" is sort of hiding the earthquake. You can see it though near the center of the chart near the top. High pass filter of 0.8Hz was added to filter out the broadband background noise. 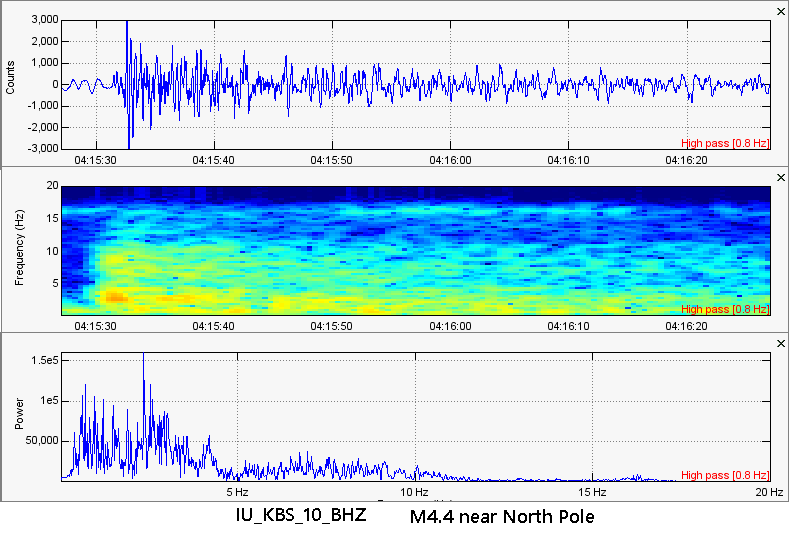 The seismogram/spectrogram/spectral plots of the M4.4 near the North Pole. Once again a 0.8Hz high pass filter was added. This station, KBS, was the closest seismic station available for this earthquake. Boy, I hope it didn't wake Santa up! Haha Peculiar, Short Burst of Quakes at Yellowstone: From 3:12UTC to 3:21UTC, November 20, 2018, a very strange and enigmatic swarm appeared on the stations around Yellowstone Lake. I have confirmed, using P wave arrival times and many neighboring stations, that there were 17, yes 17, earthquakes within only 9 minutes! None of them have been reported yet. However many were very small and very close together that it may be hard for some of the earthquakes to accurately be located. A few quakes were even of a negative magnitude but still traveled quite far. But we are not necessarily looking for complete accuracy. A simple guess would do fine. But apparently the University of Utah does not like reporting quakes unless they have an exact location, which is far more strict than other individuals and institutions. Regardless, I have determined the approximate area these earthquakes were coming from. 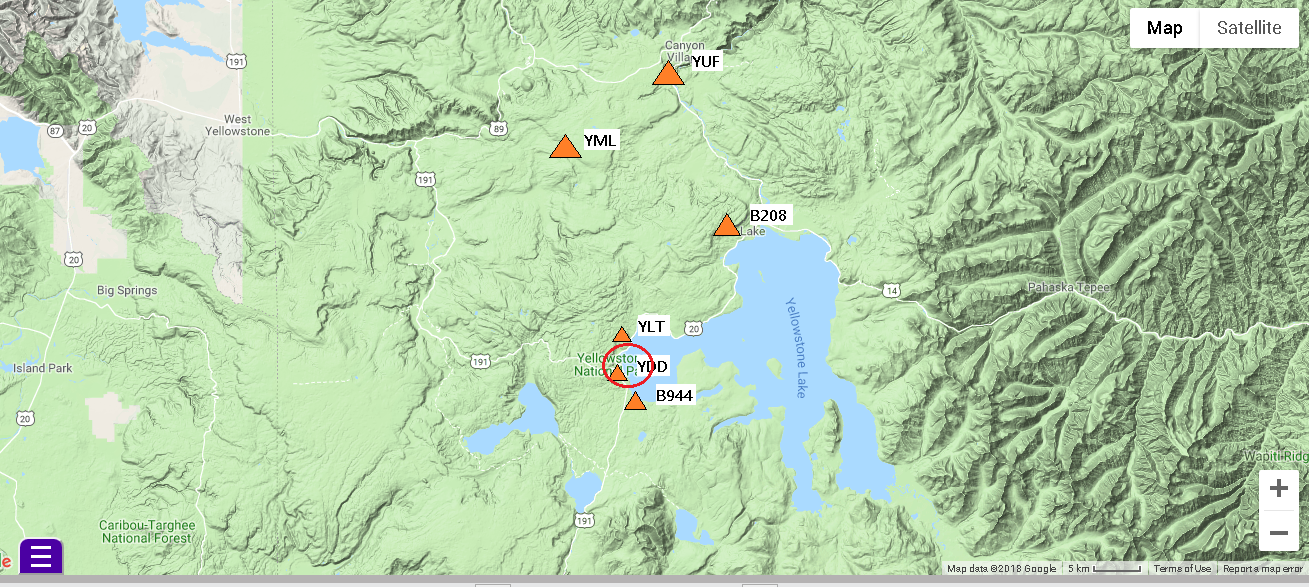 As you can see in the image above, I have six seismic stations labeled. The red circle shows the highest probability area for the epicenter of these earthquakes due to the P wave arrivals on the six seismic stations shown above. Remember P wave arrivals are very important and are the first "bumps" you see when an earthquake arrives on a seismograph. These events were small in amplitude but still traveled quite far. I am currently unable to determine the exact depth, but it is my guess these occurred between 2.5-4km in depth. Pretty much the same depth we have seen before for rapid succession earthquakes that occur at West Thumb. If you follow my work then you know I am particularly interested in why all earthquake swarms that occur at West Thumb lake occur in very close succession. I am still unable to determine why but in my opinion it is related somehow to magma aggravating the local hydrothermal system, possibly even heating up the West Thumb Geyser Basin system too much. But that is just a theory right now. 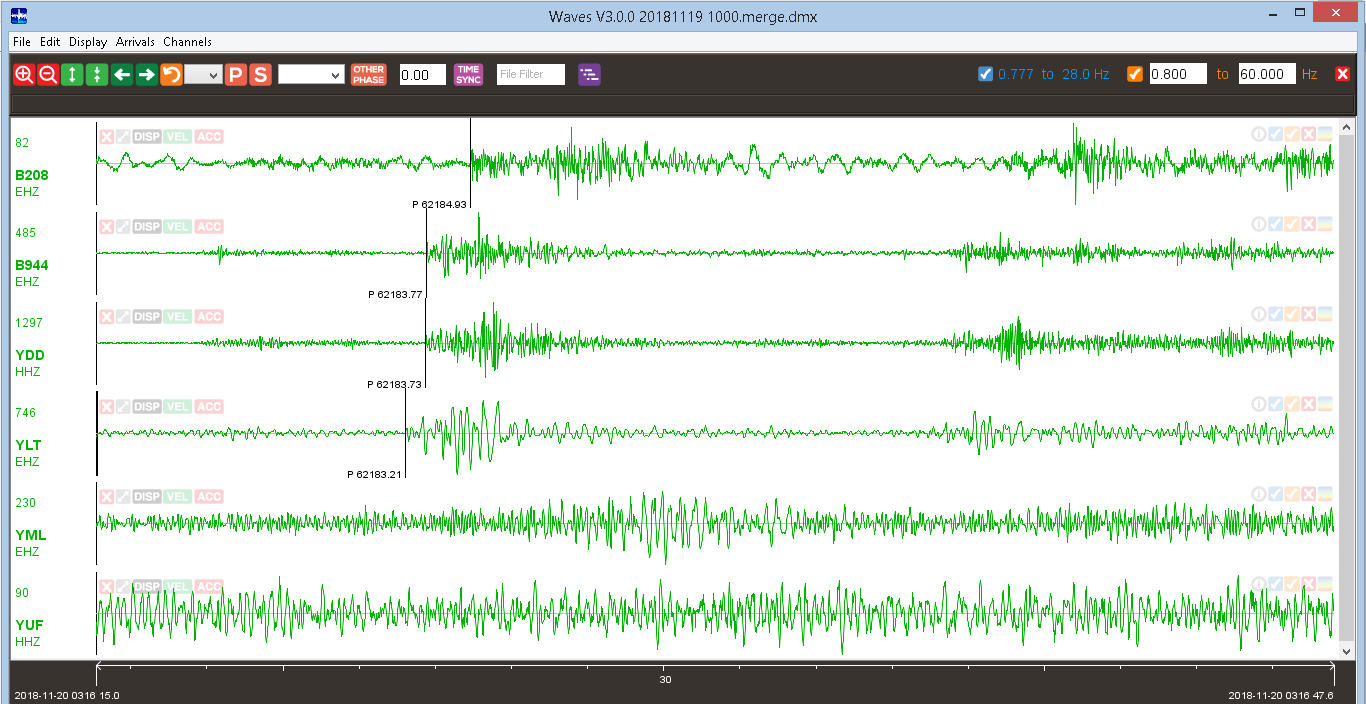 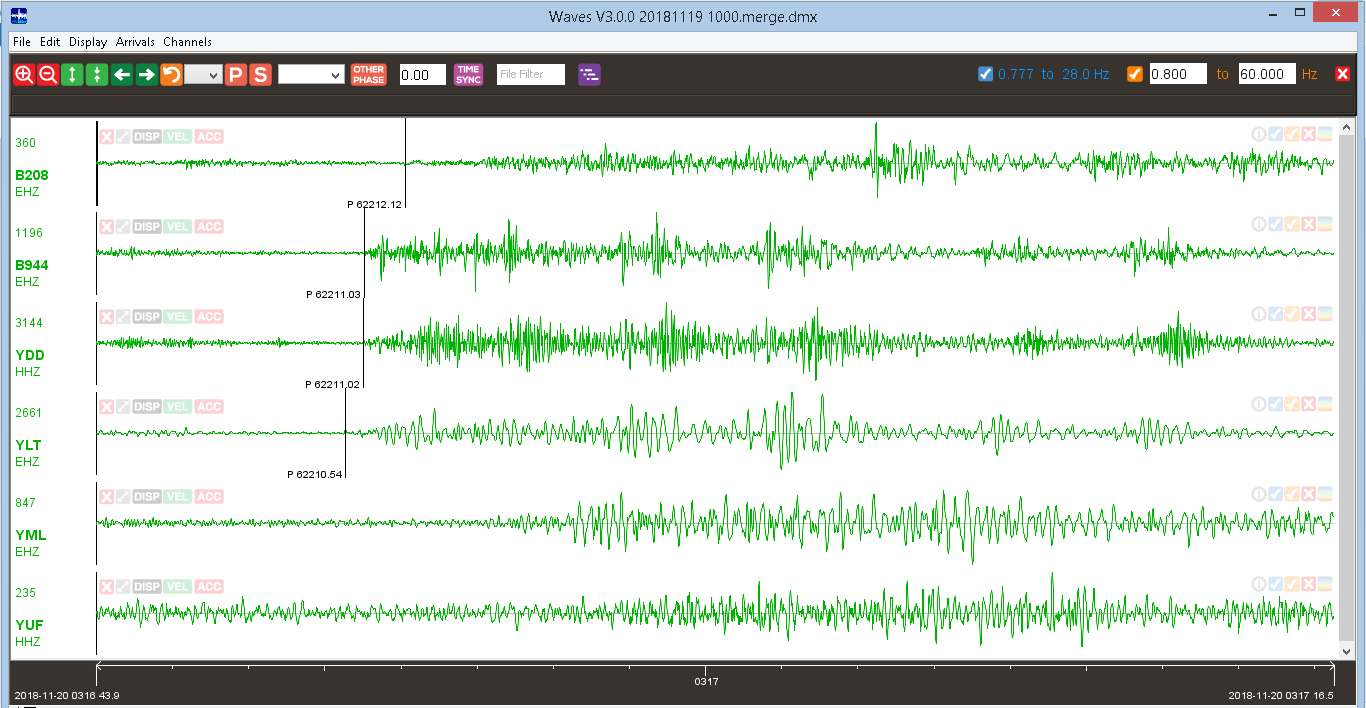 Now in the two images above I added data from stations B208, B944, YDD (the new station at West Thumb), YLT, YML, and YUF. The locations of those stations are shown in the map. This was done just to show you the P wave arrivals of two events during this swarm. However notice in the second image, the one directly above this text, that it appears almost 6 earthquakes occurred in just 30 seconds!!! In all seriousness, this truly was a rapid succession event. These events occur solely near the West Thumb area. I am on a quest to discover why but I still have a lot of research to conduct, and little time to do it. Below are the seismic helicorders for the 3 closest stations to this event: B944, YDD, and YLT. For the YDD helicorder plot please note that a 0.8Hz high pass filter was added. You can see the 9-minute swarm near the bottom of the "charts". 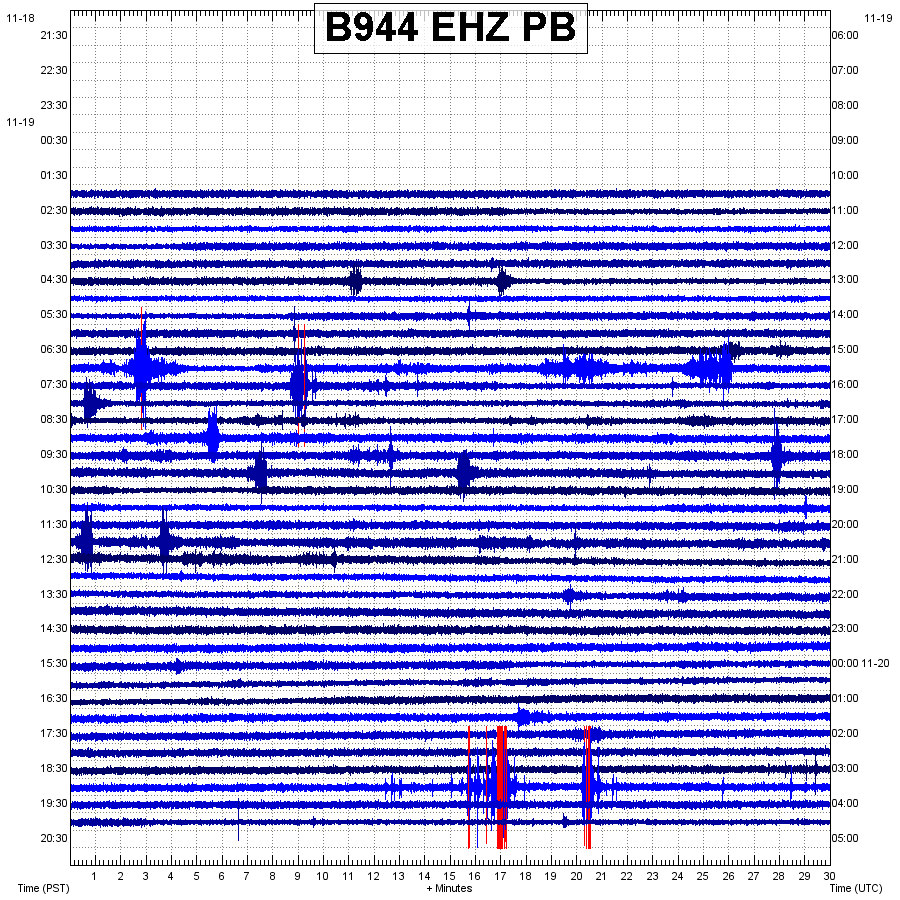 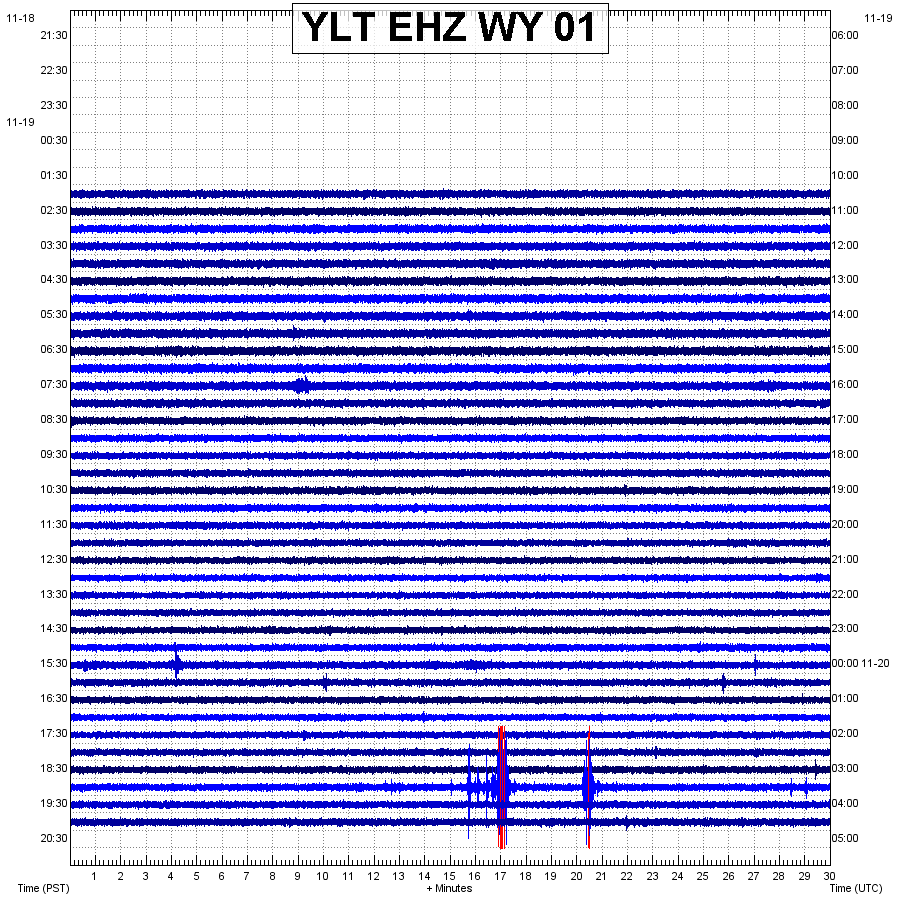 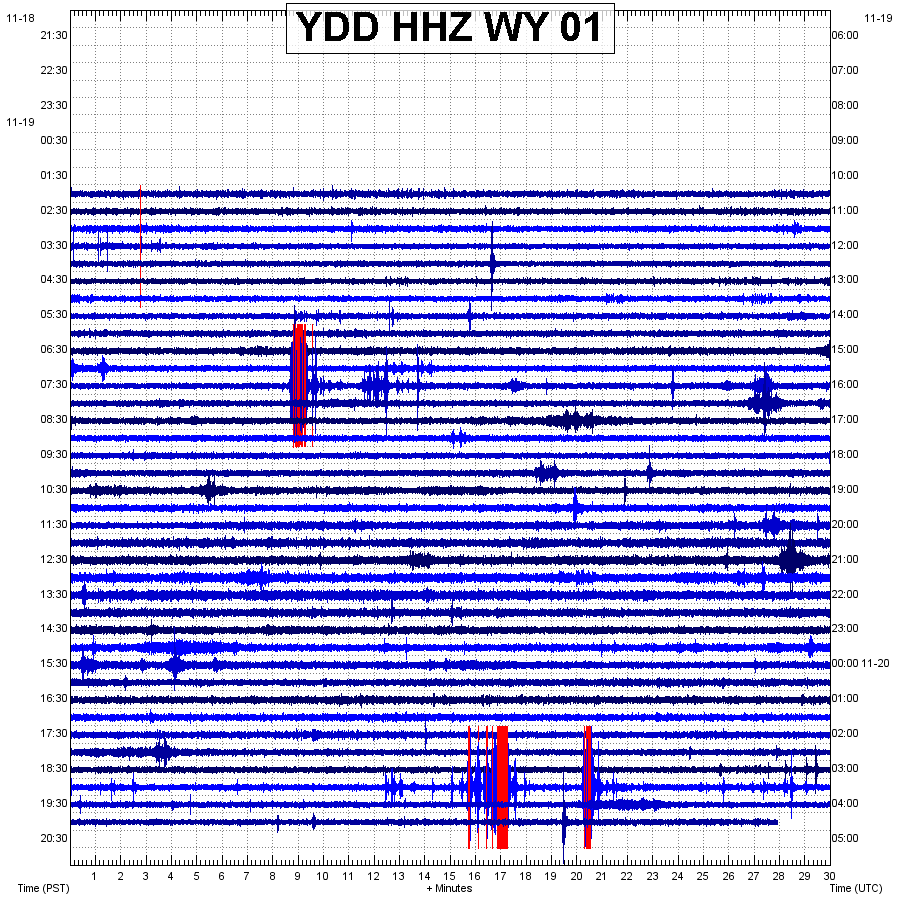 Below are the seismogram/spectrogram/spectral plots of these earthquakes. It is my opinion this 9-minute swarm is the same type of swarms we have been seeing off and on the past few years at West Thumb lake, especially July 5, 2018. But this swarm seemed a little different. Remember, within only 9 minutes, this swarm contained about 17 earthquakes. Many of them registering at a negative magnitude with a few probably equaling a magnitude 1.0-1.3. For the plots below please always remember to read chart labels FIRST and then read the data. Also pay attention to any captions beneath any images. Since these earthquakes occurred closest to station YDD I will use it for these plots. Remember a 0.8Hz high pass filter was added since this is originally an HHZ channel (broadband vertical). 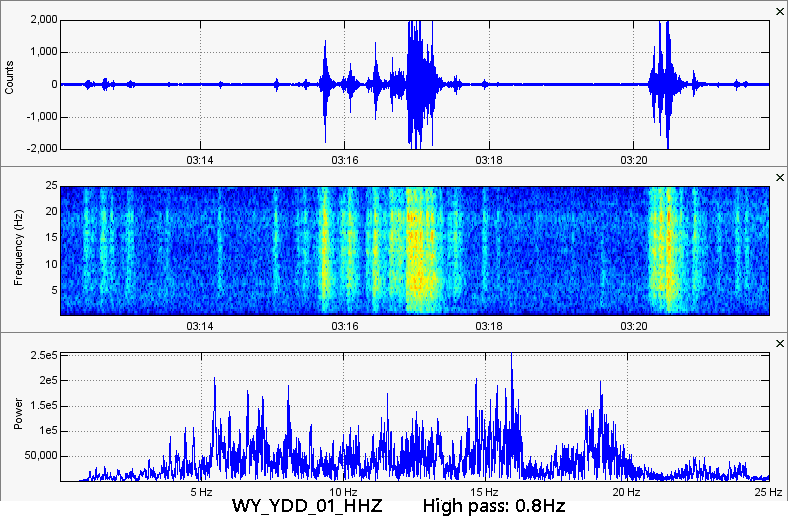 This is the entire 9-minute swarm at West Thumb lake at Yellowstone caldera, from start to finish. Looks like something was just passing us by! Haha 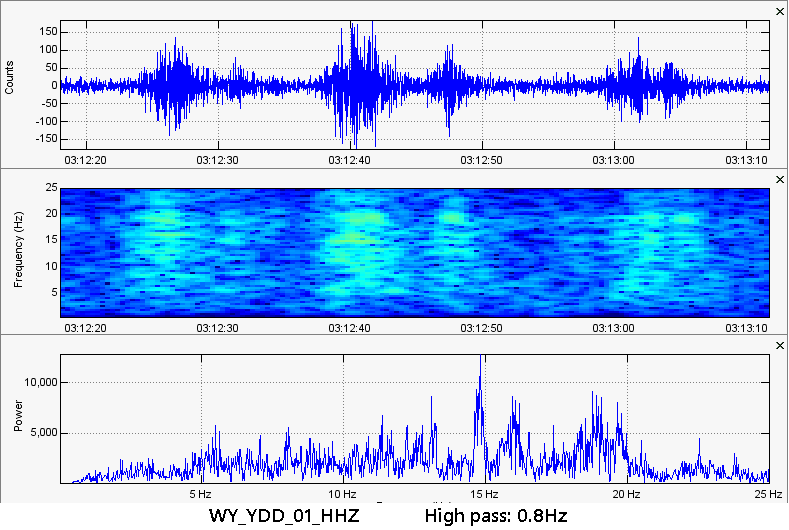 Here are the first 3, or 4, events in this 9-minute swarm. There are no dominant low frequencies. But how could a rapid succession swarm occur so quickly, 17 quakes in 9 minutes, without some lower frequencies? Surely this cannot be tectonic! Well if these were occurring not in rapid succession then I would say it was tectonic in nature, possibly occurring from stress along the Elephant Back fault near Yellowstone Lake. But the fact that some of these quakes are occurring so close together, the most was 6 in about 30 seconds, to me this appears to be a rock-break sequence possibly caused by aggravated hydrothermal systems due to increased heat from the magma chamber. Remember hydrothermal activity is completely controlled by the magma system underneath Yellowstone. If there are geysers or hot springs then there is magma. Pure and simple. 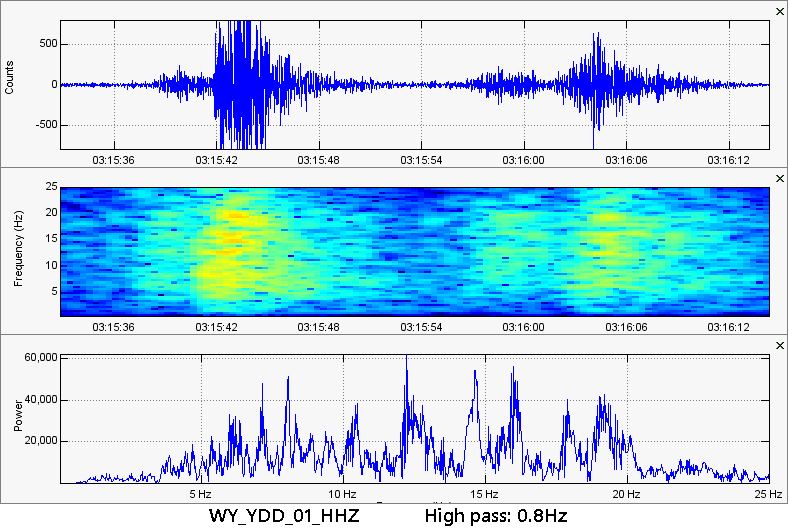 Here are two earthquakes within about 38 seconds or so. Note dominant mid-high range frequencies. Some of the local stations detected slightly lower frequency ranges. 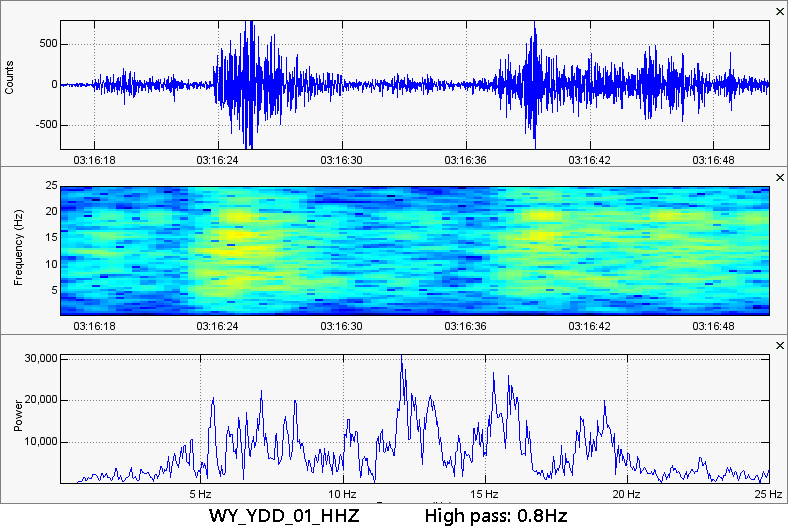 What appears to be 3 separate events within about 30 seconds or so. Note the mid-high range frequencies once again. Man, these are happening at a fast pace! Can you imagine if these quakes were occurring at around magnitude 2.5-3.5???? That would be worrisome. 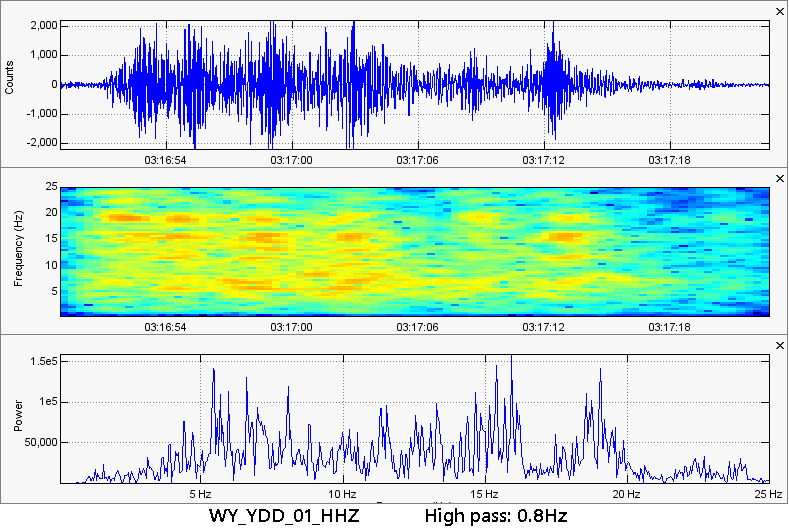 Okay, this was the most interesting part of the 9-minute swarm at West Thumb lake. Take a look at the seismogram and spectrogram plots. It looks like there were 5, maybe 6, earthquakes within only 30 seconds! It doesn't matter what magnitude these were at! That is extremely, extremely quick for any earthquake swarm. This definitely was not caused by tectonic forces alone, if at all. This sequence right here was the strongest out of the rest of the swarm. Notice how the swarm seemed to quickly build, reach its peak, and die down? To me that almost looks like something was approaching and then receding. Magma would have caused a larger swarm and more low frequencies but this cannot be tectonic activity. So if it is not magma itself (even though magma obviously is driving this) and it is not tectonic, then what could it be? I believe it is hydrothermal intrusion or extrusion. Yes that really is a thing, especially at Yellowstone. We will keep an eye on this area to see if this happens again. 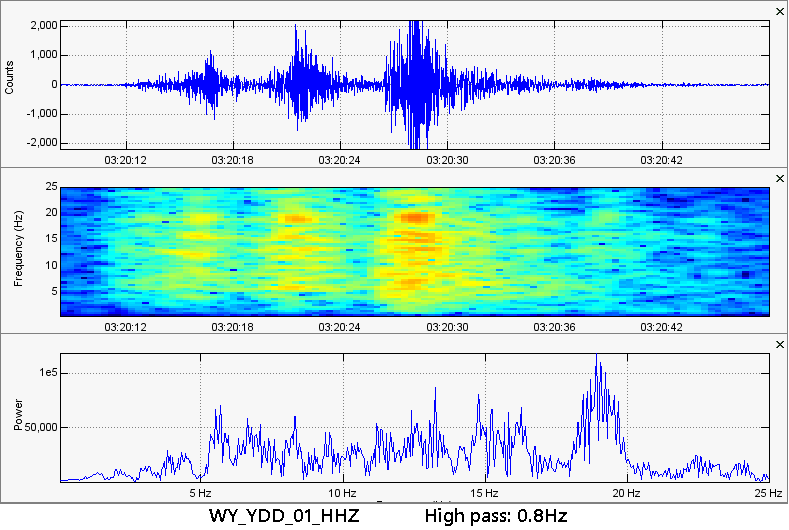 Now this was the last sequence of the swarm, sparing a few tiny micro-quakes. This sequence of 3 earthquakes in, once again, 30 seconds shows this is NOT tectonic in nature. Also look at the spectrogram plot. Look at the horizontal spacings. Isn't that weird? I have never seen horizontal spacings like that on a spectrogram before. The spectral plot shows dominant frequencies at 18Hz or so. So there has definitely been some interesting activity as of late. A rare 4.1 at the Olympic Peninsula in Washington state, a 4.4 at the North Pole, and a very enigmatic 9-minute swarm at West Thumb lake in Yellowstone caldera? This is just getting started folks! I believe a large swarm is approaching for Yellowstone, as I have been saying for the past few months. Regardless of whether I am right or not this area should be monitored closely. Remember accurate and responsible monitoring of these areas is both very practical and very easy. God bless and have a great day! I will be back soon.
0 Comments
Leave a Reply. |
AuthorBen Ferraiuolo is a fast learner and someone who will always stand for the truth. Visit "About Me" for more! Archives
November 2019
Categories |
 RSS Feed