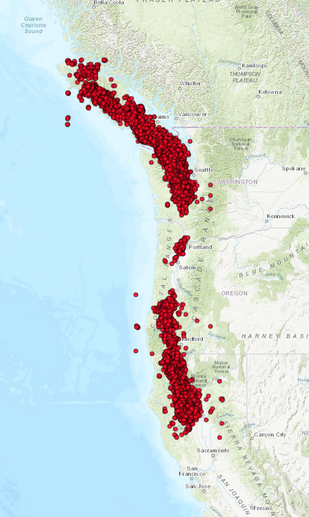
 Tectonic tremor epicenters Aug. 30, 2012 - Nov. 17, 2012 along the West Coast of the United States. Tectonic tremor epicenters Aug. 30, 2012 - Nov. 17, 2012 along the West Coast of the United States. There is a lot of speculation among people out there that reported tectonic tremor epicenters on the PNSN tremor map are actually showing earthquake epicenters and that these events are actually earthquakes. This is not true and in this post I will show you what the ETS epicenters are actually showing. Please click the title of this post or "read more" to continue... Resources: -PNSN tremor epicenter map: https://pnsn.org/tremor -IRIS Gmap for station searches: http://ds.iris.edu/gmap/ -IRIS Dataselect for seismic data retrieval: http://service.iris.edu/fdsnws/dataselect/docs/1/builder/ ETS, also known as episodic tremor and slip, was recently discovered in the early-2000's. Although little is still known about its significance and relation to ruptures of the Cascadia Subduction Zone, we do know ETS is related to increased slip from the Juan de Fuca plate subducting beneath the North American plate. When the Juan de Fuca increases speed and starts to slip, the lubrication of the plate allows for tremor to be produced. Tectonic tremor is then detected on seismic stations and slip of the subduction zone is recorded on the GPS stations along the zone. PNSN has a wonderful tool known as the "Tremor Map". There are common misconceptions that these epicenters are showing earthquakes, not tremor. This is mainly because the events are represented as dots, just as many of the earthquake apps represent earthquakes. In fact, each dot represents about 5 minutes of tremor. Although events may release a maximum energy of a M2.2 earthquake, that energy is released over a much longer duration than instantly like an earthquake. Because of this, it is highly unlikely anyone would ever feel tectonic tremor. But just because we cannot feel it doesn't mean it isn't worth monitoring! Below I will show a few quick examples of what tectonic tremor during ETS looks like. At times it is hard to detect these events in relation to normal background activity, such as wind, traffic, and other factors. To whittle down ETS tremor and avoid misinterpretations, I suggest comparing 10 minute sections of seismogram and spectrogram plots from two seismic stations at bare minimum. If those stations are many miles apart, and show the same increases in energy, it is likely you discovered tremor. Example 1 You can use the resources in the beginning of this post to find tectonic tremor on your own. Simply compare the times of reported tremor and try to find the closest active stations to the epicenters. It may take some doing, but it is worth it. You can see the reported epicenters below on the map and the location of the two select seismic stations I chose. Notice how the tremor clearly shows on both stations even though the stations are many miles from each other? 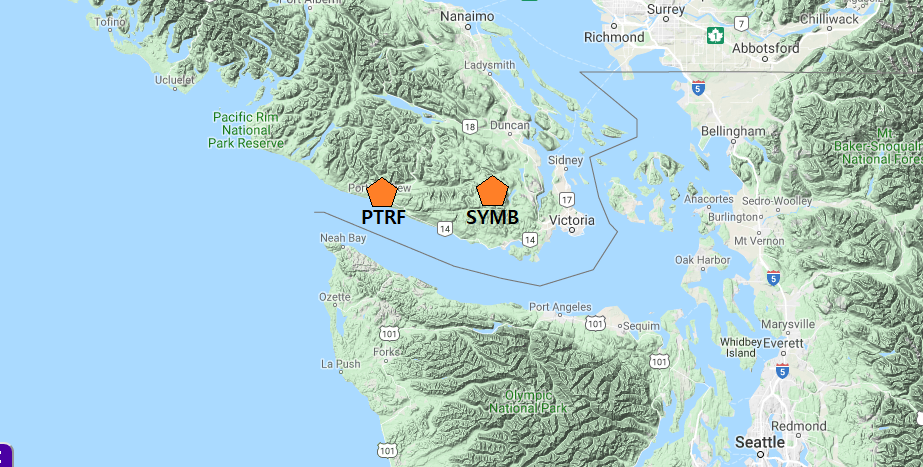 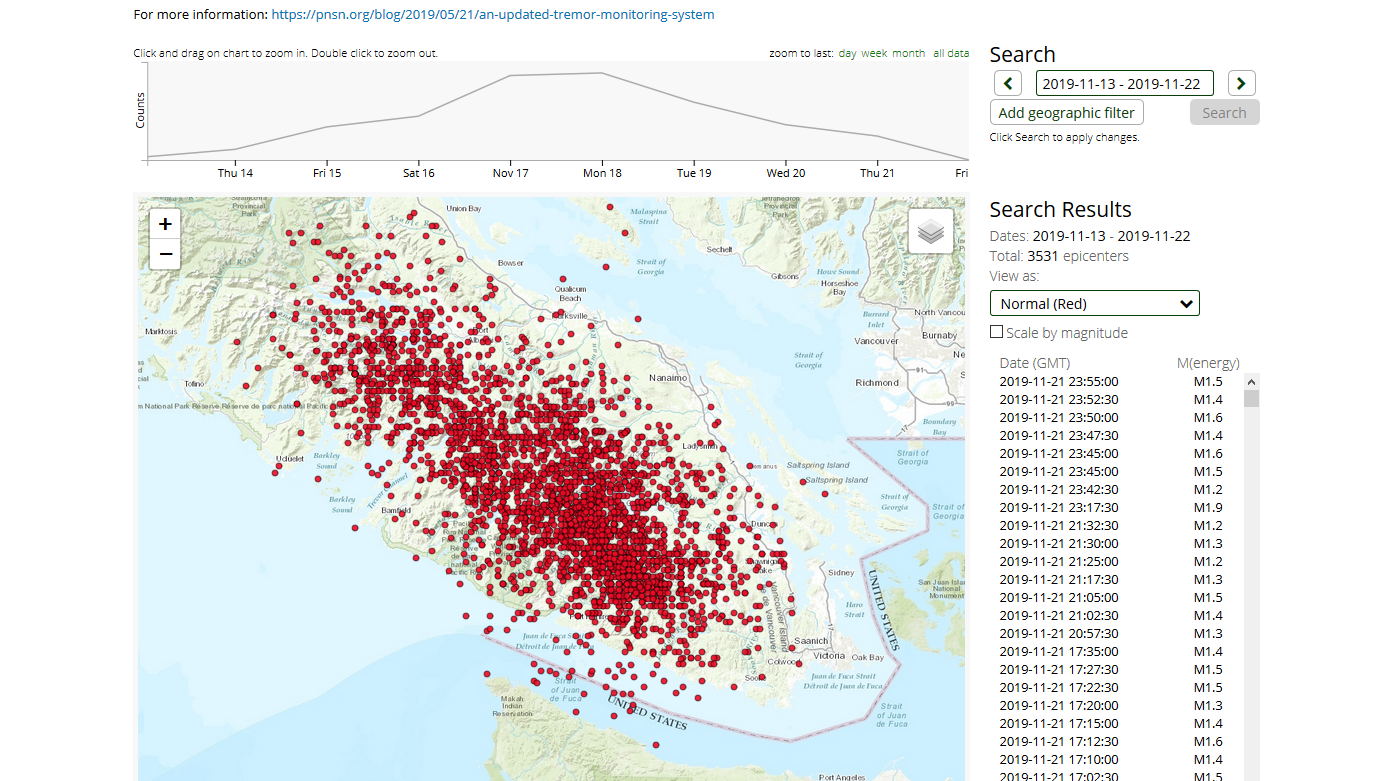 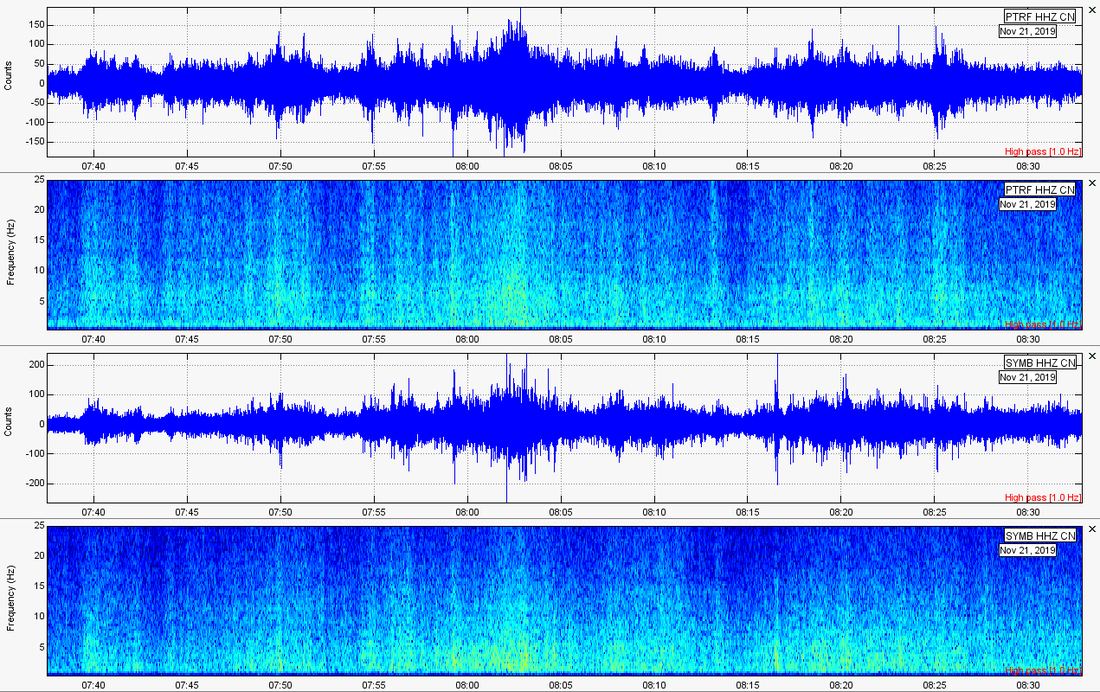 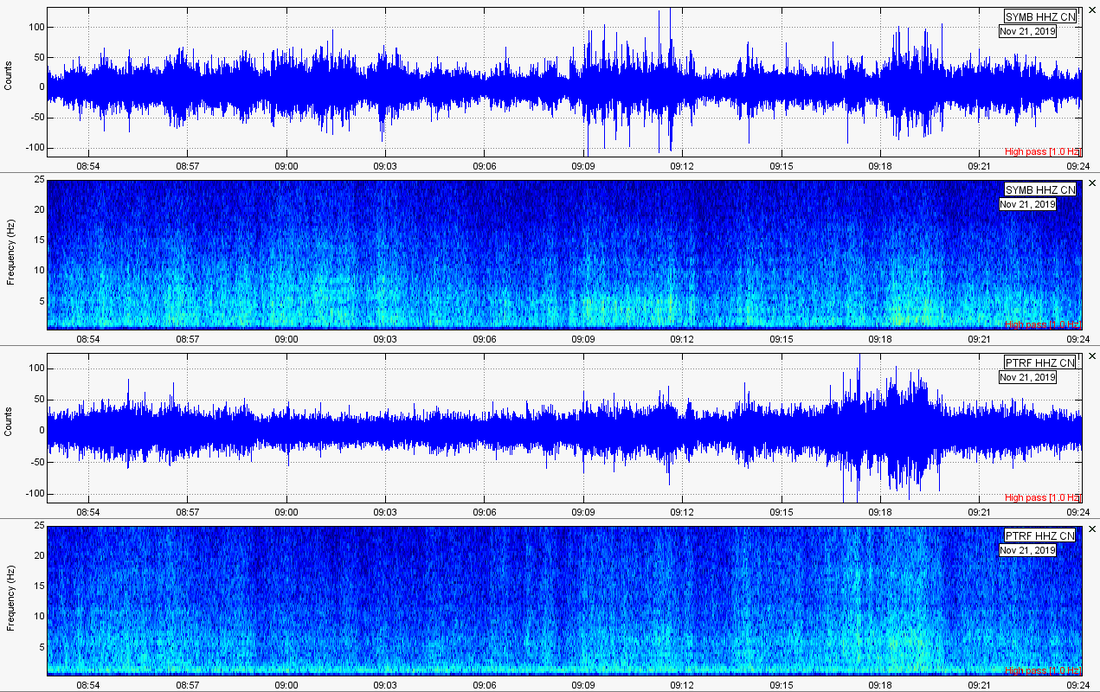 Example 2 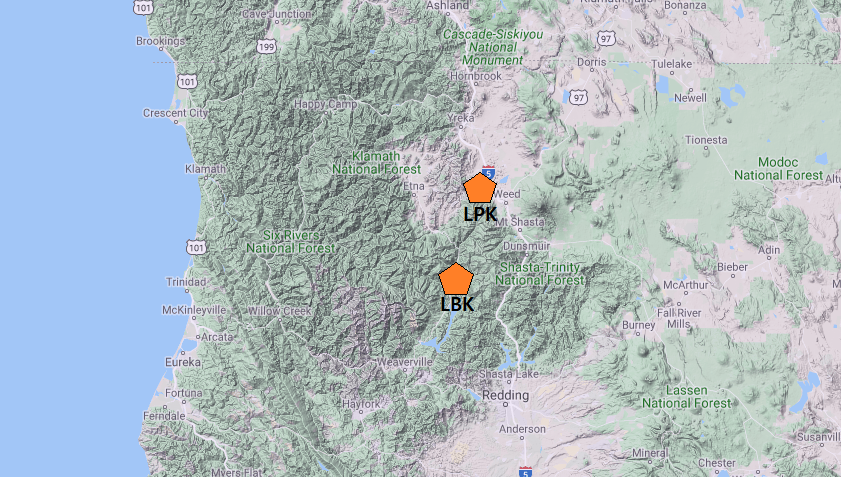 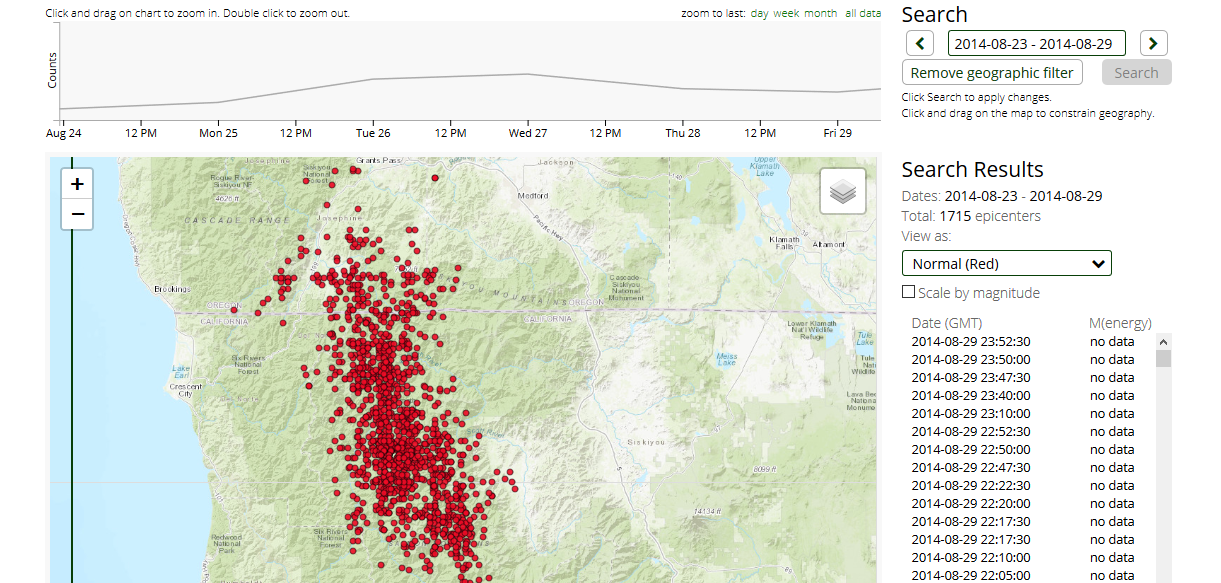 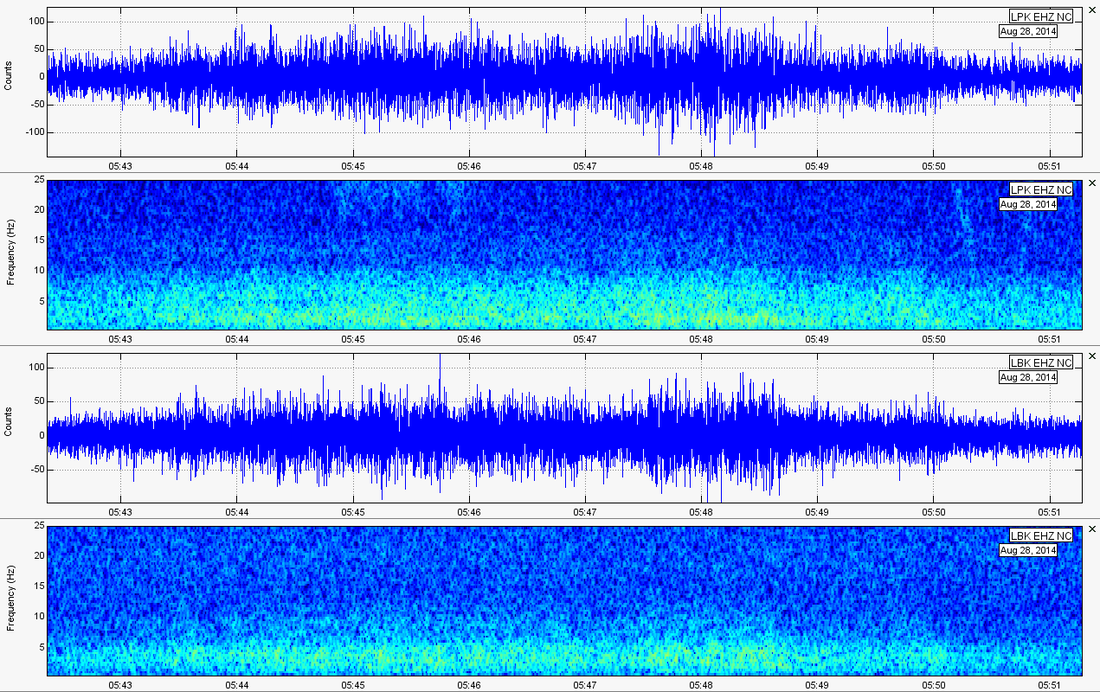 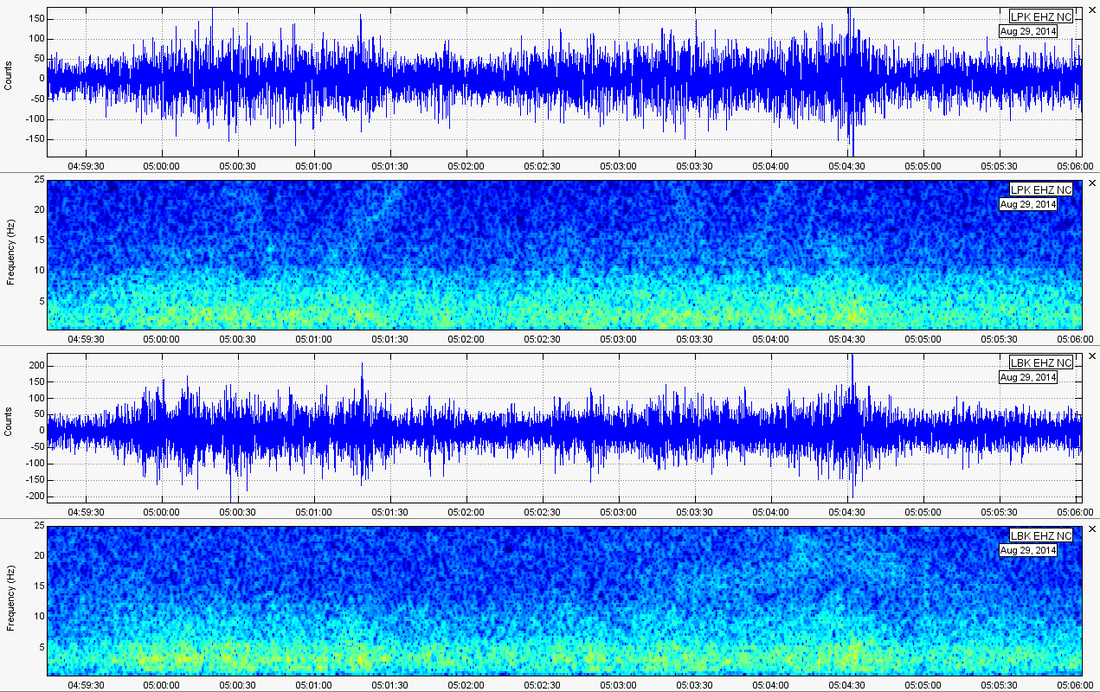 Example 3 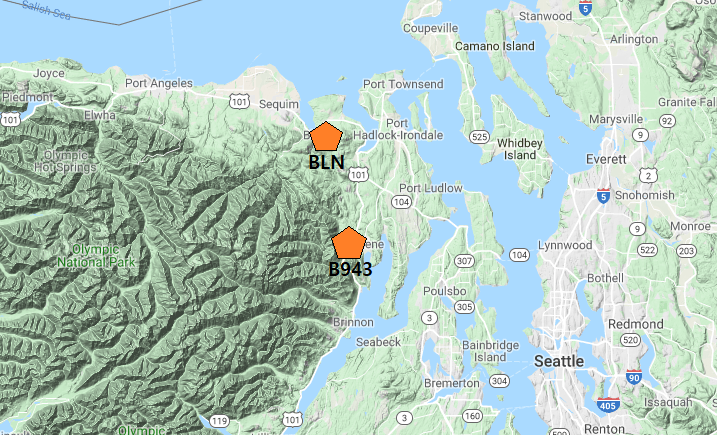 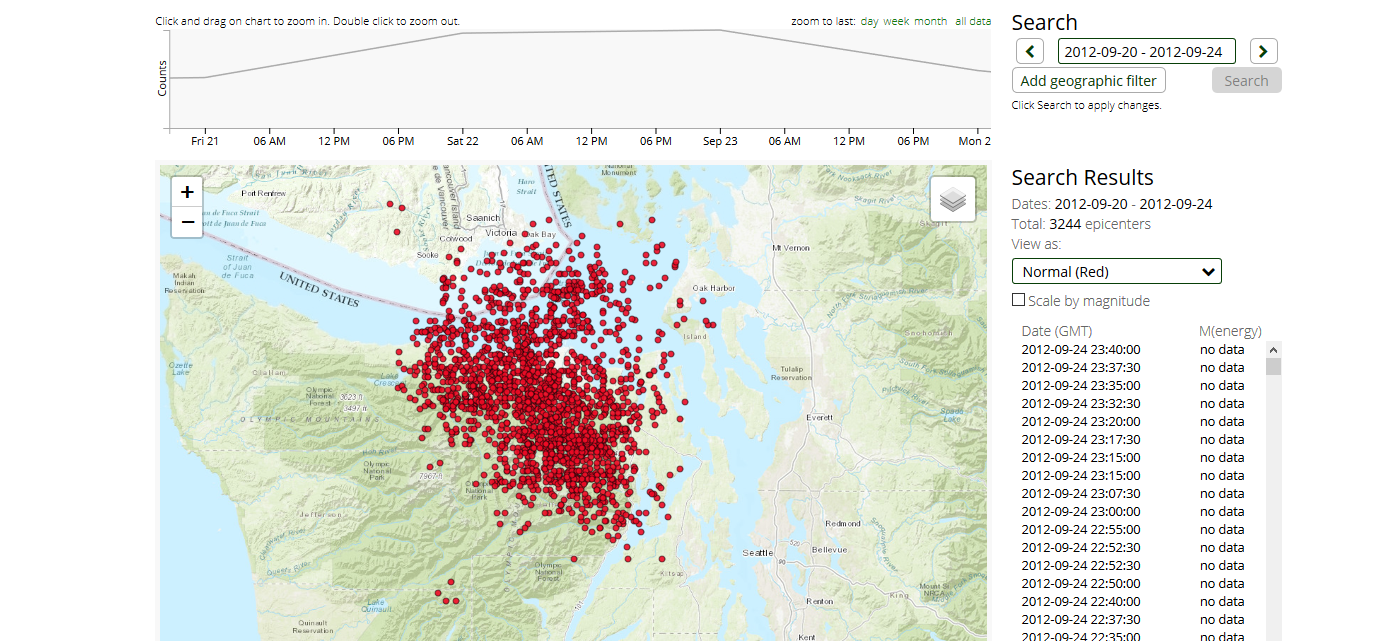 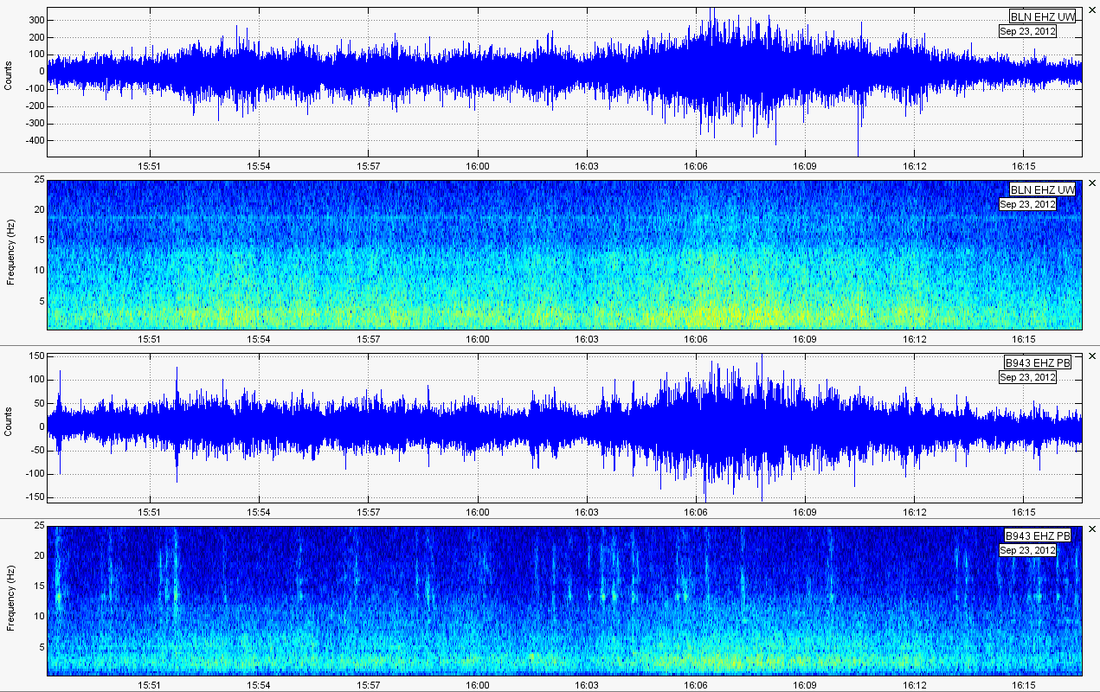 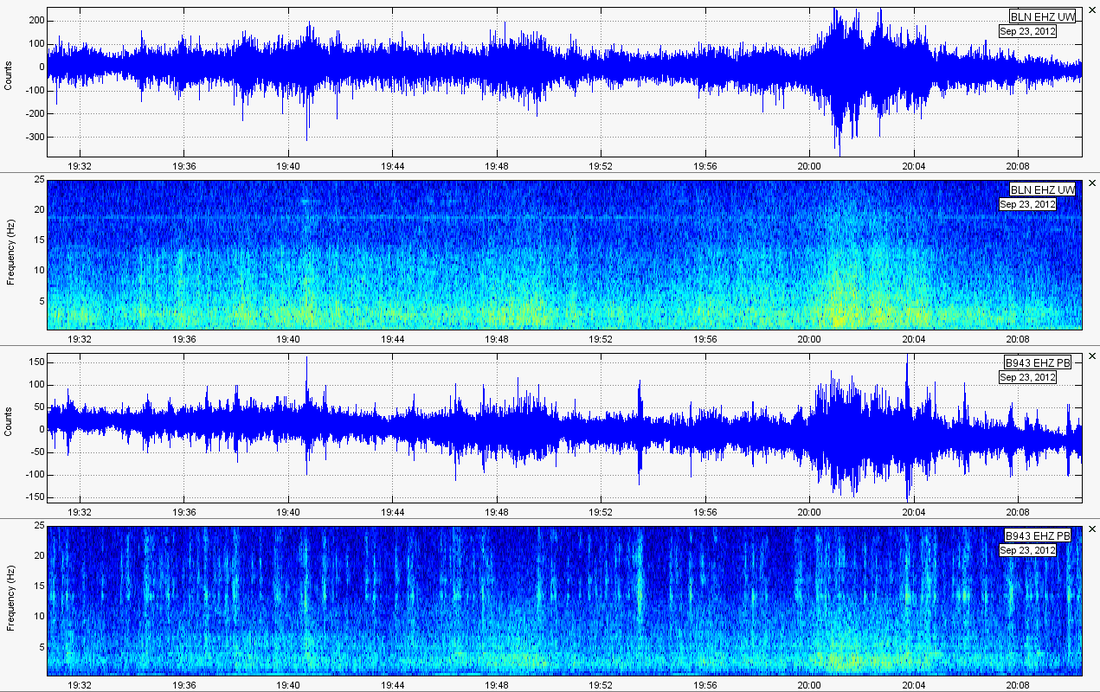 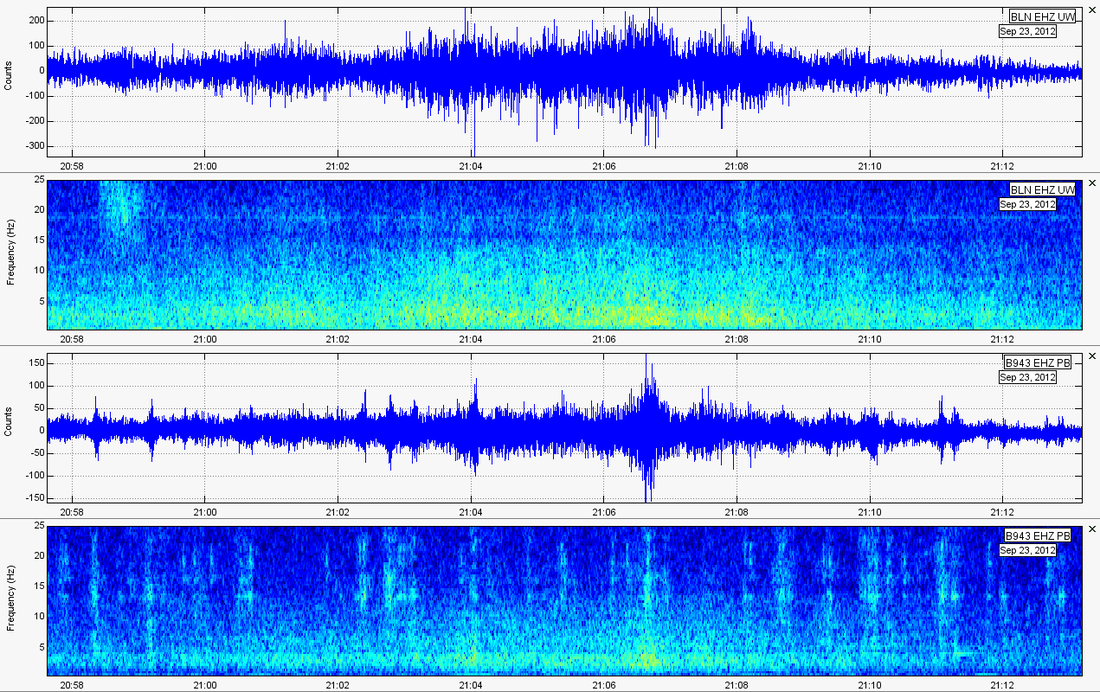 Tectonic tremor during ETS events carry low-mid range frequencies. They resemble volcanic tremor in some ways but are characterized by slightly higher frequencies that can reside above the normal margin for low frequency activity (<10Hz). As you can see above, some of the residual frequencies can reach around 20Hz at their weakest. Below is a closer look at the waveforms of tectonic tremor during ETS. The first two seismogram plots are showing a separate tremor from the last two seismogram plots. Remember to try all this yourself! It is a wonderful learning experience. 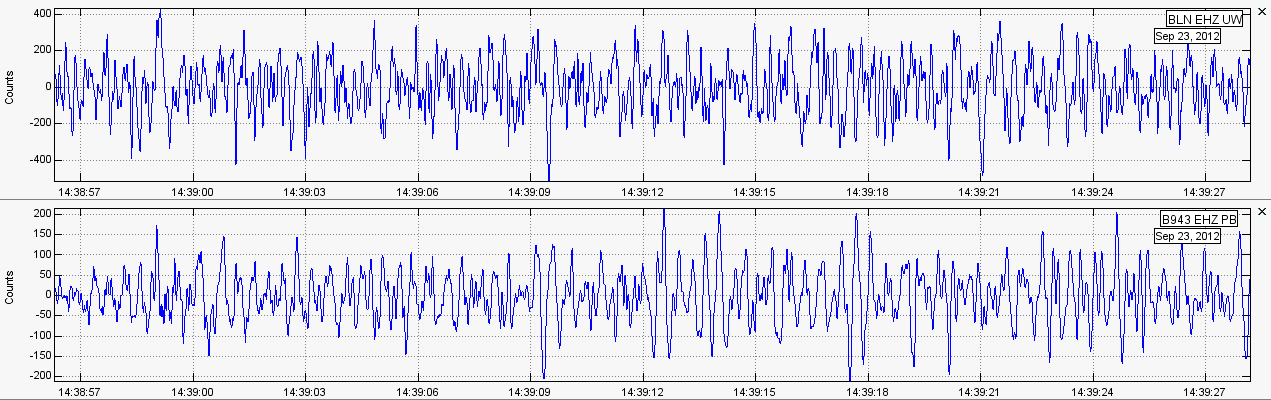 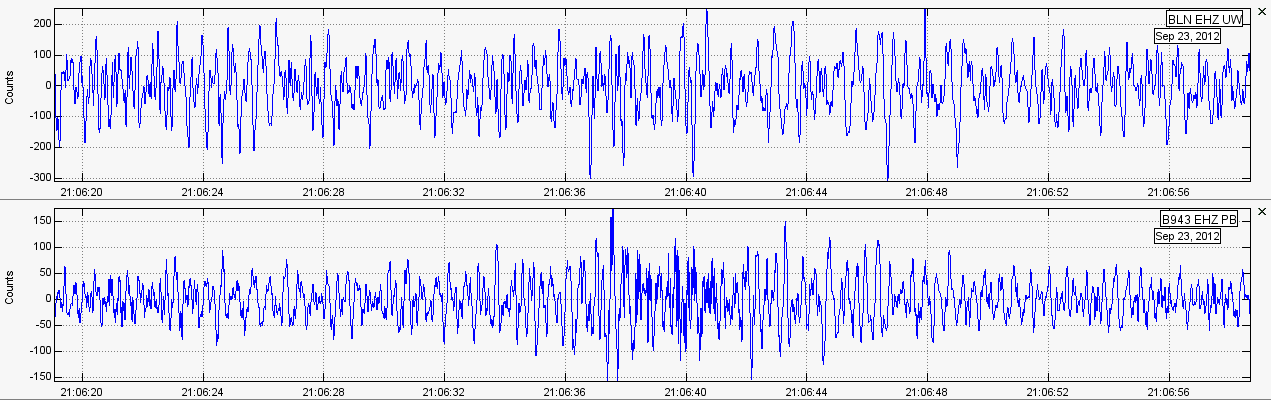
3 Comments
1/25/2022 12:56:50 am
This is a very informative—edifying article to all. Thanks a lot! Continue to post! 1/30/2022 10:01:00 pm
Thank you for sharing this informative one. 10/11/2022 05:39:42 pm
Great article! I had a good time browsing your website. I don't leave very often remarks, but you deservingly get a thumbs-up! Thank you for sharing your knowledge. Keep it up. Leave a Reply. |
AuthorBen Ferraiuolo is a fast learner and someone who will always stand for the truth. Visit "About Me" for more! Archives
November 2019
Categories |
 RSS Feed