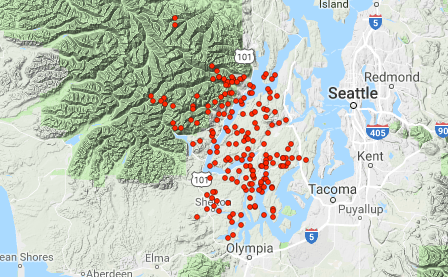
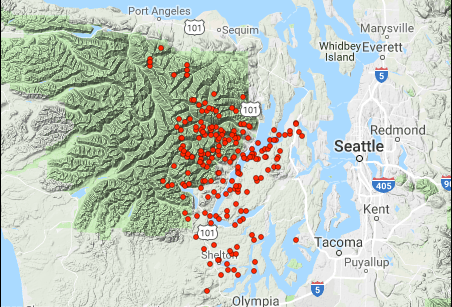
 I am very excited I got the chance to analyze this stuff guys! So, the eastern section of the Olympic Peninsula in Washington State has been seeing a strange ETS (episodic tremor and slip) event as of the past few months. It seems to surge at times and is early. Usually it happens every 14 months, but it is early this time. Maybe this is just a precursor to a very large ETS that is predicted to begin in the next couple months at the maximum. Episodic tremor and slip is a phenomena only recently discovered in 2002. Low frequency, non-volcanic tremor has been detected many times by seismic stations in WA, OR, and even northern CA. Large slip of the plates has also been detected during increased tremor activity. The two are most definitely connected. Although not proven 100%, I theorize ETS does increase the chance of a large earthquake striking. If these ETS events were not occurring, however, Washington and Oregon would be seeing a great many M6 and M7 earthquakes. This slow-slip is caused by a lubrication of the plates during the ongoing subduction process of the Juan De Fuca plate under the North American plate. The purpose of this post is to show a few examples of what low frequency, non-volcanic tremor looks like. I also give you the ability to listen to what the tremor sounds like. Please click the title of this post or "read more" to continue... 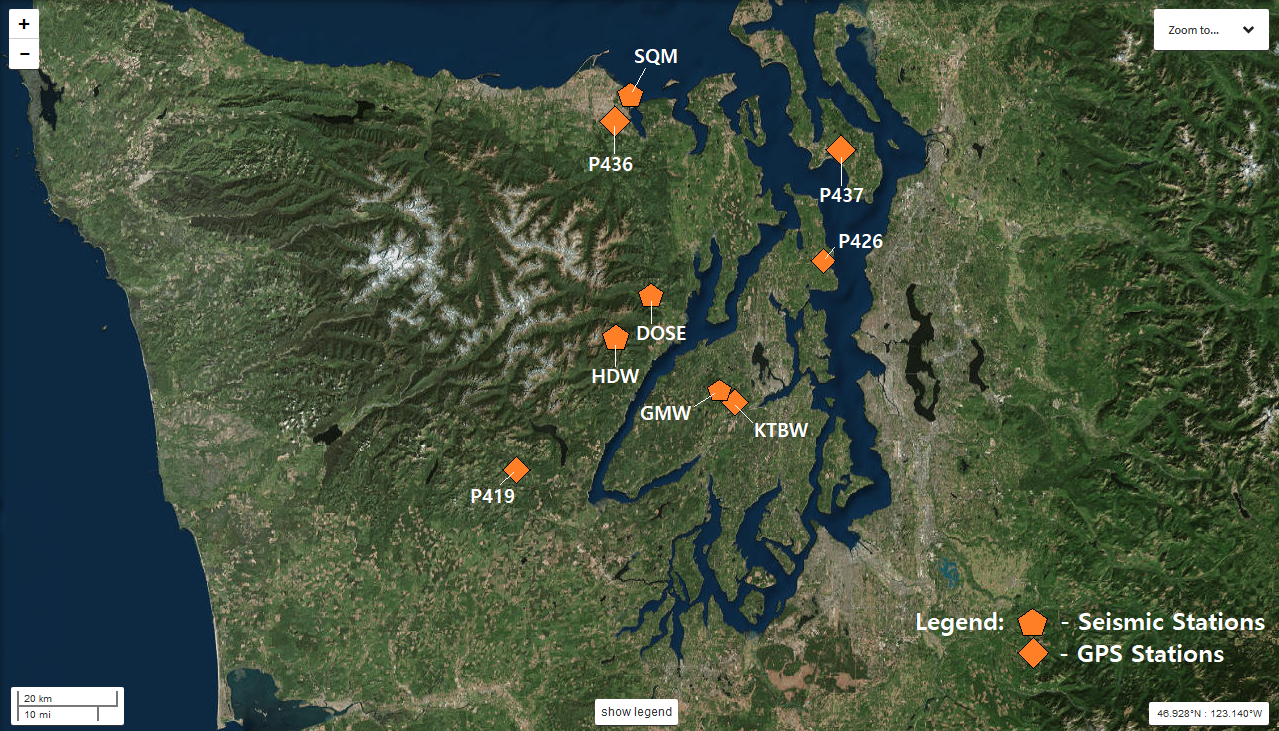 The image above shows the location of each seismic and GPS station I will use for anything shown in the post below. The most accurate seismic data, at least in my opinion, comes from stations HDW and DOSE. Those will be the only 2 stations I will use for the examples in the plots below. However I do briefly show some data from the other 2 seismic stations labeled above. For the past few months, ETS (a.k.a. slow-slip) has been increasing across parts of western Washington mostly along the eastern half of the Olympic Peninsula. I live just 20 miles NE of Seattle so this activity is occurring very close to where I live. If you do not know what ETS (episodic tremor and slip) is, then please CLICK HERE for a simple explanation or CLICK HERE for a more in depth list of research papers. Briefly, ETS (episodic tremor and slip), also known as slow-slip, occurs in Washington, Oregon, and even parts of northern California approximately every 14 months. The tremor is theorized to be fluid (possibly magmatic or hydrothermal) lubricating plate motion as it increases it's movement. This happens along subduction zones across the planet, though in different forms. Sometimes with tremor and sometimes without. The recent episode that is currently ongoing has had periods of intense tremor and slip intermingled with periods of near-silence. In this post I simply want to show some examples of what low frequency, non-volcanic (tectonic) tremor looks like via seismogram, spectrogram, and spectra plots generated from seismic data. I will also show you what tectonic tremor along the Cascadia Subduction Zone sounds like. If you wish to skip to that now, simply scroll to the end of this post and watch/listen to the video. I will not show a huge amount of plots, but I will show enough. I really want you guys to learn how to download and analyze the data so you yourself can check this stuff out. This is the first time I have ever tremor associated with slow-slip. That being said, I wanted to get a professionals opinion on all of this before I moved forward with this data. I sent a few of the samples shown below to Professor Emeritus Steve Malone from PNSN and the University of Washington. He confirmed my findings were indeed low frequency, non-volcanic tremor. Resources: -Realtime ETS tremor map: CLICK HERE -PANGA realtime short-term GPS monitoring: CLICK HERE
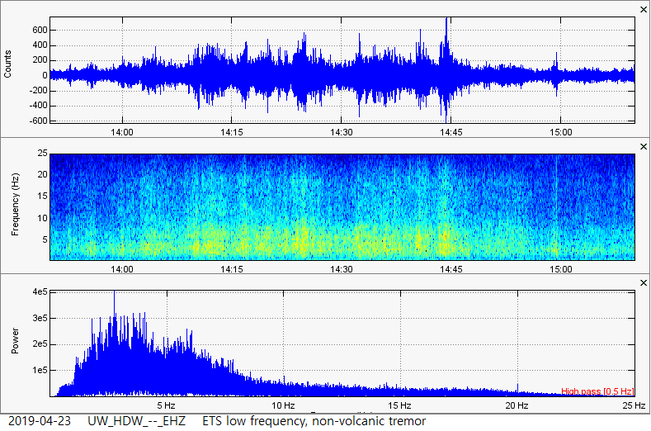
Now below I am going to show 3 examples of low frequency, tectonic tremor during the late hours of April 22, 2019 and the early hours of April 23, Pacific Time. All 3-plot images are in UTC, which is ahead of Pacific Time by about 7 hours, so that is why some say April 23 when really it was still April 22 for us here in Washington State. First, here is a slideshow of 24 hours worth of real-time GPS data from PANGA. If you wish to visit the site where I got these plots from, please look at the links under resources above. The approximate time of the last reported data, all the way to the right, is labeled. Also, "m" means meters and "cm" means centimeters. North means north/south horizontal deformation, east means east/west horizontal deformation, and up means vertical (uplift/subsidence). Note the major changes are shown on each plot, proving these are real events. These stations are labeled on the map in the beginning of this post. Here are the helicorders for the 4 stations labeled on the map in the beginning of this post. Although you might think most of what you are seeing is emergent surface noise, think again! The large majority of the activity you see, especially on GMW, DOSE, and HDW, is very real and is considered low frequency, non-volcanic (tectonic) tremor. I want to again thank Professor Emeritus Steve Malone, of the PNSN and University of Washington, for taking the time to reply to my email and confirm my findings. I truly had a lot of fun analyzing these events! Geez, I am quite the geek for seismology, huh? Also, the helicorders shown below are in slideshow format which can be skipped through or paused. Keep in mind SQM might be too far away to detect most of the tremor events, although it did slightly detect some of them. The other 3 stations detected it quite well and notice how it really does look like surface noise? Well with the confirmation and with the power of station cross correlation, it is obvious these tremor events are very real and do coincide with increased slip. It is interesting to note that it seems, at least in my opinion, that the tremor events start approximately 15-45 minutes prior to the actual slip occurring. Maybe I made a mistake? I don't think so but it is possible. Maybe the tremor is a sort of calling-card to the actual slip. Of course both do occur around the same time, but according to the seismic and GPS data it does seem like the tremor starts first, and then comes the slip. If you have any thoughts on this, please feel free to let me know. 3 Examples I am going to show you 3 examples of what tectonic tremor looks like on seismogram, spectrogram, and spectra plots generated from seismic data. All data is free and so is the program SWARM, the program I used to analyze these events. I will use data from HDW and DOSE, since I believe those were the best stations to use to plot these events. But first, I will highlight the 3 tremor examples on the helicorder and GPS deformation plots below. Note how on the GPS plot you can see the tremor does occur right before/during increased slip. And the slip is not minor, oh no folks! It is actually slipping at a fairly moderate-major rate. Now I am no geodist, but I can read GPS plots and have a very rudimentary knowledge of historical slow-slip events via GPS deformation instruments. But this amount seems consistent with past ETS events, at least somewhat. But still, please thank God that we have lubricated plates! I know it sounds funny, but if we didn't then we would be seeing many M6 and M7 earthquakes occurring on a far more regular basis than we see now. The example plots for each example will be shown in slideshow format. You can skip through the images or pause at any time. Afterwards, you get to hear what tremor example #2 sounded like! Spoiler alert: it sounds AWESOME! 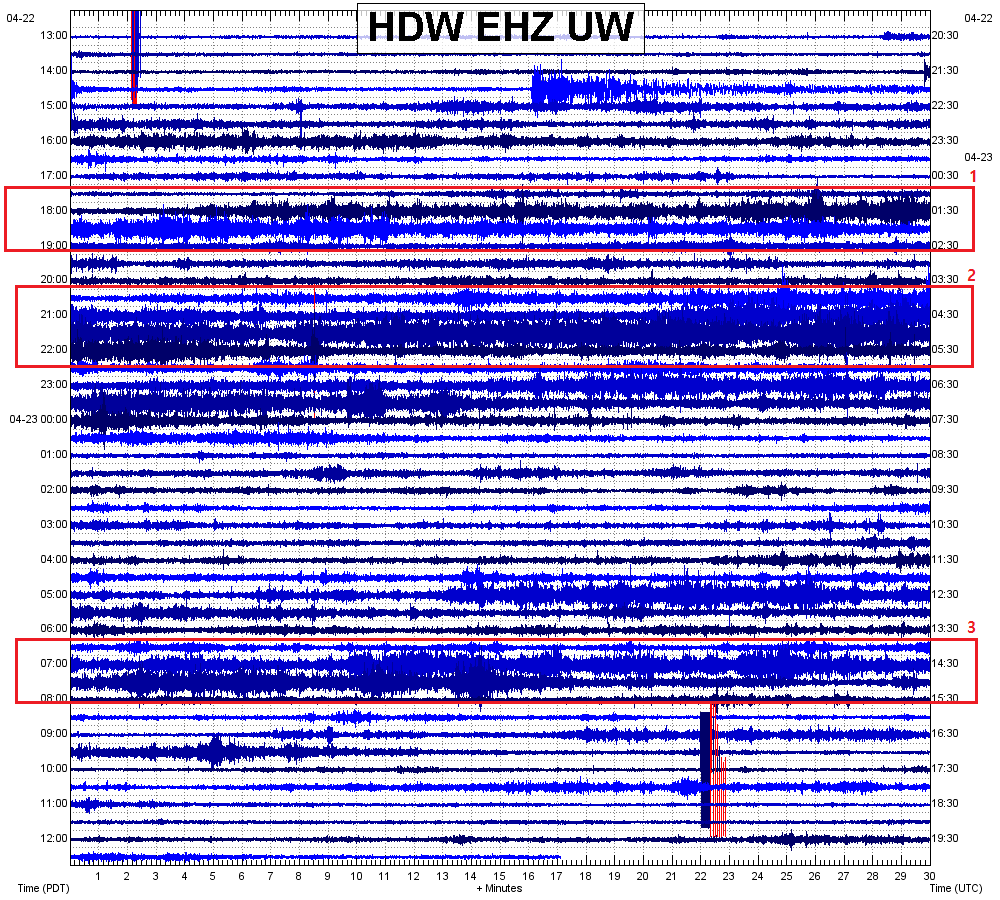 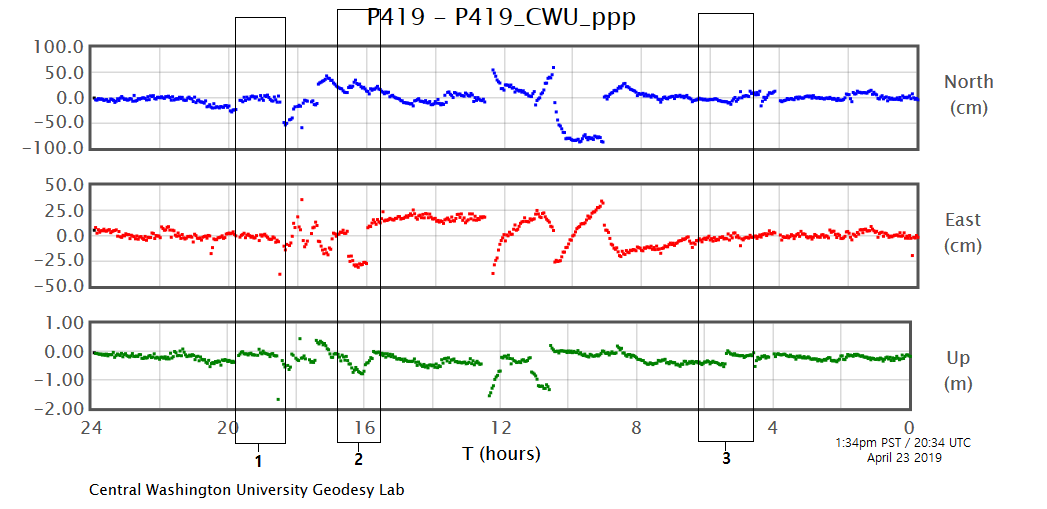 Example 1 Example 2 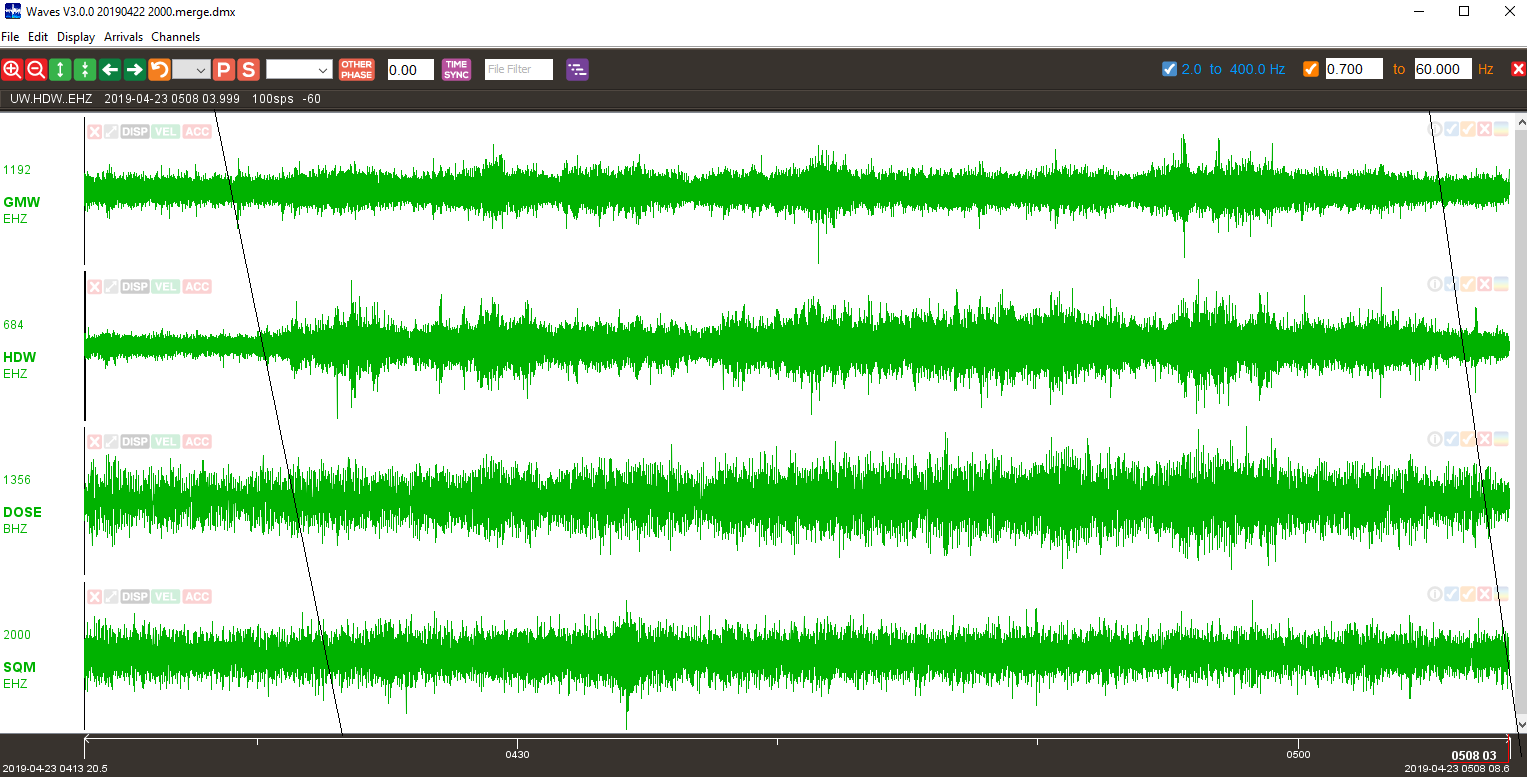 Tremor example #2 via the program WAVES. Note how 3 out of 4 (possibly all 4, though it is hard to tell) stations detected this tremor right where it should be. Although much of this activity does resemble surface activity, we know that it is low frequency, tectonic tremor. Always cross correlate whatever you see across multiple stations!!! Example 3 Seismic Audio of Tectonic Tremor Here is the video where you can here the seismic audio of tremor example #2. Please CLICK HERE to visit this video on my channel to show your support! I highly suggest using headphones, but please be wary of the volume!
0 Comments
Leave a Reply. |
AuthorBen Ferraiuolo is a fast learner and someone who will always stand for the truth. Visit "About Me" for more! Archives
November 2019
Categories |
 RSS Feed