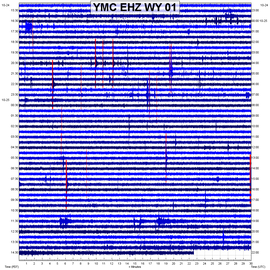
 Seismic activity seems to have increased once again at Yellowstone! From 3:17pm Mountain Time October 24, 2018 (21:17UTC October 24, 2018) to 9:06am Mountain Time October 25, 2018 (15:06UTC October 25, 2018) there were two areas that saw an increase in activity virtually around the same time. The Maple Creek area saw an increase as well as the West Thumb lake area. However the earthquakes that occurred near West Thumb lake occurred farther south than we usually see. Seismic station YDD, which resides just a few miles south of YLT, saw these earthquakes arrive first. To continue this post, PLEASE CLICK THE TITLE ABOVE OR CLICK "READ MORE" BELOW! Below I will show some seismogram/spectrogram plots, with a couple select helicorders first, of the majority of the earthquakes to occur within the time period stated above. Since there were two distinct areas of seismicity, I will first start with the earthquakes that occurred somewhat near West Thumb, in my opinion just about 5-10 miles south of West Thumb lake. I will then show the earthquakes that occurred near Maple Creek. Please remember to always read chart labels FIRST and always pay attention to time periods! Also, please pay attention to any captions that you may see below any image. They contain important information as well! Also if you ever want to know which seismogram/spectrogram plot you are looking at, in regards to the helicorders, all you have to do is compare the times on the plots with the times on the helicorders. All seismogram/spectrogram plots shown in the West Thumb section below are from seismic station YDD, the station where the earthquakes arrived first. West Thumb Quakes: 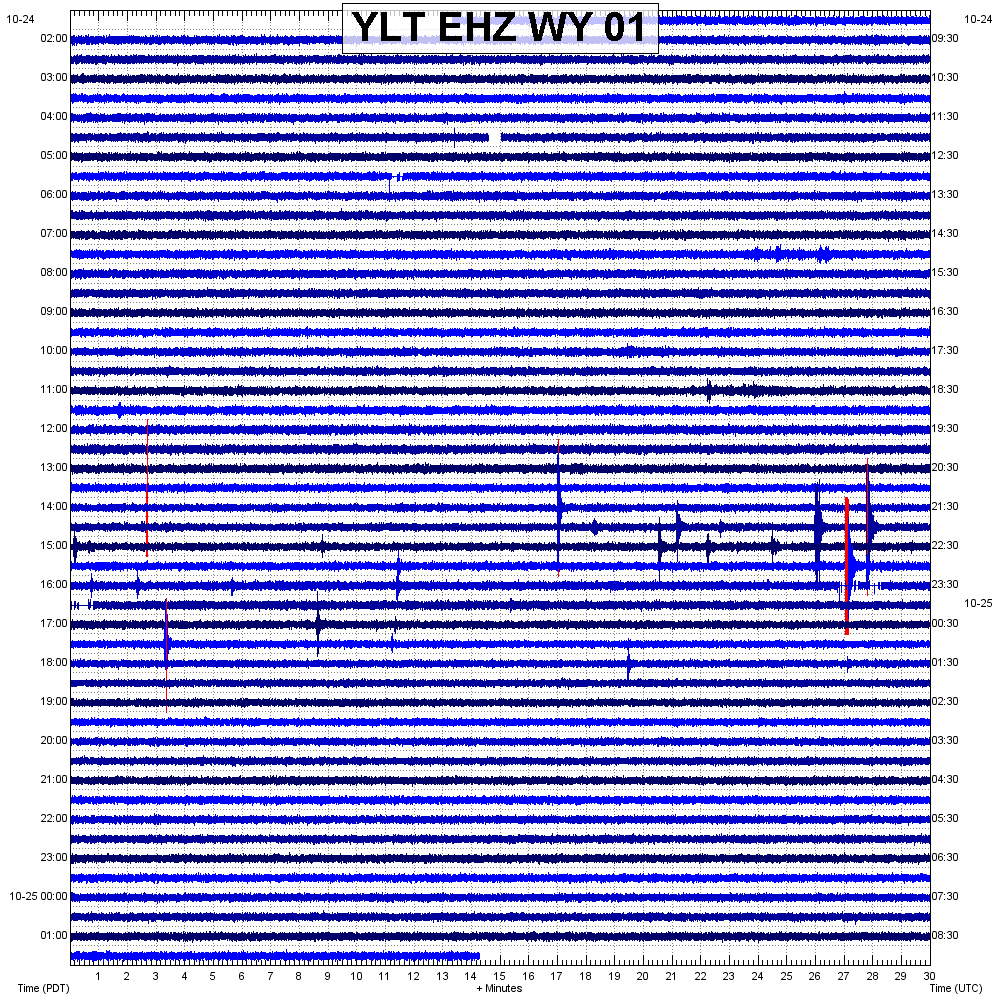 You can clearly see these earthquakes here. They are bunched up in a small space of about 4 hours or so and total at about 12 earthquakes. Most were very small, most likely around 0.3-0.8 magnitude. (That was just an educated guess.) 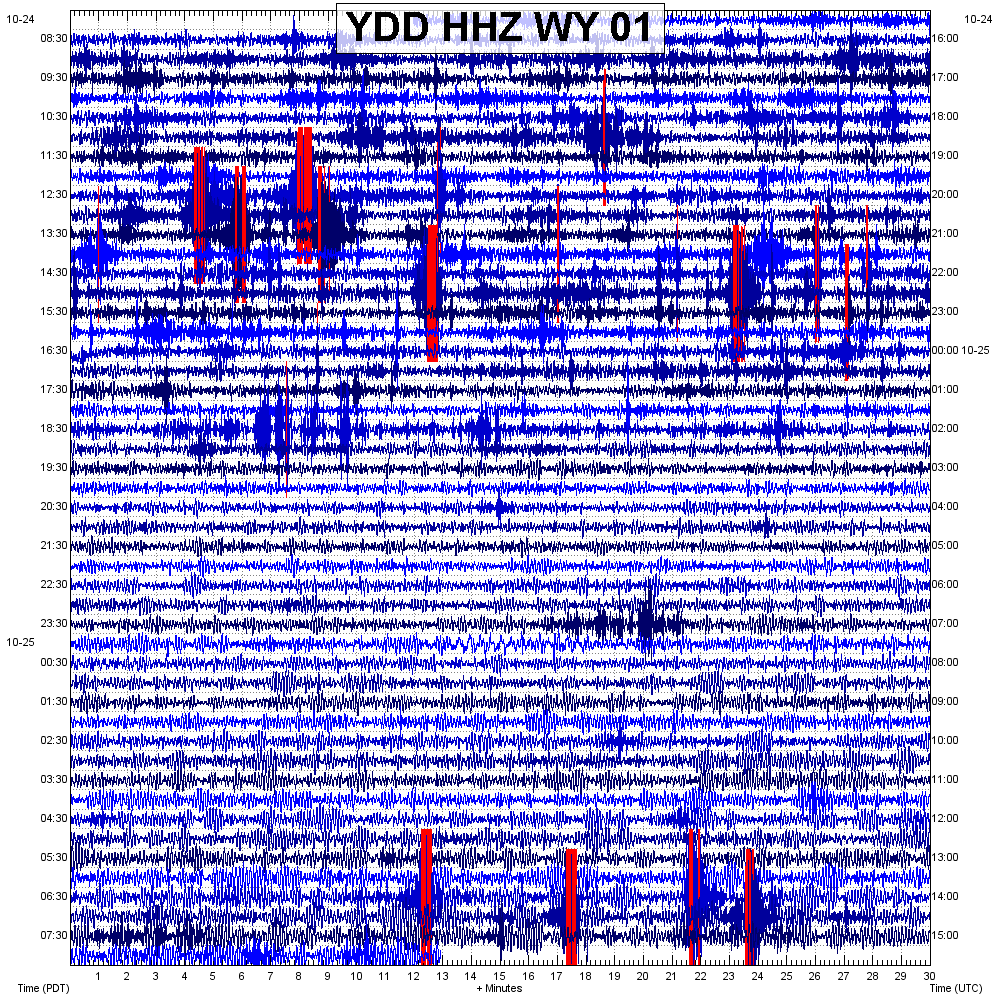 This seismic station, as you will see in a bit, resides just south of YLT at West Thumb lake. The earthquakes here are harder to see due to the increased microseisms and background noise, which is generally picked up better with HHZ or BHZ channels. 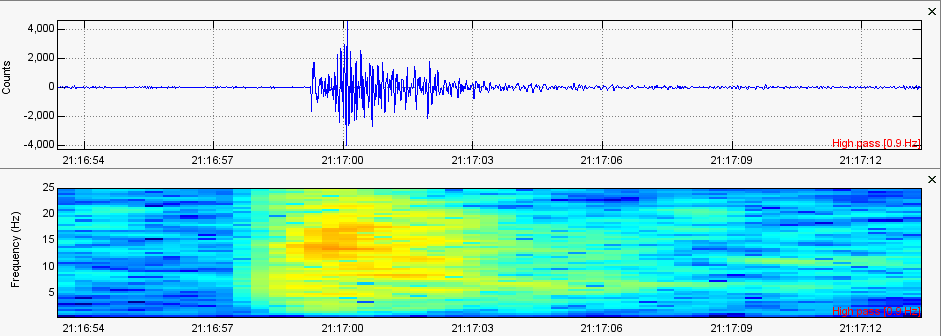 High frequency VT quake that does not surpass about 4,100 amplitude count. 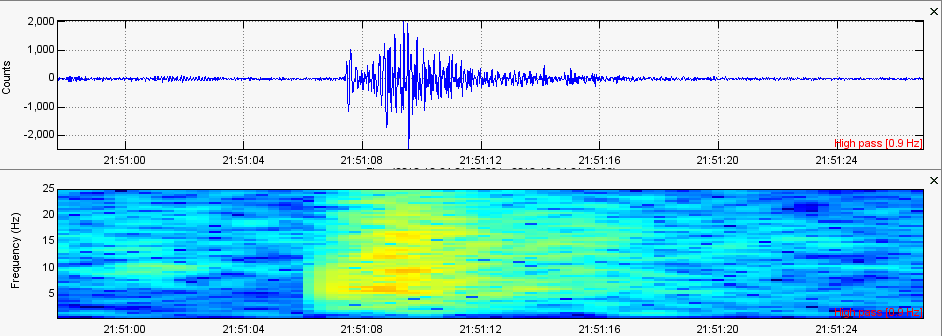 Another high frequency VT quake that appears almost identical to the one I just showed. Note that the amplitude is half that of the previous plot. 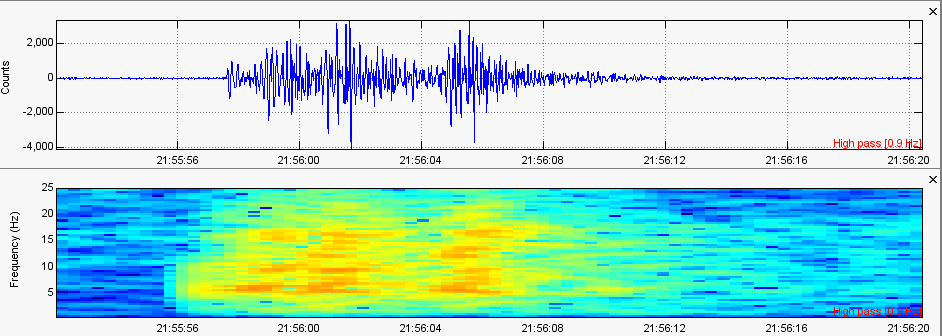 This one is a little more interesting. First notice on both the seismogram and spectrogram plot it almost looks like 3 separate earthquakes occurred in about 15 seconds! That is absolutely fast but you can clearly see 3 distinct increases in initial energy. To me it really does look like 3 closely spaced events. Also note the dominant frequencies are slightly lower than what we have previously seen. However this event was extremely small with a total amplitude count of 2,000. 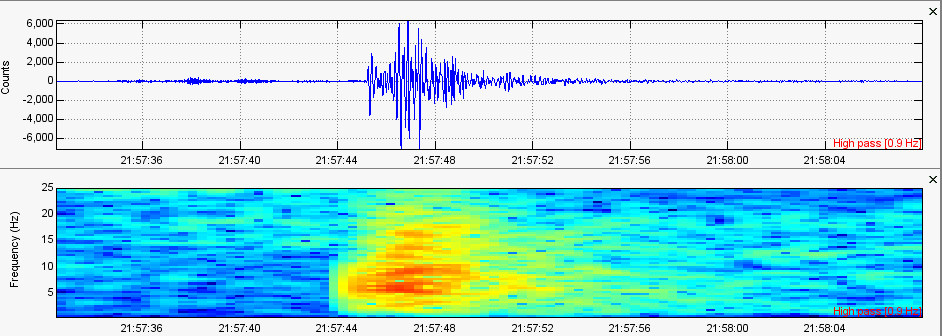 A mid-range frequency earthquake that does not surpass 6,000 amplitude count. 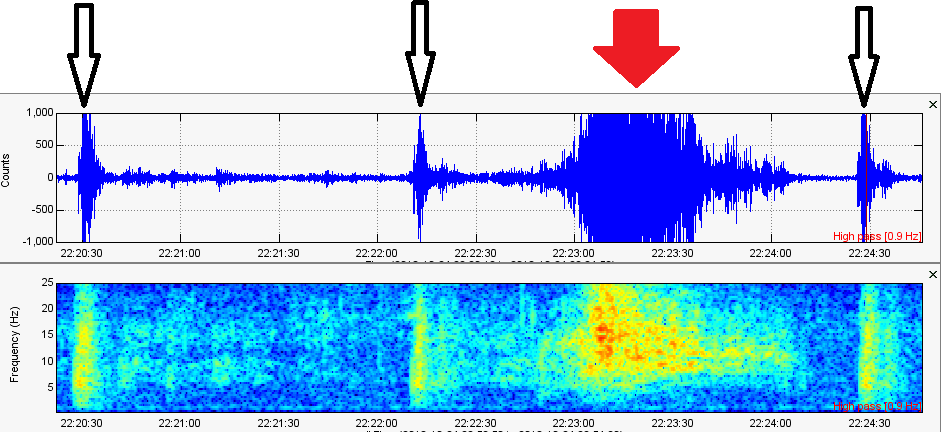 3 high frequency VT micro-quakes. The 3 black arrows point to the micro-quakes and the red arrow shows a surface event (such as a car, herd of bison, etc...). The surface event does not show on any surrounding stations therefore dubbing it "surface noise". 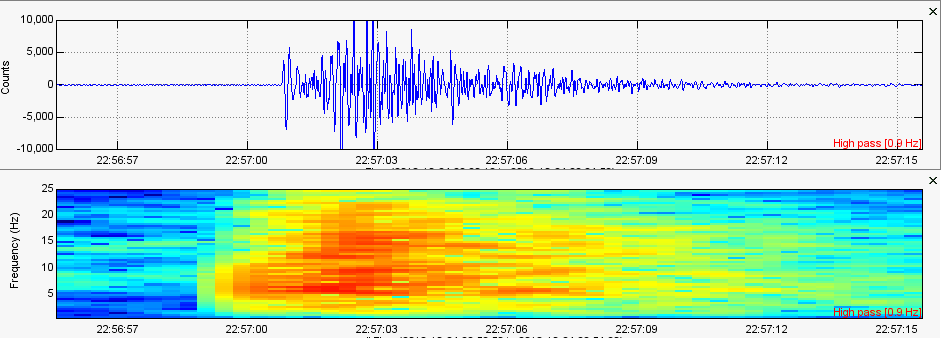 This is the largest earthquake to occur within this time period within this location. It appears to be yet another high frequency VT earthquake with amplitudes reaching to exactly 10,000 count. Now where did these earthquakes occur??? Well using P wave cross correlation I determined that YDD saw this swarm the strongest and even picked up the P wave first out of all surrounding stations. 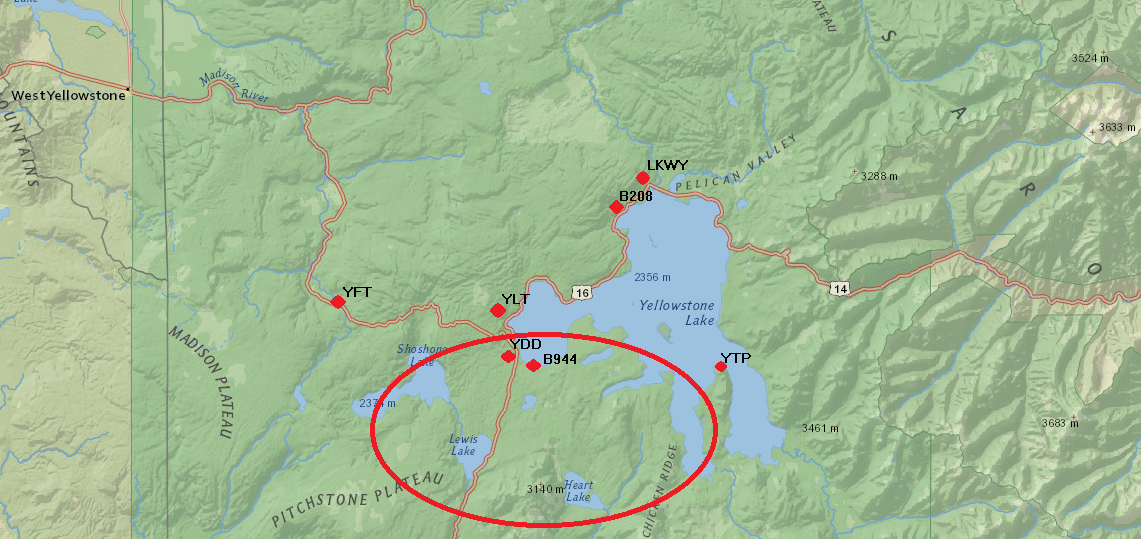 Here I have a custom image of Yellowstone and most of the surrounding stations for the West Thumb area. Since I can locate P wave arrivals but still have trouble locating S wave arrivals, I cannot locate earthquakes down to the latitude and longitude... Yet. However, since I can locate P wave arrivals and cross correlate them on multiple surrounding stations, I can give people at least an idea of the general location where these earthquakes occurred. So the circle you see in the image directly above is the probable area of the epicenters for the earthquakes to occur near YDD during this time period in question. I believe the epicenters lie just south of YDD somewhere to the left of the center of the circle. Earthquakes Near Maple Creek: Now the increase of seismic activity near Maple Creek occurred almost right after the seismic activity decreased near the West Thumb lake area. Sadly, only 3 earthquakes have so far been reported by the University of Utah and USGS even though some of the unreported quakes obviously were large enough to be accurately located. Below I will first show the helicorders for YMC (Maple Creek), the station that picked up the arrival of these quakes first, and for YGC (Grayling Creek). YHH (Holmes Hill) will also be shown. Most people don't even know about the extra seismic stations that exist at Yellowstone. You won't find station YGC on any website, that is for sure! For some reason it is very secluded but it does record live data (as you will obviously see in a second). You will see the location for YGC at the end of this post, however it did not pick up the earthquakes as well as I had hoped. Want any data that you cannot find? Feel free to shoot me an email. Since these earthquakes I am about to show appeared first on YMC, I will use YMC for any seismogram/spectrogram plots shown below. Again, heliplots (helicorders) will be shown first and then seismogram/spectrogram plots. REMEMBER to please always read chart labels FIRST, pay attention to time period, and read any image captions that you may see. For October 25, 2018, as of the time I am writing this, USGS only reported the earthquakes that occurred at 3:42, 5:34, at 15:06UTC. As you can see below, many more than just 3 earthquakes occurred. Using P wave correlation I deducted that about 10-13 quakes occurred, many of which were very small. However some were much bigger, big enough to be located for sure. 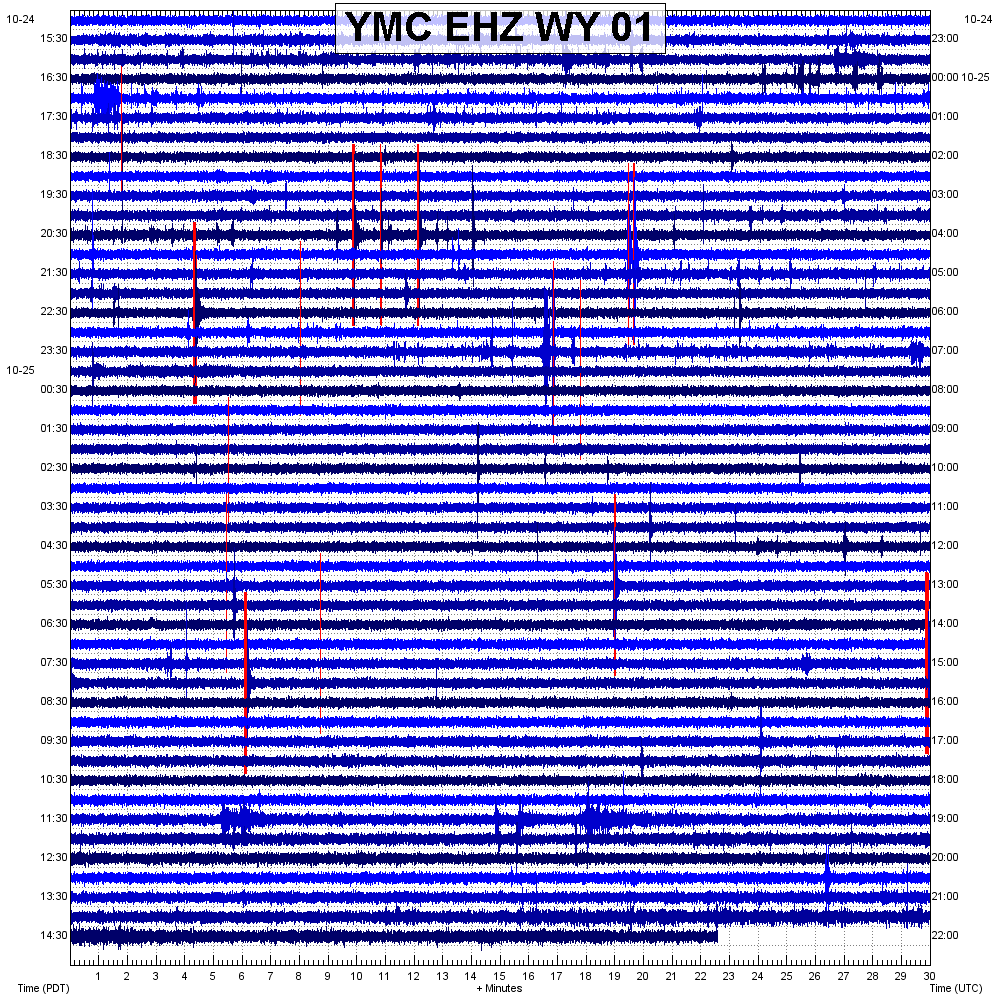 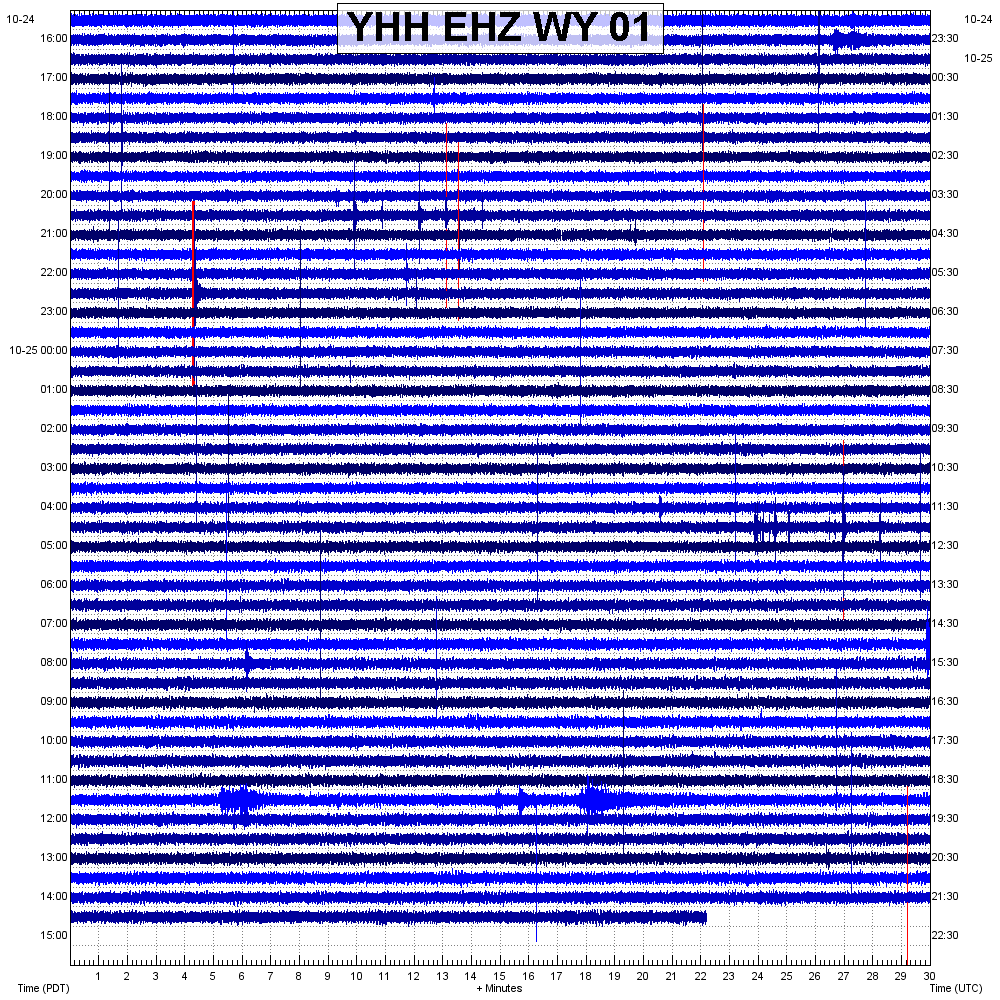 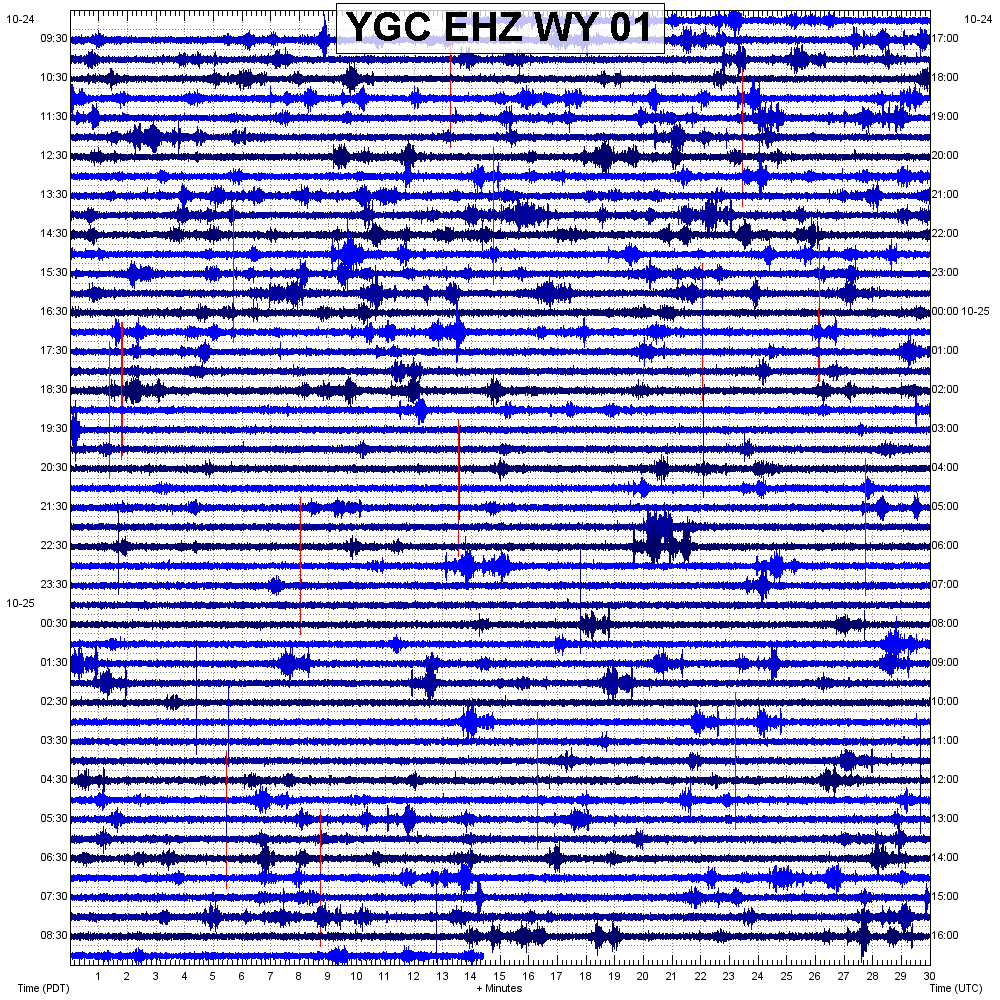 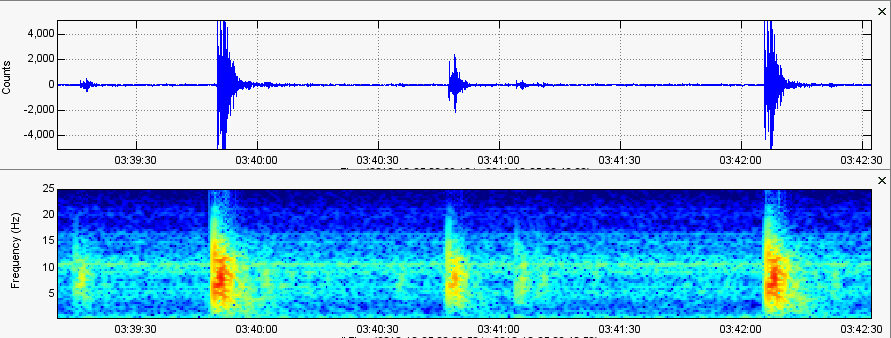 Here you can see about 4 mid-range frequency earthquakes. Of course the weaker frequencies reach to about 25HZ, but dominant frequencies seem to remain below the 15HZ line. Also note the amplitude of these events are fairly small, with the largest of this plot reaching 5,000 amplitude count. The earthquake at the end of this plot was the earthquake that was reported. By then why was the earthquake, that occurred just two minutes earlier, not reported? It obviously shows just as strong as the 3:42UTC quake. 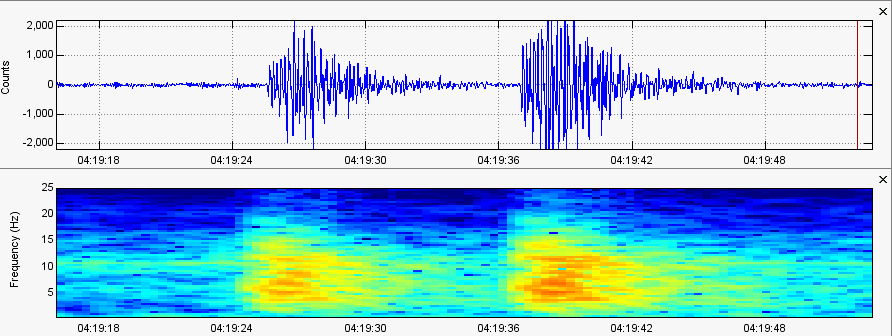 2 micro-qaukes occurred here within about 16 seconds. Mid-range frequencies once again. 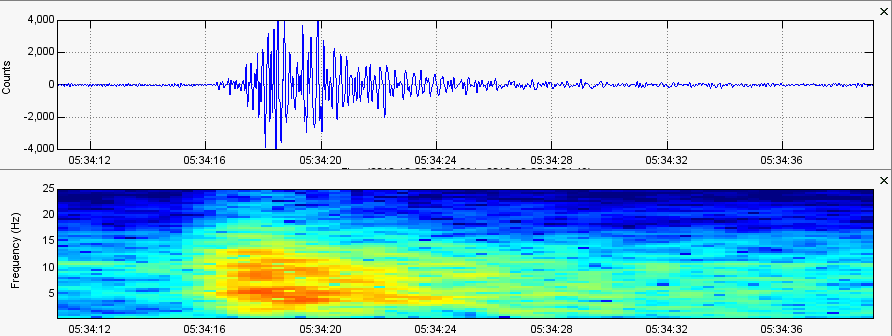 Another slightly larger earthquake with dominant frequencies below 15HZ. This was only the 2nd earthquake reported for this time period and location (so far). 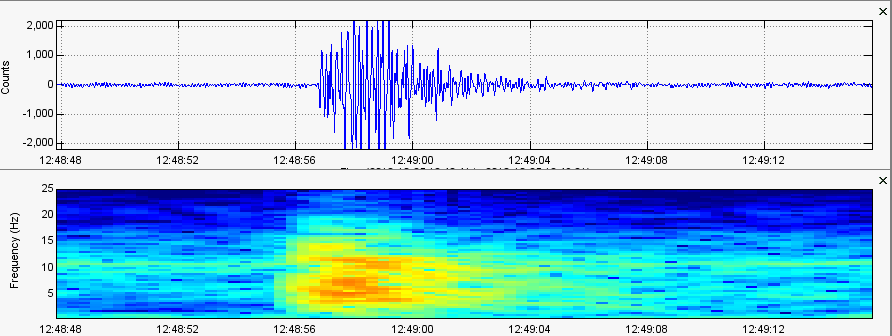 A small micro-quake with dominant frequencies below 15HZ. 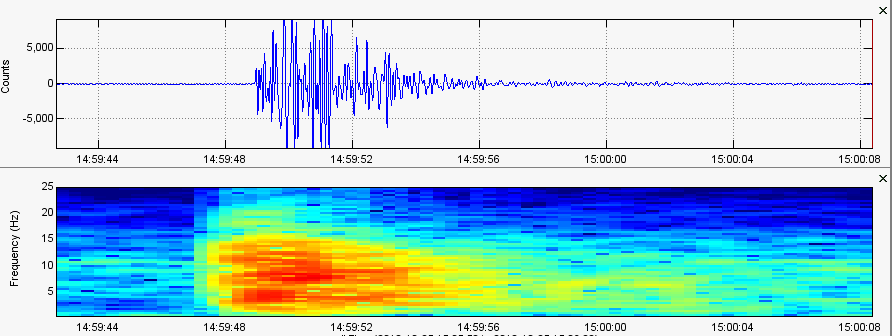 This earthquake reached about 10,000 amplitude count with dominant frequencies at and below 15HZ. This one was for sure strong enough to be located but why was it not reported (so far)? 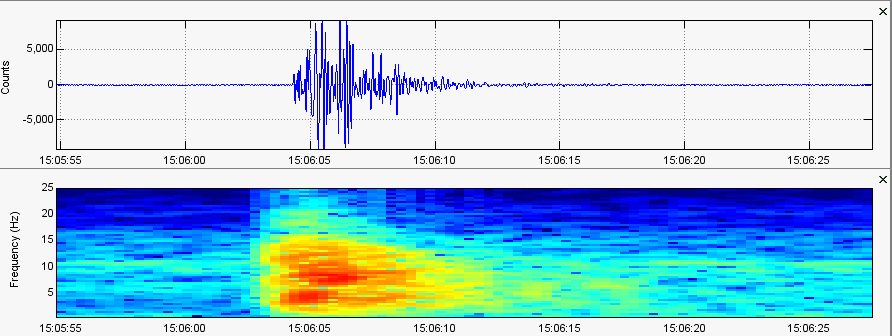 Now this is only the 3rd (and so far the last) earthquake reported by USGS. It is almost identical to the one previously shown. Note the amplitude reaches beyond the plot shown, all the way to 10,000 count. Also notice the frequency range is virtually identical to the plot I just previously showed. The reported earthquakes were shown to occur pretty much directly at Maple Creek, right at station YMC. 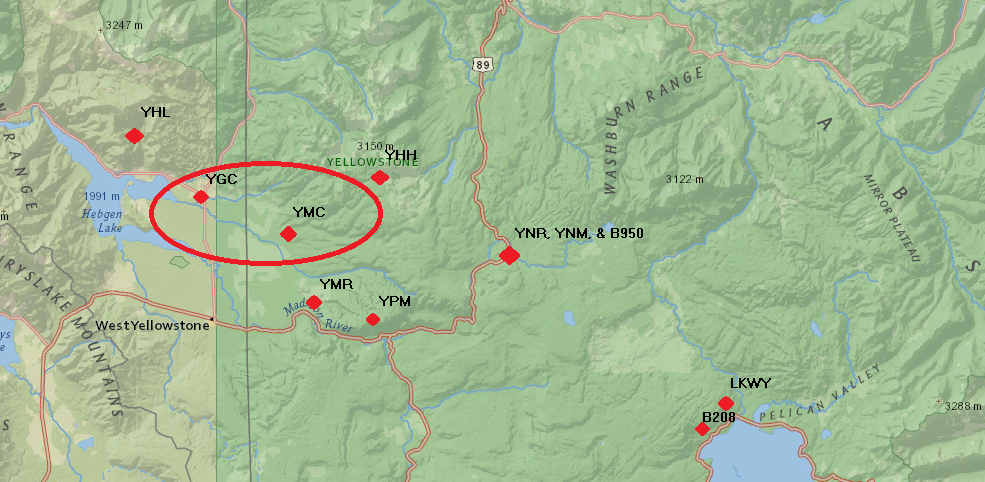 First, you can see the location of seismic station YGC above. According to the P wave arrivals on surrounding stations, and the 3 reported earthquake locations, this circle shows the high probability area for the epicenters of all earthquakes to occur within this time period. Well, this is it for now! Thank you for reading. Do you think seismic activity could be building towards a major swarm? That is something I have theorized for about the past month or so. Regardless, Yellowstone and many other volcanoes need to be monitored very closely especially with the increase in volcanic and tectonic activity over the past 100 years throughout the world. Have a good day!
0 Comments
Leave a Reply. |
AuthorBen Ferraiuolo is a fast learner and someone who will always stand for the truth. Visit "About Me" for more! Archives
November 2019
Categories |
 RSS Feed