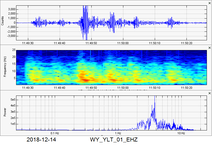
 Rapid fire earthquakes have been increasing near the West Thumb Lake area (just west of Yellowstone Lake) the past few years. In my opinion, the characteristics of these sequences confirm tectonic activity is most likely out of the question. Since many of the events are emergent and contains multiple micro-quakes within such a short amount of time, it is likely these swarms are being caused by some type of other process (magma or hydrothermal). I am unsure what caused December 14's swarm but the frequencies seemed a little lower than recent rapid fire events at West Thumb Lake. I will show some of the data pertaining to this event so please click the title of this post or "read more" to continue... 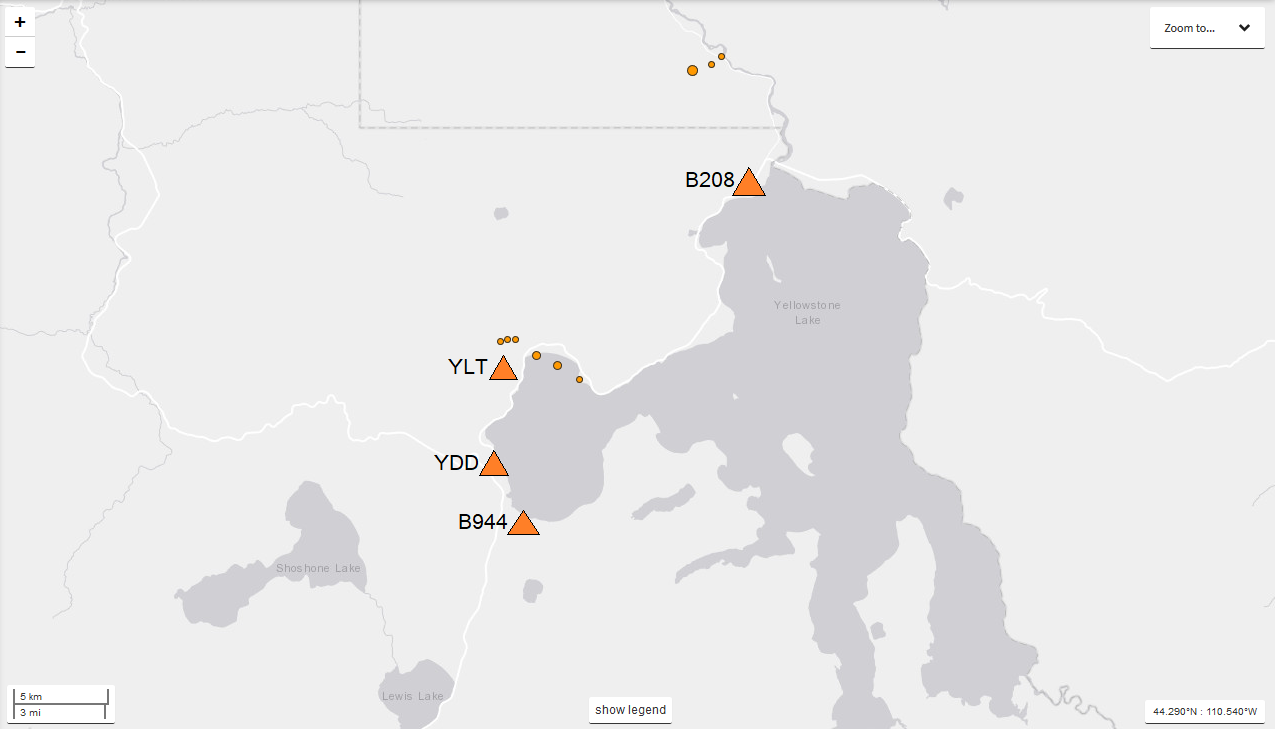 Above you can see the earthquakes for this swarm near West Thumb Lake (west of Yellowstone Lake) in regards to 4 seismic stations in the area. You can see they only have reported 6 earthquakes so far for this earthquake swarm. The 3 reported for north of northern Yellowstone Lake seem to be separated from this swarm. However you may never know. Using the seismic program WAVES and data collected from the 4 stations above, I determined there were 68 earthquakes within 3 hours and 6 minutes at West Thumb Lake. I determined that by comparing P wave arrivals using WAVES. Now this swarm started at about 10:17utc and ended at about 13:23utc. There seems to have been 3 episodes during this 3 hour and 6 minute time frame. One episode lasted about 5 minutes, from 10:17utc to 10:22utc, the second episode lasted about 4 minutes, from 11:11utc to 11:15utc, and the last episode lasted about 3 minutes, from 11:48utc to 11:51utc. That is a very short amount of time for all these earthquakes to be occurring! For all 68 earthquakes, only about 75% occurred as part of those episodes. That is not an exact number but it is close. I believe the most rapid event of this swarm included 6 earthquakes in about 50 seconds. That is a crazy tight amount of time for 6 earthquakes to occur regardless of magnitude! Now I believe this could be some type of hydrothermal or magmatic pressure release. I am unsure as to how magma could reach to depths this shallow without a larger swarm unless there was already a small pocket of it sitting somewhere near West Thumb. Well there are two swarms that could have allowed a very tiny pocket of magma to be created: the 2008-2009 Yellowstone Lake swarm or the April 10-11, 2018 Yellowstone Lake swarm. Both swarms seemed to indicate some type of magma injection so I wouldn't be surprised if they could find tiny stagnant pockets of magma just below the surface near the West Thumb/Yellowstone Lake area. Regardless of cause, you will see below that this swarm was most likely not caused by tectonic activity but by some type of rock-breaking, fracturing sequence. Please join me in understanding why the West Thumb area at Yellowstone sees these rapid succession earthquake swarms. These types of swarms are rarely ever seen outside of the West Thumb area making me think something is changing just west of Yellowstone Lake. Maybe a new hydrothermal system? Who knows. Above are the helicorders for seismic stations YLT, YDD, and B944. Those stations were closest to this event. Below are the seismogram/spectrogram/spectral plots for most of the events in this earthquake swarm. I do not show every earthquake but the top 10 most interesting selections of this swarm (which covers a good majority of it). Remember to always pay attention to chart labels first and also pay attention to any captions beneath any images. All plots below were generated by myself using seismic data from station YLT, obtained through IRIS, and the seismic program SWARM. YLT was the closest station to this swarm so I found it appropriate to use that station for these plots. 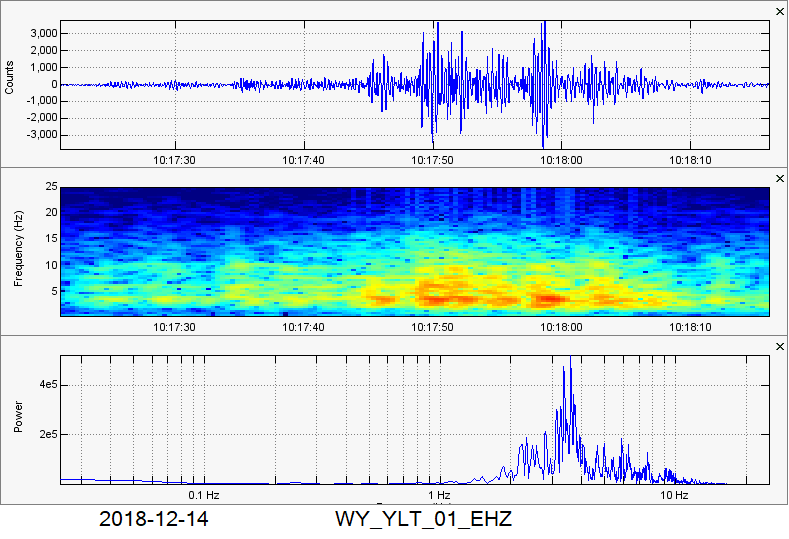 Here is the first 3-plot image for this swarm. Notice how it almost looks like there were 8 separate earthquakes within less than one minute! However, for the total earthquake count for this swarm, I only counted 5 earthquakes within 1 minute because they really occur in such rapid space that it is hard to separate them. Now look at the spectrogram and spectral plots. Notice low-mid range frequencies with dominant frequencies between 3Hz and 4Hz. Yeah, tectonic activity is definitely out of the question. None of the earthquakes within this plot were reported possibly due to the P wave arrivals being covered by the sheer quantity of micro-quakes within such a short time. 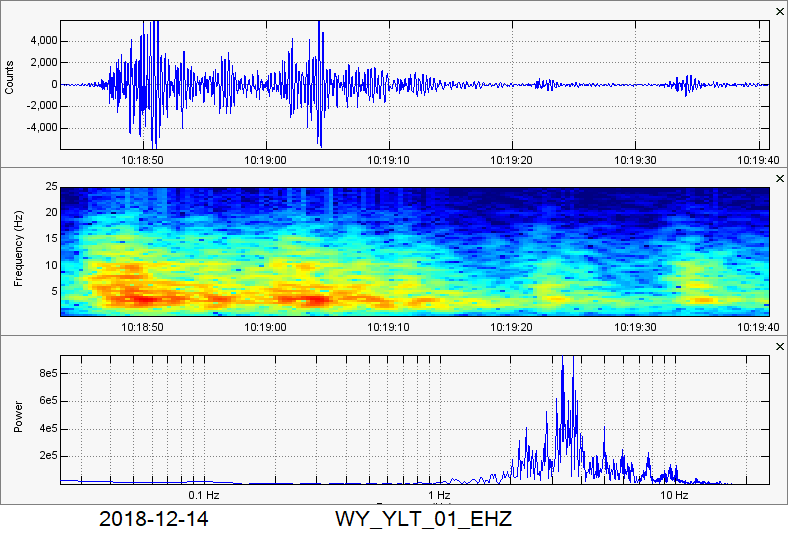 The time period for this plot is again about 1 minute. Notice it looks like there were about 5 separate events within this time period. Man, these earthquakes are really occurring at a fast pace! They are small but they are also very bunched together. Notice low-mid range frequencies once again with the dominant frequencies remaining at about 3-4Hz. No earthquakes within this plot have been reported (at least not yet). 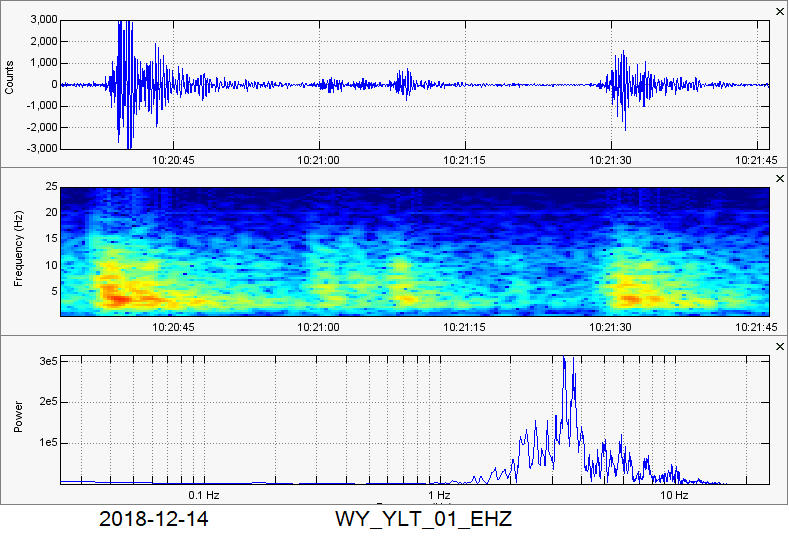 Here we see 2 earthquakes on opposite ends of the plots. The one on the left was reportedly a magnitude 1.4 at 1.9km in depth and the one on the right was reportedly a magnitude 0.8 at 0.1km in depth. So we see two earthquakes so far. However in the middle of them it appears as if there were 3 extremely tiny events that occurred within about 12 seconds or so. I just counted the quakes in this plot as 4 events. Notice low-mid frequency ranges with 3-4Hz being the dominant frequency range, once again. 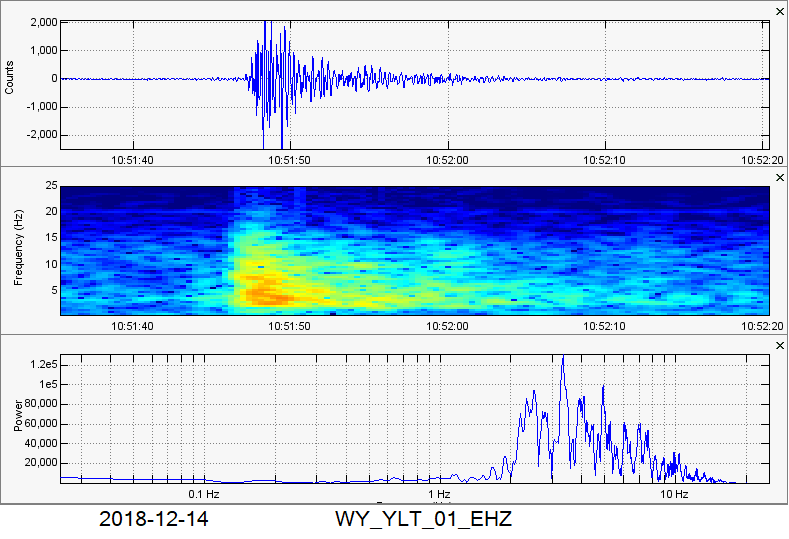 This plot shows one earthquake. This was reportedly a magnitude 0.8 at 3.9km in depth. Notice the elongated coda (end tail of an earthquake). Although this earthquake was part of this swarm, it had broader dominant frequencies. However we see the strongest frequency was between 3-4Hz, once again. 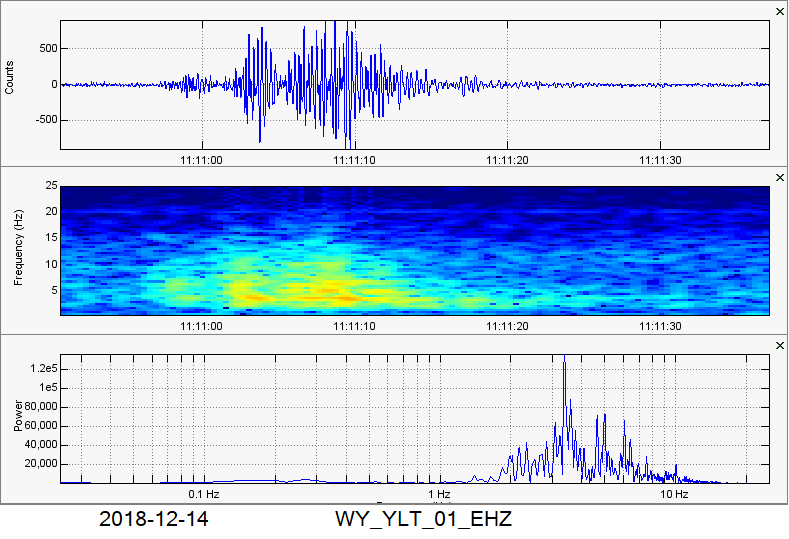 This event at 11:11utc was quite interesting. Notice we see it is likely 3 earthquakes occurred within about 20 seconds or so. Also notice the low-mid frequency ranges with dominant frequencies resting between 3-4Hz, once again. So far it seems this entire swarm was specifically dominant between 3-4Hz. Very intriguing! None of these earthquakes in this plot were reported. 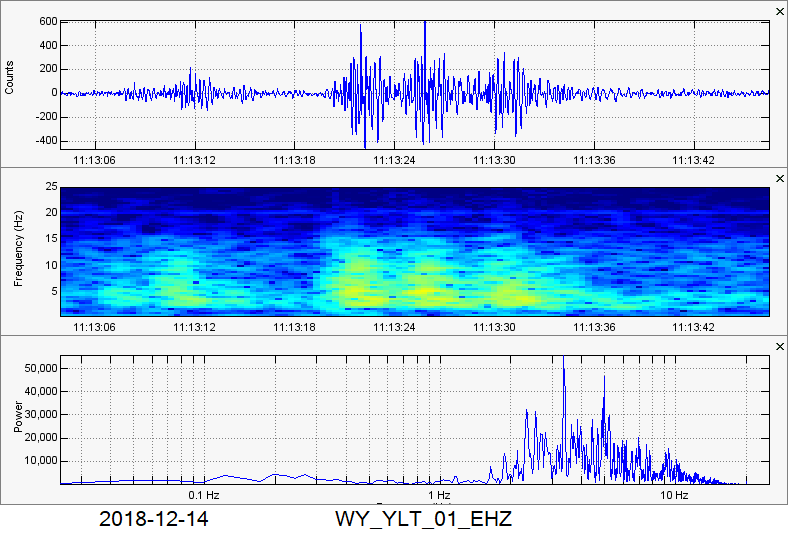 Here in this 3-plot image we see 4 micro-quakes within less than 30 seconds. Notice low-mid range frequencies with dominant frequencies resting between 3-4Hz, once again. However this time we do see a secondary spike in dominance on the spectral plot. Notice the 2nd highest spike rests at 5Hz perfectly. None of these earthquakes in this plot have been reported. 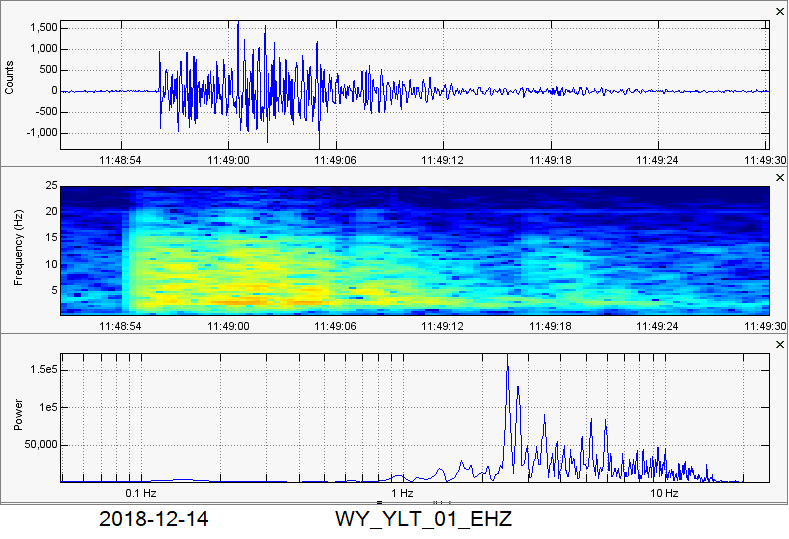 Here there appears to be one earthquake, right? Well it looks like this plot contains two earthquakes that occurred probably within less than 10 seconds apart. As you will see in the next plot, this earthquake should have been reported. Notice the amplitude count goes to about 1,500 or so. But the start of the next plot shows multiple events including the next reported earthquake. Notice low-mid range frequencies with 2-3Hz being the dominant frequency range. That is different than the previous events I have shown on this blog post.  Here we can clearly see 6 separate earthquake events that occurred within less than 1 minute! Two earthquakes out of six were reported for within this time period. The first one reported was the first event you see. It was reportedly a magnitude 1.5 at 2.4km in depth. The only other earthquake reported during this time period was a magnitude 0.9 at 2.1km in depth. You can see this was the earthquake on this plot with the highest amplitude count. So the 1.5 was smaller? Interesting… Could have to do with distance but these earthquakes were not occurring along that large of a swath of land. Notice low-mid range frequencies with 3-4Hz being the dominant frequency range once again. 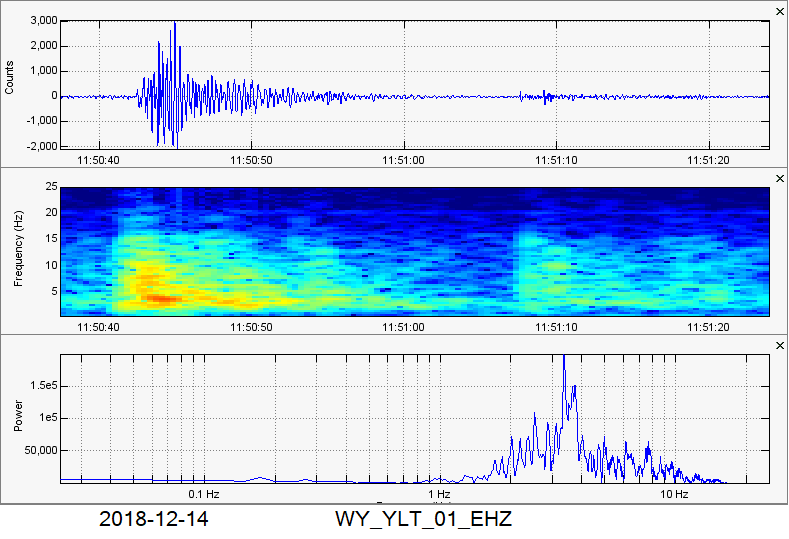 In this plot we see two obvious earthquakes. One on the left half of the plot and one on the right half. Notice the stronger earthquake has an amplitude count around 3,000. That is small, yes, but this is one of the largest events within the swarm. How is it possible then that smaller earthquakes were reported but this one was not? It is possible they may report more earthquakes for this swarm in the coming days so we will just have to wait and see. The other earthquake that occurred was also not reported but that is not surprising seeing it was extremely tiny. Notice the low-mid range frequencies with the dominant frequency range being between 3Hz and 4Hz, once again. 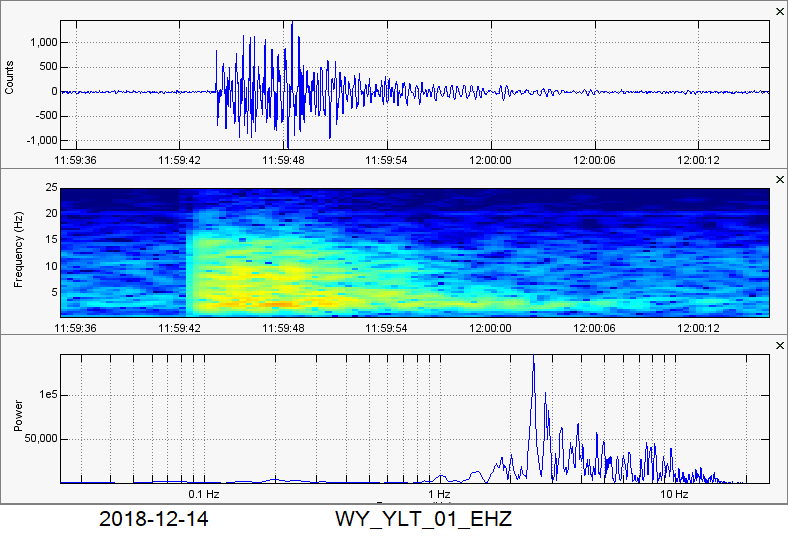 Here we can clearly see one single earthquake. This earthquake was, so far, the last reported earthquake of the swarm. It was reportedly a magnitude 0.8 at 5.1km in depth. Notice how the amplitude count is smaller than a couple of the other earthquakes that were never reported. Maybe they will report them but they haven’t gotten around to it? Who knows. Notice the low-mid range frequencies once again. However this time the dominant frequency range is between 2Hz and 3Hz. Lots of low frequency events! So what could these mean? They are too low to be tectonic but also seem slightly too high to be caused by magma itself. Magma just may be the culprit though since swarms confirmed to be caused by hydrothermal intrusion usually carry a higher frequency range. Who knows. These types of rapid fire swarms at Yellowstone usually only occur around the West Thumb area. Why is that? Well that is one the reasons I am conducting additional research on this area. 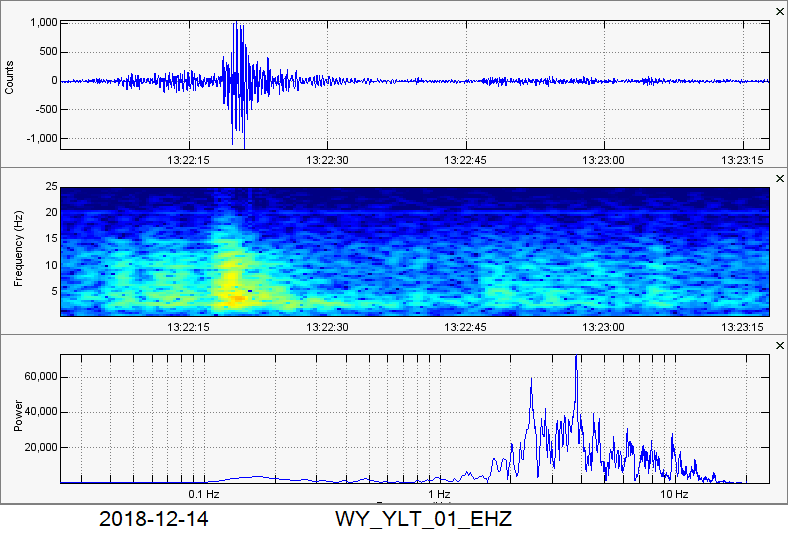 I wasn’t going to do another plot image but I decided to do so. Notice we see one earthquake that has yet to be reported. However there seems to be 2 extremely tiny events just prior to this earthquake. Also, halfway through the plot, we see another extremely tiny event that lasts a long time for how small it was. Notice the low-mid range frequencies with 3-4Hz being the dominant frequency range once again. Also notice the was a secondary spike between 2Hz and 3Hz. So this swarm was extremely interesting. One of the more interesting rapid fire events at Yellowstone I have seen. Of course the magnitudes were not crazy, but there were definitely around 68 micro-quakes that occurred within about 3 hours and 5 minutes. What could this mean? Are there more swarms on the way or is this just a natural pressure release valve for this area? Who knows but I do know these rapid fire events at West Thumb lake have been increasing in quantity over the past few years. Stay tuned for more and have a great day!
4 Comments
Amy
12/15/2018 08:48:30 am
Thank you so much Ben! I can't believe you are the only person in the world with current pertinent information on Yellowstone events. Unreported swarms, MCID now has a strong signal, they think steamboat went off again but aren't sure because YNM and Tantalus are not recording. Is anything working or is anybody working? To me it is incredulous. I really appreciate your information and diligence!
Ben
12/15/2018 12:04:39 pm
Thank you for the amazing support! But I do believe the long lived signal on MCID is simply caused by some type of surface interferance such as heavy traffic or a storm. If it were volcanic in nature it would most likely appear on all surrounding stations with dominant low frequencies. And yes it is possible steamboat erupted without us knowing since YNM is offline (which I am not happy about). I used YNM for all my steamboat geyser plots so they better turn it back on soon! And it doesnt even look like a technical issue since usually, if its a network issue, there would be multiple stations down instead of just one. Hopefully they are working to resolve it. Also the stream data for Tantalus is all there right now and there have been no instant spikes so it doesnt look like it has erupted yet. However it is due to erupt any day now so they better turn on YNM lol! God bless!
Ben
12/17/2018 09:40:55 pm
Woah. That is a very good idea. It would take some work but it would be worth it. I never thought of that! Because what they do is basically cause a hydrothermal injection event. So it could mirror what is happening here, if indeed these rapid fire swarms are caused by hydrothermal activity. But still the frequencies are a little too low. Thank you for the advice! I will attempt to do that eventually. God bless and merry Christmas! Leave a Reply. |
AuthorBen Ferraiuolo is a fast learner and someone who will always stand for the truth. Visit "About Me" for more! Archives
November 2019
Categories |
 RSS Feed