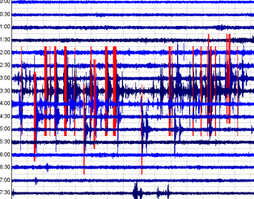
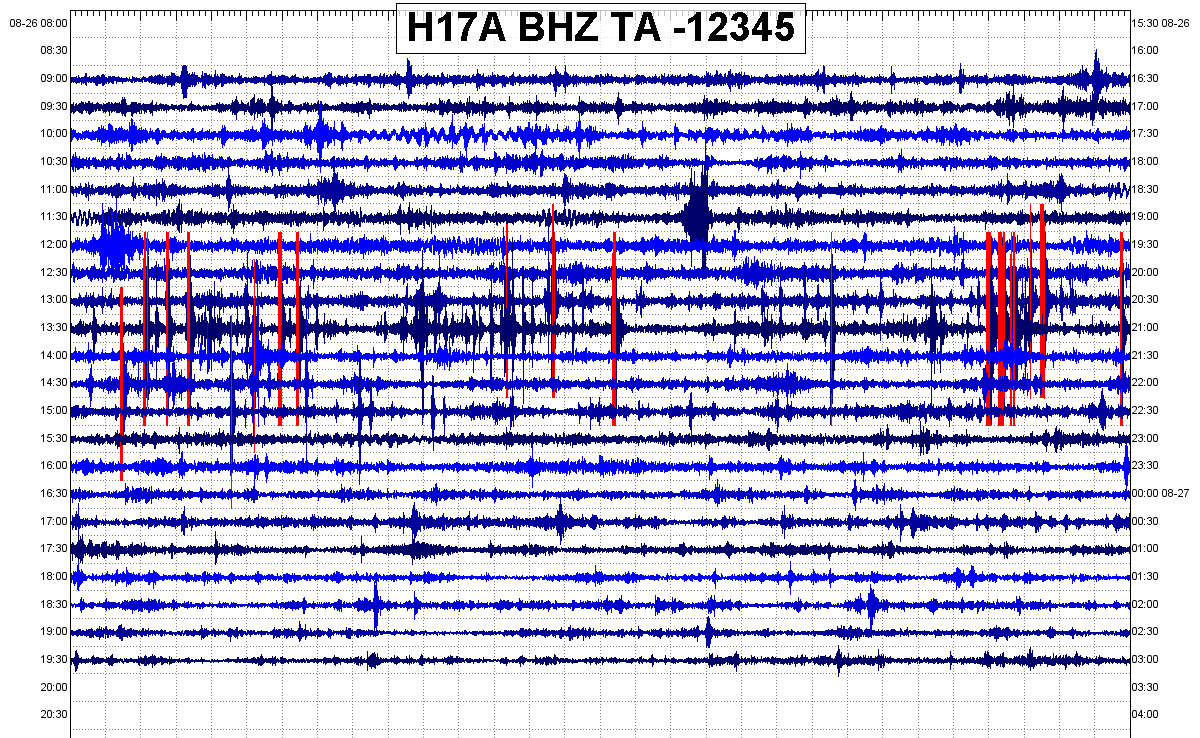
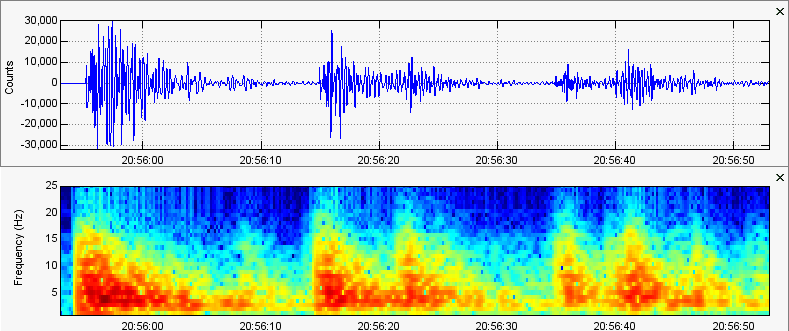
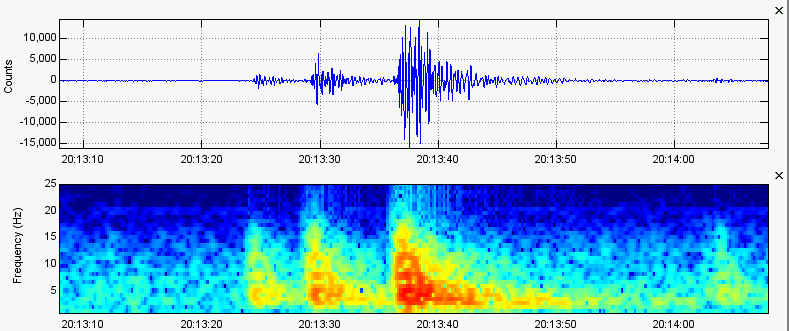
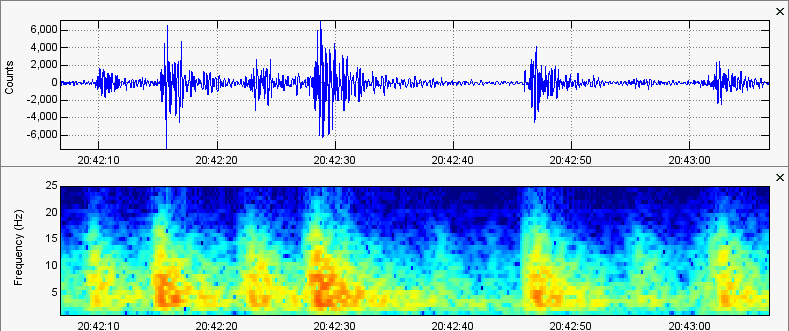
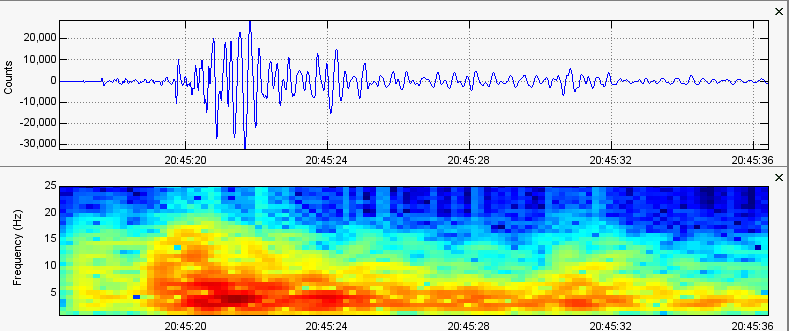
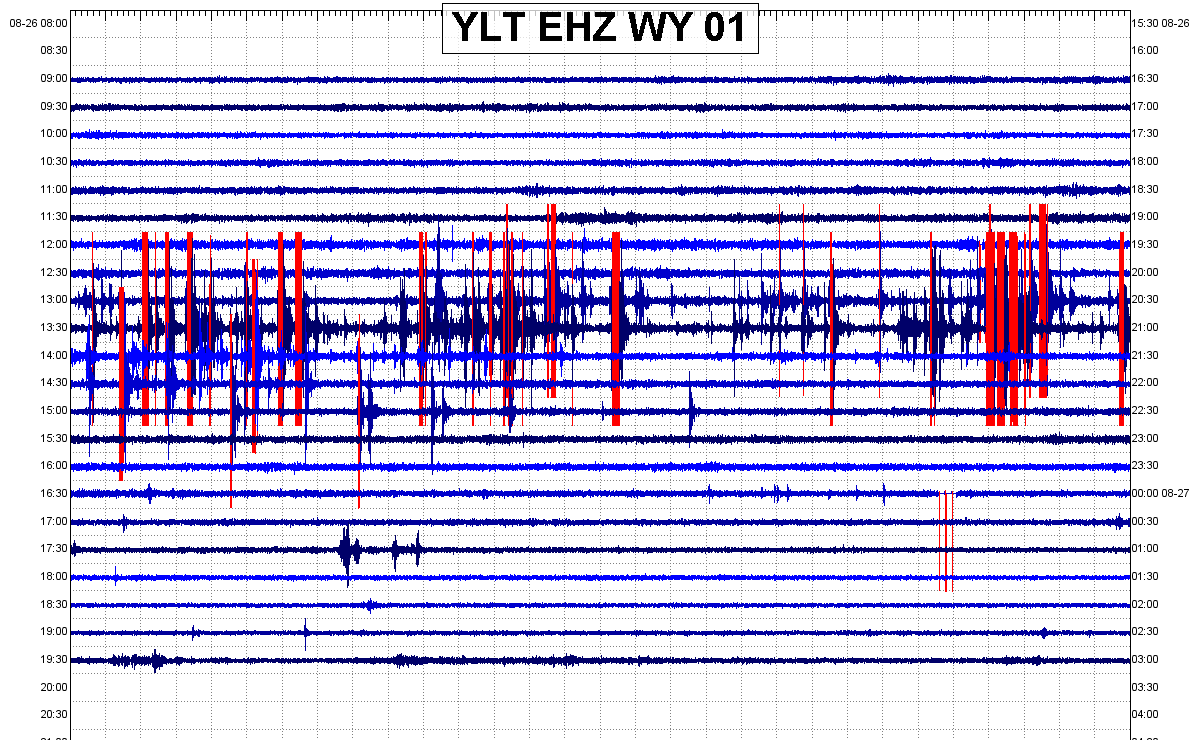
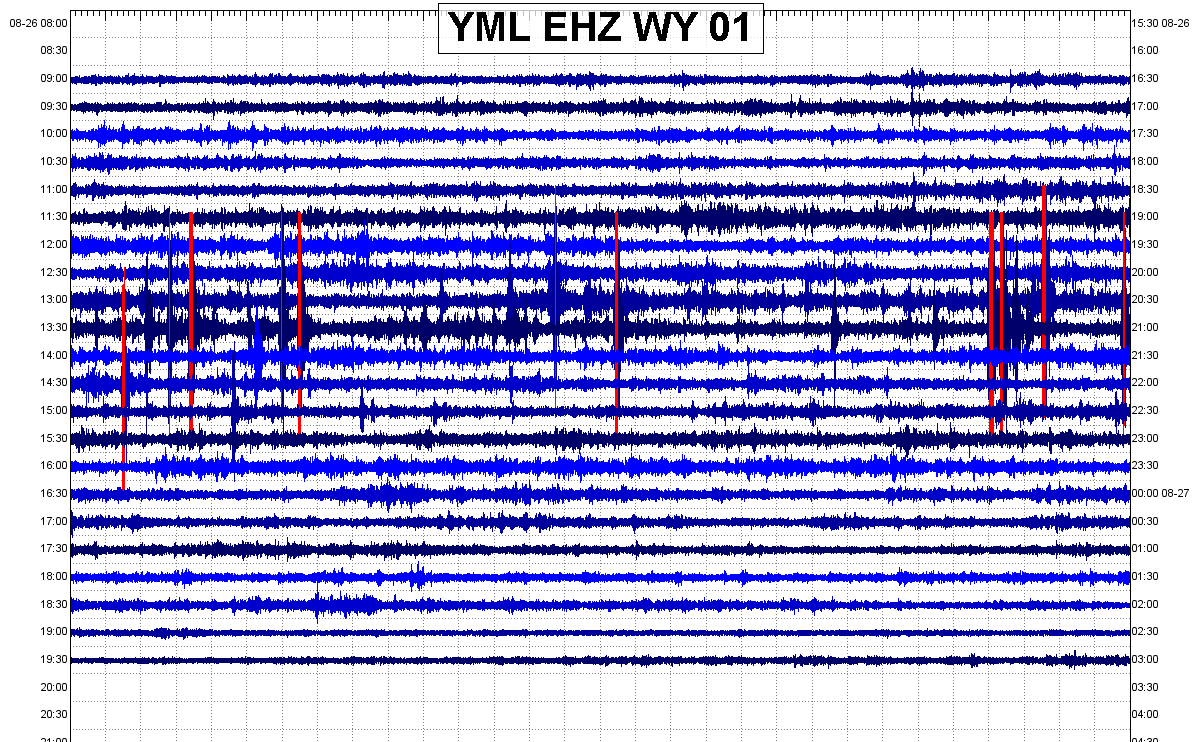
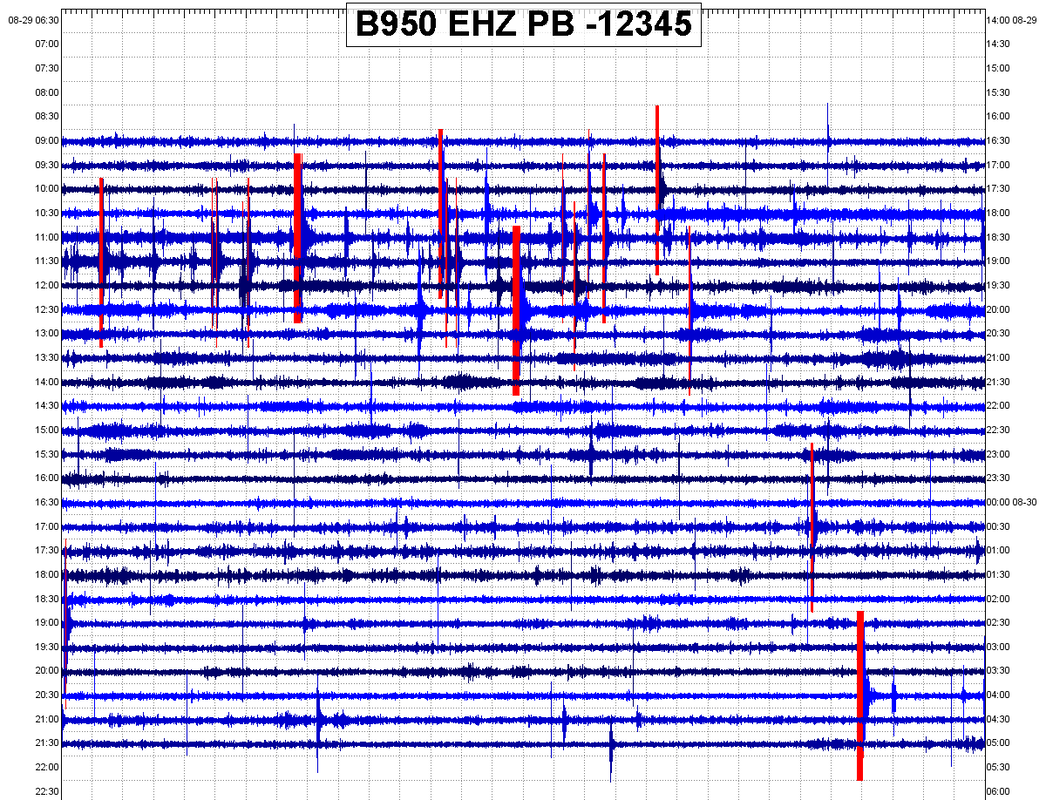
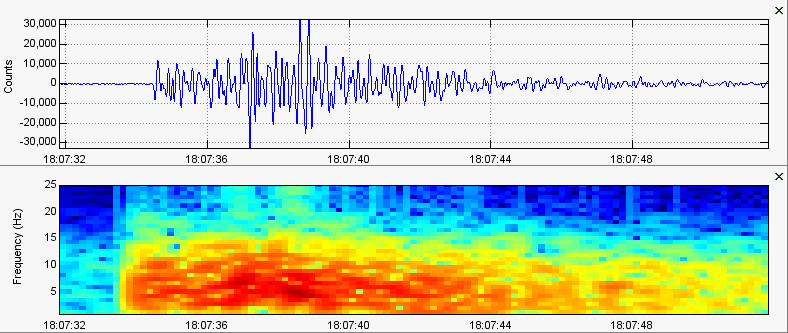
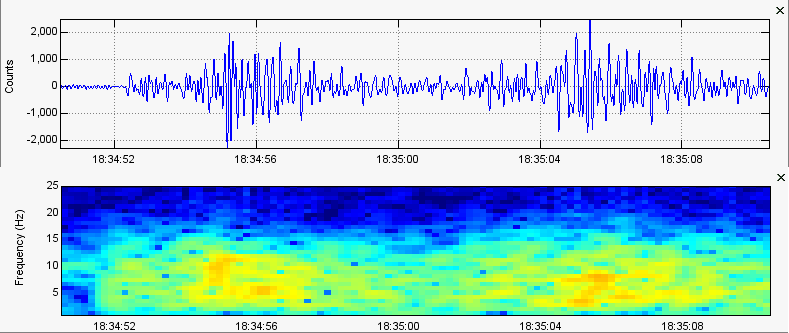
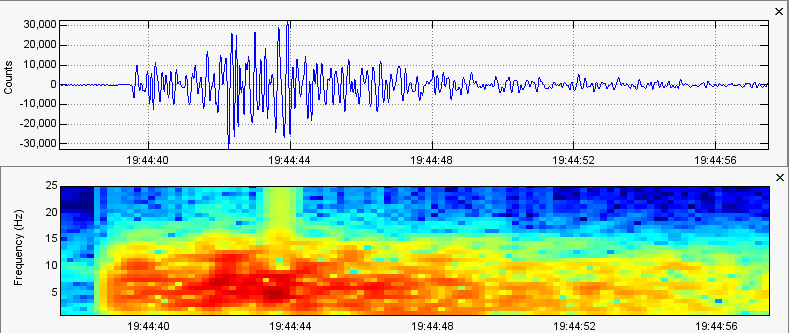
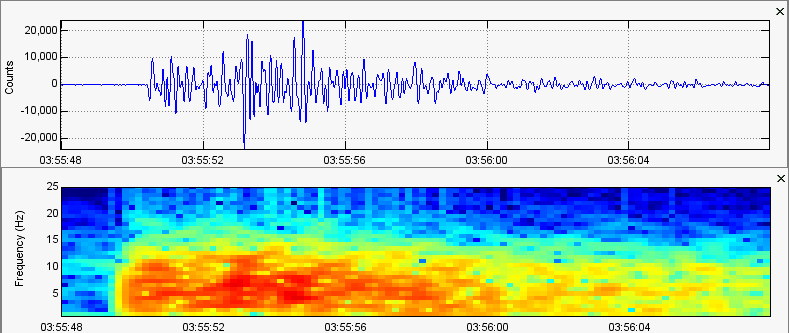
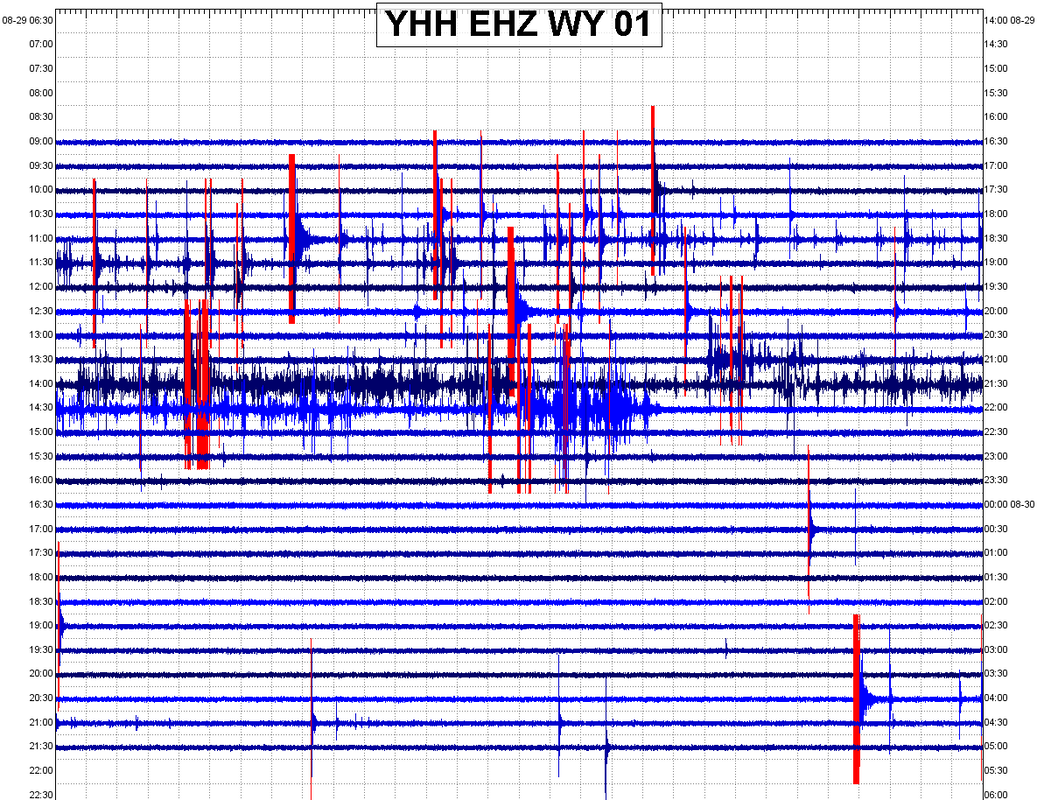
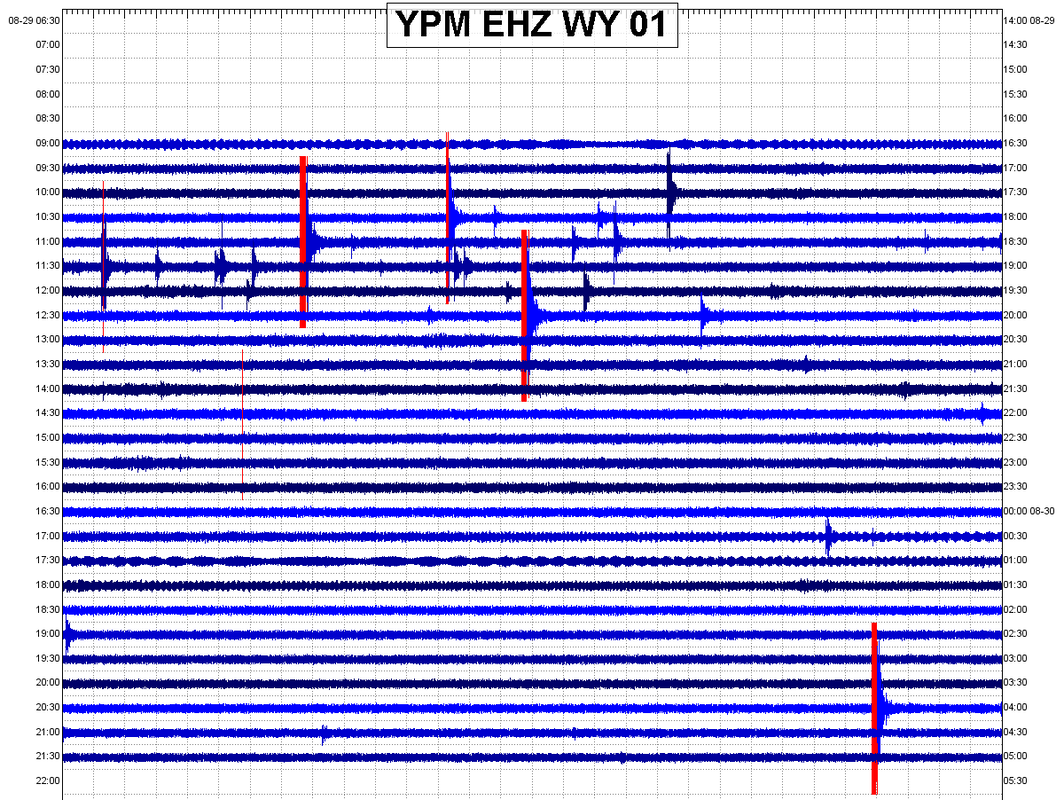
 Including the minor earthquake swarm at West Thumb on August 21, 2018, there have been 3 earthquake swarms already for Yellowstone in the month of August. They were not too major but, just like before, we see the earthquake succession at West Thumb occurring at a farther rapid pace than other areas at Yellowstone (sometimes multiple earthquakes within one minute). Why? Who knows, but it is my opinion tectonic activity alone could not cause the West Thumb rapid succession swarms. Remember guys I am still a beginner at all of this! Seismology is extremely interesting to me and I cannot wait to make a career out of it! I will be talking about the swarms for August 26 and August 29-30 in this post. As always, please click "read more" to read the rest of this blog post. Post last updated: September 1, 2018 August 26, 2018 West Thumb Swarm 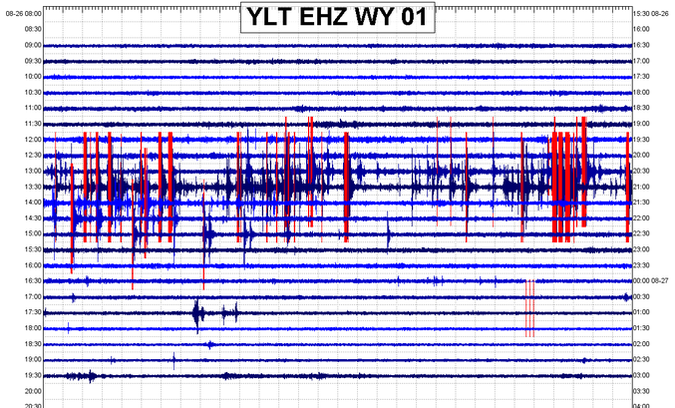 The August 26, 2018 West Thumb swarm as shown on seismic station YLT. On August 26, 2018 at the northern tip of West Thumb at Yellowstone Lake, the same exact location as the July 5, 2018 possible 40-minute intrusion event, a very interesting earthquake swarm occurred. Many features seem to indicate it might be a continuation of the July 5 event, one I have always suspected to be caused by a short burst of magma which was injected into above cracks or a pre‐existing fracture between 3.8-4.8km in depth on the northern tip of West Thumb. On 2018-08-26 from about 20:05 UTC to 22:17 UTC (1:00pm to 3:17pm Pacific Time), I was able to identify 54 earthquakes within a 2 hour and 12 minute time frame by cross correlating P wave arrivals using the program WAVES and 3 of the closest seismic instruments: YLT, YML, & H17A. Note: I was not attempting to determine earthquake locations! I was simply determining how many earthquakes actually occurred near these 3 stations. Many earthquakes in the swarm were most likely not able to be located due to approximately 60%, not an exact number, of the earthquakes occurring at very low magnitudes, M-0.3 to M0.5. As seen in the image directly below, only 14 earthquakes were reported for this location and time period. You can also see it is virtually the same exact location as the July 5 event at the northern tip of West Thumb (also shown below): 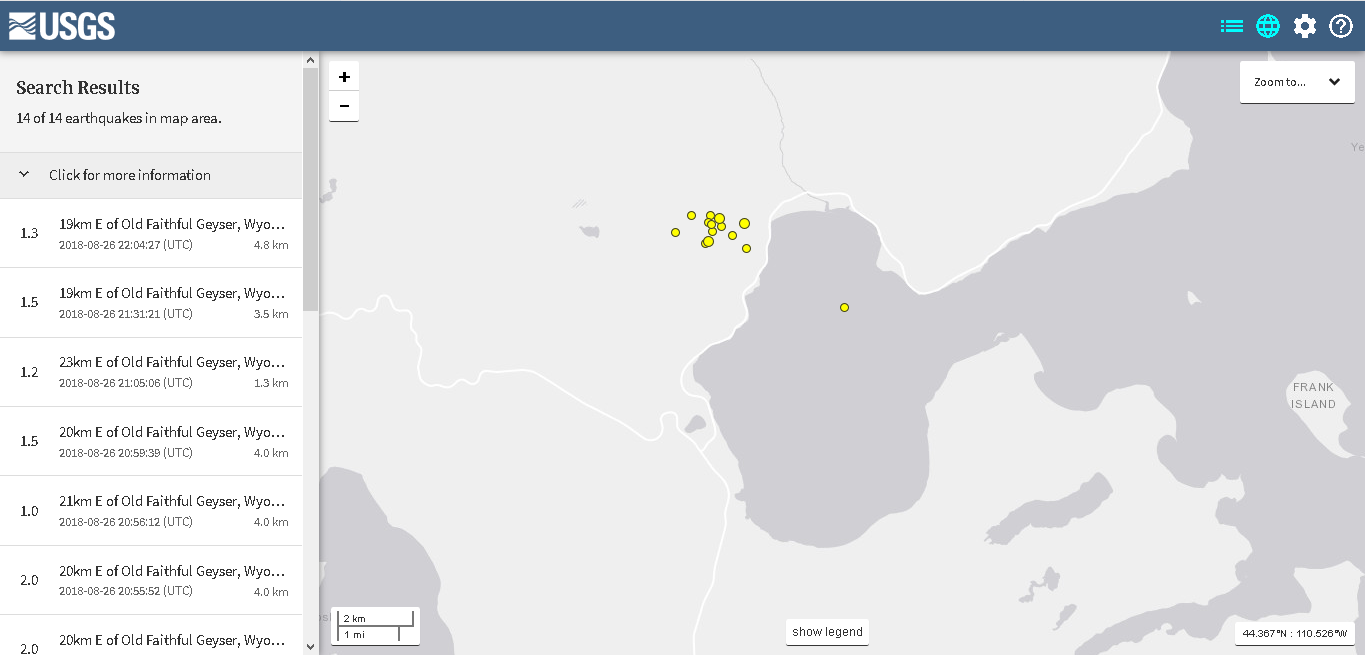 Only 14 earthquakes reported for the 2 hour and 12 minute swarm at West Thumb on August 26, 2018. 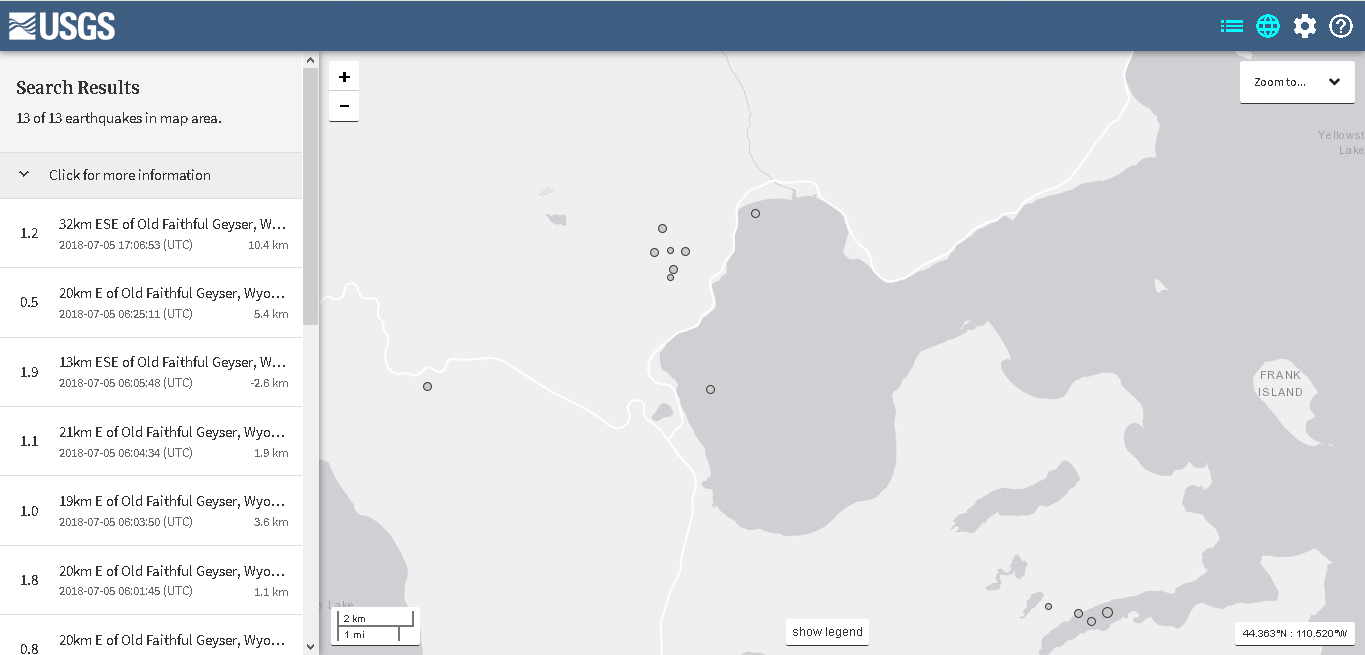 July 5, 2018 earthquake swarm. Note these are only the earthquakes that were reported! 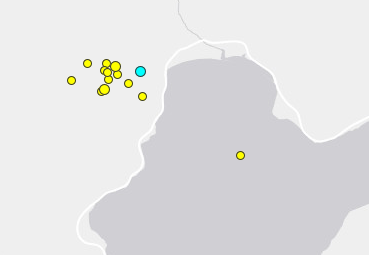 So yes, 54 earthquakes were confirmed for the August 26, 2018 earthquake swarm. Now only 14 were reported with the largest being a magnitude 2.8 at 4.3km in depth at 20:32UTC. Many of the earthquakes in this swarm carried a mid range frequency with some earthquakes appearing to be "hybrid" earthquakes (see "EQ Type Examples). To the left is a picture of the earthquakes, the one highlighted blue being the largest event. The image directly below is the waveform and frequency analysis of this one earthquake. Note the dominant frequencies below 10HZ. In retrospect, high frequency tectonic earthquakes far exceed 10HZ! 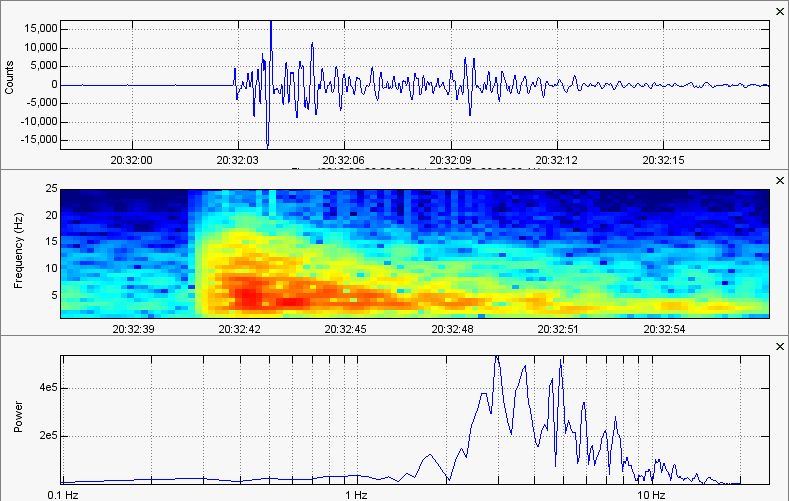 Now real quick, I want to show the tiltmeter plots for Borehole 944, which resides right near West Thumb, and Borehole 208, which resides on the northern tip of Yellowstone Lake. The first plot shows the past 30 days of tilt at B944 and the second plot shows the past 30 days of tilt at B208. Now remember when viewing a plot, chart, or graph, even in regards to mathematics, you must always, ALWAYS look at the information given on all sides of the chart. For example, you will notice the tilt meters record tilt in microradians. The amount of microradians labeled on the left can change drastically in response to large changes in deformation. So you must ALWAYS look at the microradian extent and the time period at the bottom. Tilt meters are different than GPS deformation instruments. GPS instruments record the way the ground is moving in all directions, including vertical (uplift/subsidence). Tilt meters, on the other hand, detect minute changes in the shape and slope of the ground where the tilt instrument is set up. USGS actually puts it quite well, stating, "Tilt measurements have been used to monitor volcanoes in the United States since the founding of the Hawaiian Volcano Observatory in 1912. When magma accumulates beneath the ground, causing the surface above to inflate, the slope of adjacent areas will usually tilt away from the center of uplift. Conversely, if the ground deflates as a consequence of magma draining from a subsurface reservoir, the slope of adjacent areas will tilt toward the center of subsidence. Like a carpenter's level, an electronic tiltmeter uses a small container filled with a conducting fluid and a "bubble" to measure a change in slope. Tilt is measured in microradians, which is a small fraction of a degree. One microradian (equivalent to 0.00006 degree!) is approximately the tilt caused by placing a dime under one end of a beam that is one half-mile long. The Volcano Hazards Program uses a variety of tiltmeter types, but instruments placed in shallow boreholes (1-6 meters or 5-20 feet deep) produce the best results because the sensors are insulated from noise that is common at Earth's surface—for example, changes in temperature and pressure." So now when viewing tilt plots, including the ones shown directly below, please keep that explanation in mind. 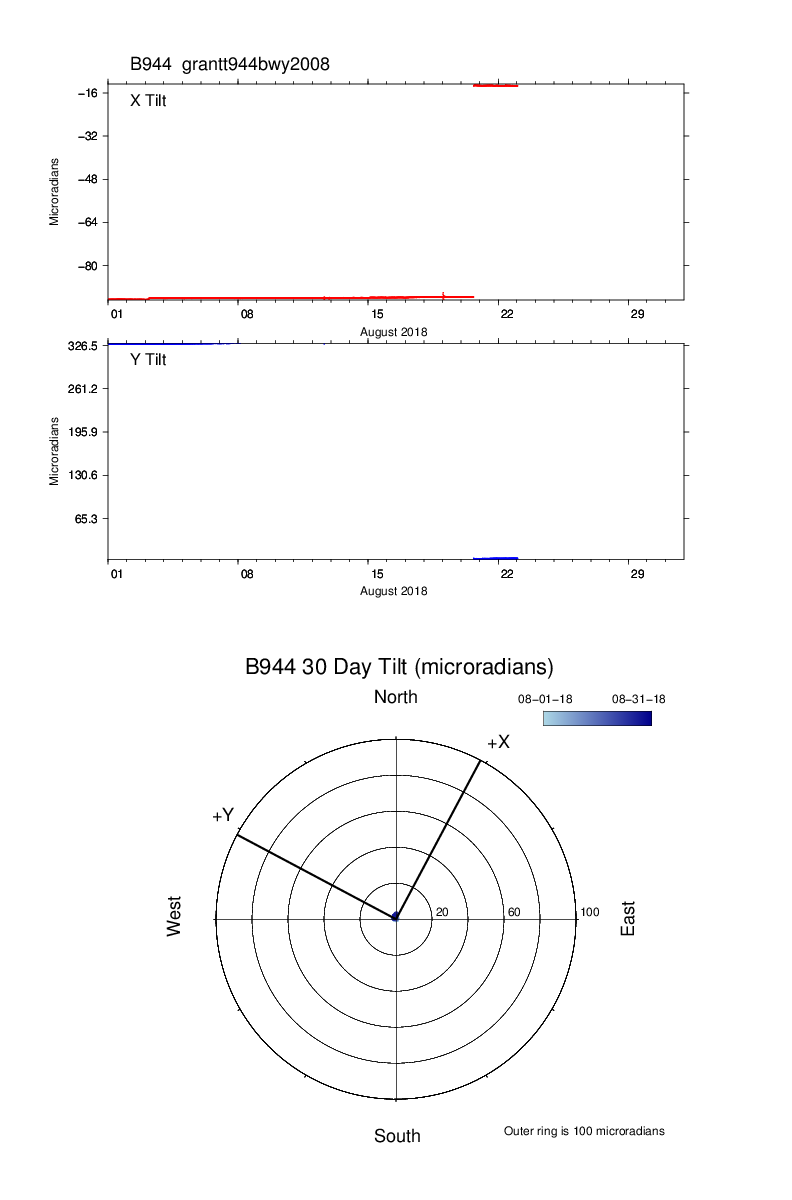 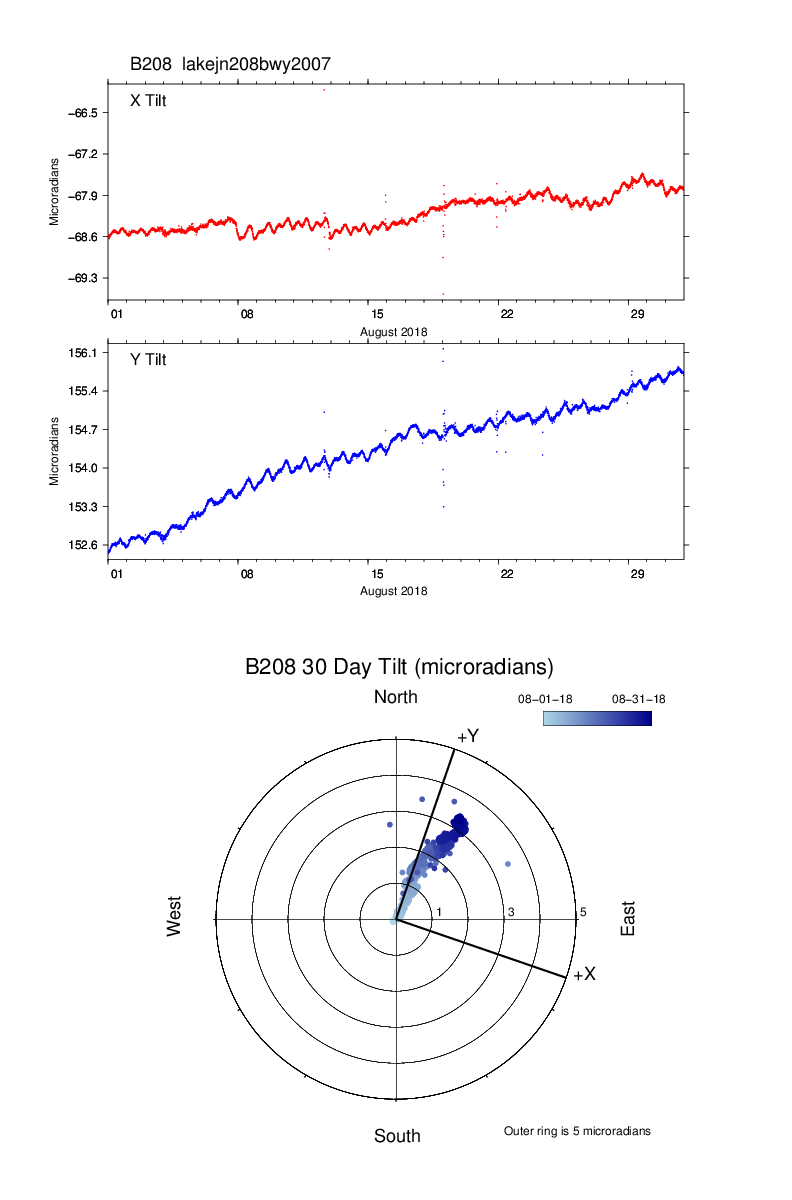 Now please take a look at the B944 tilt plot. I am really, really, really hoping it is a glitch. If it is not a glitch, then we have some severe deformation occurring near West Thumb. However, I try to stay optimistic! It is my firm belief that this event is a continuation of the July 5 possible magma intrusion event. Some of these earthquakes that occurred happened in such rapid succession, for example 4 earthquakes in one minute happening multiple times, that it leads me to believe this was another case of short lived magma injection, most likely protruding into the same weak spot as it did on July 5, if indeed magma intrusion is the case. West Thumb has a pretty interesting geyser system as well. I have heard nothing about West Thumb geyser basin lately. If anyone has any information on if any geysers or pools have dried up there in the past year, please email me immediately. The gallery below contains images of random interesting events within this swarm and the helicorders of the 4 closest seismic stations I could find data for. Regarding the waveform and frequency analysis images within the gallery, the analysis window time frame is set to one minute on most seismic images. Please notice the amount of earthquakes that were occurring within such an amazing short time frame! After the gallery below, I will talk about the August 30 earthquake swarm near Maple Creek, Yellowstone. Please click an image below to open it up! August 29-30 Swarm near Maple Creek 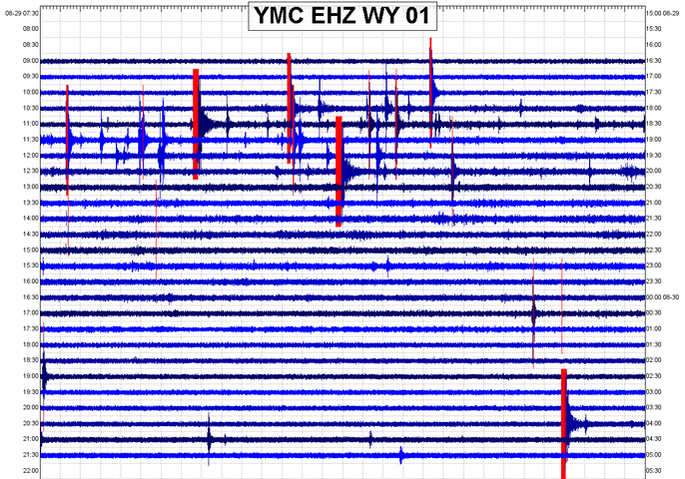 From about August 29, 2018 17:19UTC (10:19am PST) to August 30, 2018 04:47UTC (9:47pm PST) an earthquake swarm appeared far northwest of the most recent earthquake swarm which occurred at West Thumb on August 26. By using the P wave cross correlation method using the program WAVES, I was able to identify 35 earthquakes for this time period and location (near Maple Creek). 35 is the number of earthquakes that occurred near this area and time period, not the number of earthquakes that can be located down to the Lat-Long. The seismic stations I used for cross correlation were B950, YMC, YHH, and YPM. The images below show all earthquakes that were reported for this location and time period. The image zoomed in to the earthquake swarm epicenter shows it occurred right below Straight Creek, if you know where that is: 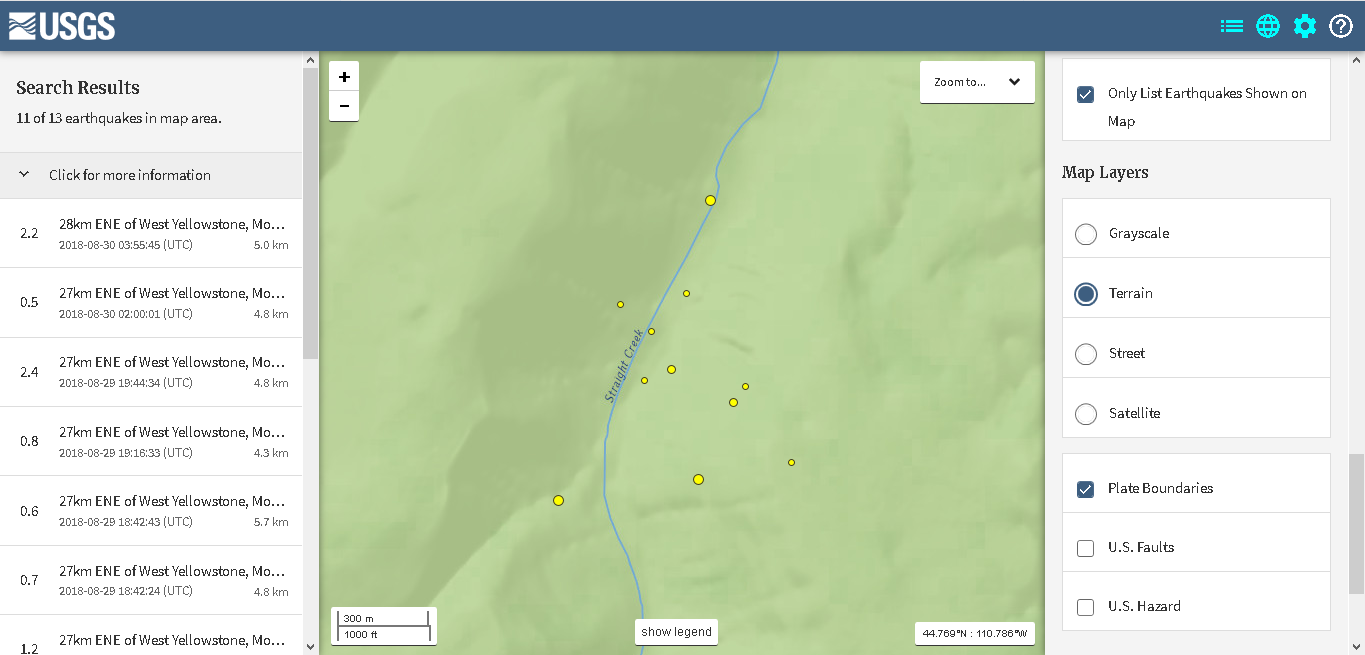 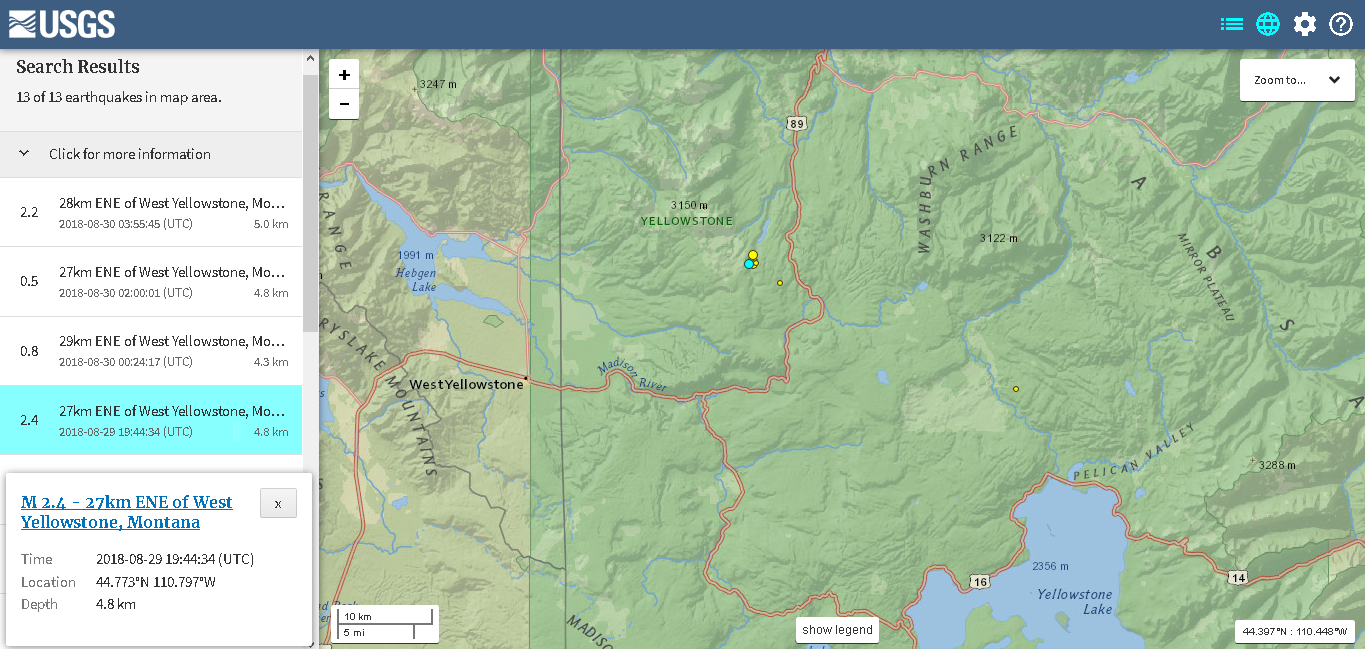 The largest event was reportedly a magnitude 2.4 at 4.8km in depth at 19:44UTC. The earthquake swarm was concentrated within a very small area. It is my opinion that this event was caused by pressure from the local hydrothermal systems on the fault zones which lie near Straight Creek. However I must say some of the earthquakes within this swarm did have dominant frequencies around 7-8HZ, in my book making them mid-low frequency earthquakes. As seen in a second, pure tectonic activity usually carries dominant frequencies around 10-15HZ, at times exceeding that of what we saw during this particular swarm. Of course since I am not a professional, that is my opinion and it could be totally incorrect. I did identify 35 earthquakes within about a 12 hour period. Of course some could not be actually located due to their small magnitude. Compare that to the 54 earthquakes within 2 hours and 12 minutes on August 26, 2018 at West Thumb! The image below is the seismogram and spectrogram of the largest event reported: 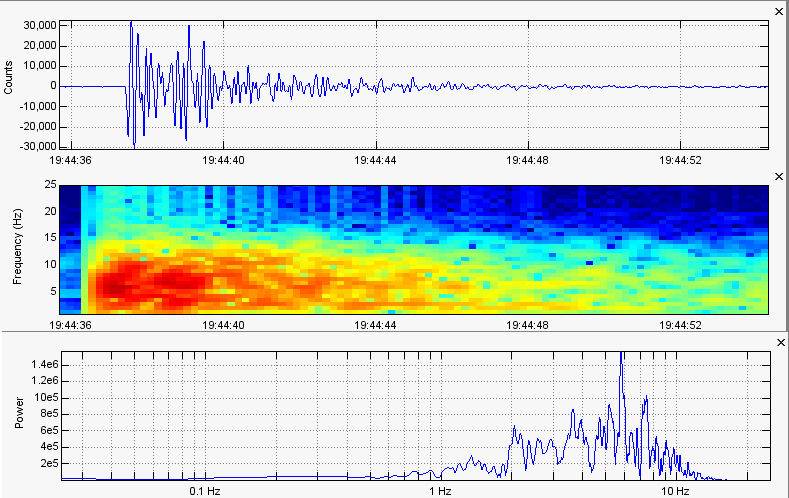 Now to show an interesting difference, the image directly below is of a tectonic-only event that occurred on July 16, 2018 near Yakima, WA (eastern Washington). This earthquake is what you would consider a typical high frequency tectonic event. There are no known magma sources anywhere near this area! To get an idea of what a low frequency or mid frequency event looks like, it is always good to compare the spectra, spectrogram, and seismogram of one earthquake to one that you know was caused by tectonic forces alone. Kind of helps you get the idea of what caused an earthquake. Not that you can tell a cause just by comparing, but it definitely helps. Check out the difference between the image just below and the image directly above this text. The time frame allotted in both images is the same: 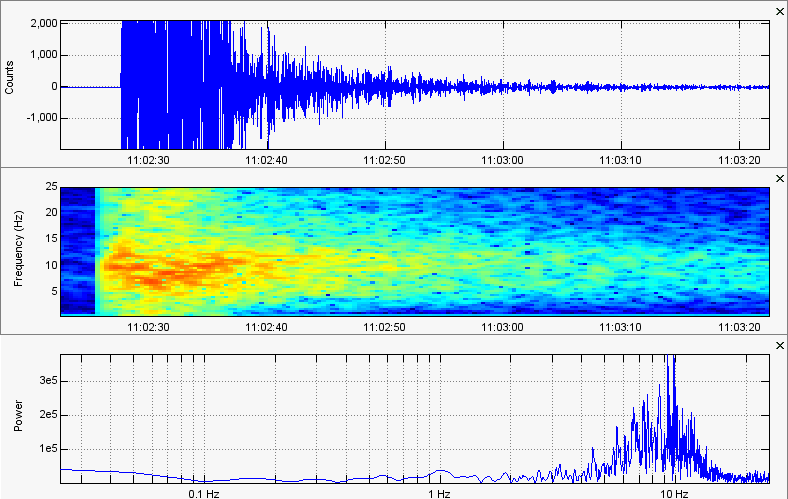 Notice the drastic difference? Yellowstone caldera is a very dynamic volcanic complex. That is why studying seismic signals at Yellowstone is my passion! The gallery below is full of images from this earthquake swarm. Please click on an image to enlarge it. My next blog post will be my 2nd monthly volcano update. Thank you for your time and enjoy!
1 Comment
|
AuthorBen Ferraiuolo is a fast learner and someone who will always stand for the truth. Visit "About Me" for more! Archives
November 2019
Categories |


 RSS Feed