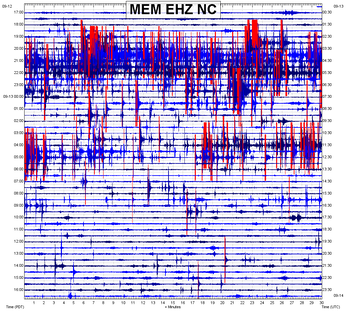
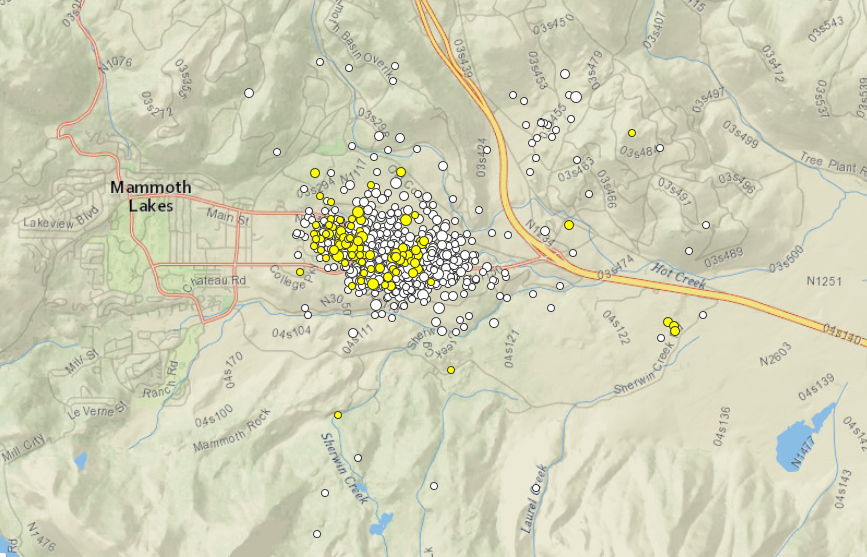
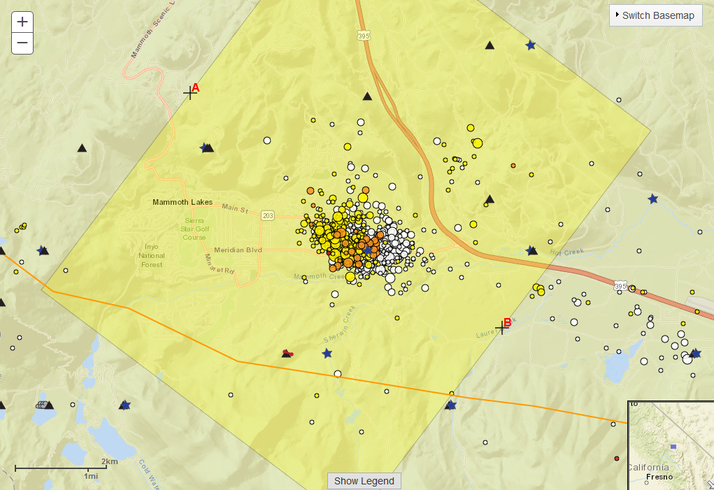
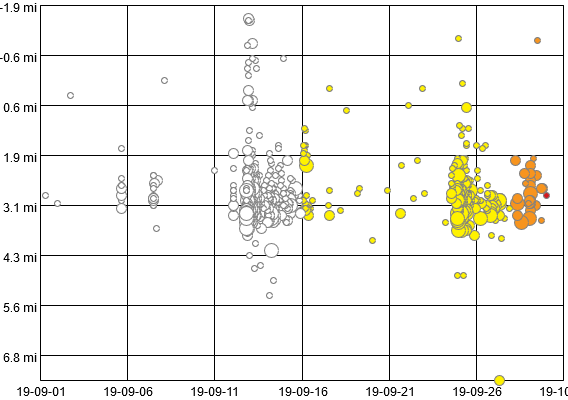
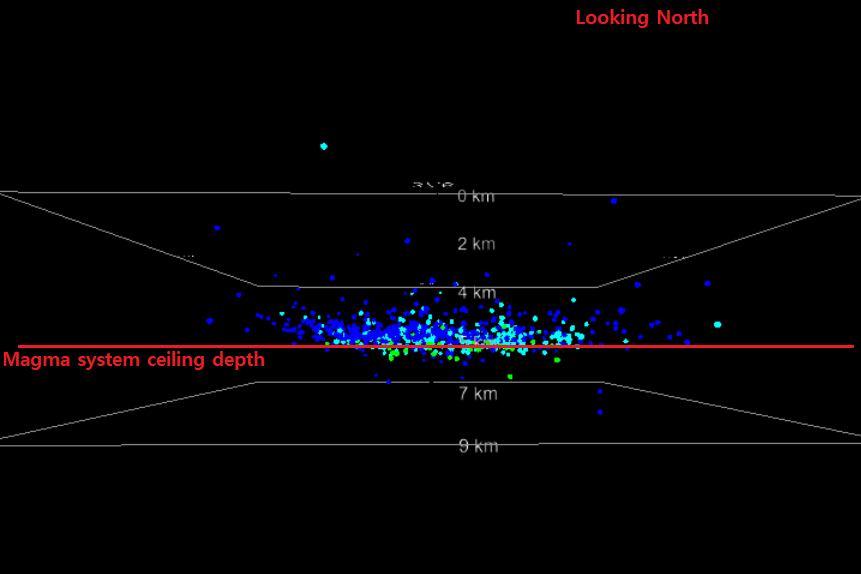
 Sept. 13 rapid-fire swarm. Sept. 13 rapid-fire swarm. September has been a very active month for Long Valley Caldera. Starting on September 13, a fairly intense period of seismicity started primarily around the eastern section of Mammoth Lakes, which resides in the SSW section of Long Valley Caldera. The magnitudes were not large, not surpassing M3.0, but the quantity of events were substantial in the short period of time they occurred. Please click the title of this post or "read more" to see some information about recent swarming at Long Valley Caldera. Starting on September 13, 2019, a fairly intense swarm of seismicity broke out just barely east of Mammoth Lakes. Mammoth Lakes resides within the infamous supervolcano along the SSW section of the caldera. The image above shows all reported earthquakes of all magnitudes from September 13 through September 30. Swarming was intense but magnitudes were small, the largest being a M3.0 on September 25. Most of the seismicity was concentrated within specific "bursts" of rapid-fire swarming on September 13, 14, 15, 25, and 29. The biggest swarms were on September 13 and September 25 with the swarm on the 13th by far being the largest of the month. From September 11 through September 30, there were a total of 856 earthquakes reported for this one location within Long Valley Caldera. 52 earthquakes reported were M2.0+ with only one M3.0. For the entire month of September, for the whole caldera, there were a total of 1,073 earthquakes reported. Below is a time/depth plot of the reported earthquakes from these many swarms. The image just prior to the plot is the location of the plot "box". Something quite interesting is that the September seismicity was non-linear in formation, meaning it appears local tectonics did not play a huge role in creating the swarms. Tectonics may still play a small part, but fluid migration from the magma system seems to be a more likely culprit. The depth of all of the swarms combined is also interesting. Around 3/8 of the earthquake swarms were at 5km depth or deeper. The ceiling of the Long Valley magma system is also around 5km in depth. So it seems the swarming was occurring along the ceiling of the magma system and above it as well. This can clearly be seen via the image below. Dots are earthquakes for seismicity from Sept. 11 through Sept. 30. This is a cross section of the earth in this location. Imagine you are underground and looking to the north while these earthquakes took place. You can tell it was occurring around the ceiling of the magma system. CLICK HERE to play around with this cross section plot yourself! Next I will show some quick data pertaining to the swarms that made up the September increase in seismicity for Long Valley. For the two largest swarms, the Sept. 13 and Sept. 25 swarms, I will show a spectrogram "stream" from three of the closest stations since there were too many events and too little time to create custom plots for those two swarms. Sept. 13 Swarm This is the swarm that kicked off the entire swarming in this location for September. It was extremely energetic but only reached M2.9. Many earthquakes were also too small and too closely spaced to be located accurately. It is likely many hundreds of events occurred this day. Sept. 13, 2019 swarm Start of swarm: Sept. 13, 2019 at 02:35UTC End of swarm: Sept. 13, 2019 at 12:25UTC (about 9 hours and 50 minutes for the main swarm on Sept. 13) Total earthquake count: Likely 2x or 3x the amount reported. Earthquakes mentioned in this text are for specifically the time period stated above. Many more very small micro-quakes randomly occurred after this time period. Reported count: For the time period stated above, USGS reported 294 earthquake events of all sizes. Please refer to the USGS EQ map button in the beginning of this post to see all reported earthquakes for all swarms mentioned on this page. Largest reported earthquake of this swarm: M2.9 at 5.9km depth Severity: Major one-day swarm Closest seismic station to swarm: MEM in the NC network Below is a video of a spectrogram "stream" from three of the closest stations. You can see there were far more than 294 events. Sept. 14 Swarm There was swarming basically all day on September 14. The main concentration of swarming started at about 12:52UTC and ended around 13:31UTC. The main concentration of swarming contained around 80 earthquakes of all sizes, many being very small. The reported count for all of September 14 was a total of 81 earthquakes. Here are helicorder plots from the 3 closest stations to the swarm. Afterward, I will show seismic plots of some random events from this day. Sept. 15 Swarm Swarming was sporadic on September 15. There was a quick burst of around 10 tiny events for about 3 minutes at 03:11UTC. Small quakes occurred here and there until around 11:06UTC where around 15 micro-quakes struck until 11:13UTC. The main seismicity this day started at 14:40UTC and ended around 14:51UTC. This main burst contained approximately 30 earthquakes with some striking in a very rhythmic pattern. Below are the helicorder plots from this day and also the seismic plots to many of the events on September 15. The reported earthquake count for the entire day of September 15 was a total of 47 events. Sept. 25 Swarm The Sept. 25 swarm was the largest of September except for the Sept. 13 swarm. Below is some information, helicorder plots, and a video of a spectrogram stream from three of the closest stations. There were so many events I barely had time to count them all or make plots for them. Sept. 25, 2019 swarm Start of swarm: Sept. 25, 2019 at 04:33UTC End of swarm: Sept. 25, 2019 at around 18:00UTC (about 13 hours and 27 minutes) Total earthquake count: Likely 2x the amount reported. Earthquakes mentioned in this text are for specifically the time period stated above. Many more very small micro-quakes randomly occurred after this time period. Reported count: For the time period stated above, USGS reported 179 earthquake events. Please refer to the USGS EQ map button in the beginning of this post to see all reported earthquakes for all swarms mentioned on this page. Largest reported earthquake of this swarm: M3.0 at 5.3km depth Severity: Major one-day swarm Closest seismic station to swarm: MEM in the NC network Sept. 29 Swarm Sept. 29, 2019 swarm Start of swarm: Sept. 29, 2019 at 08:47UTC End of swarm: Sept. 29, 2019 at 09:51UTC (about 1 hour and 4 minutes) Total earthquake count: ~115 micro-quakes of all sizes Reported count: For the time period stated above, USGS reported 26 earthquake events. Please refer to the USGS EQ map button in the beginning of this post to see all reported earthquakes for all swarms mentioned on this page. Largest reported earthquake of this swarm: M2.2 at 4.5km depth Severity: Minor Closest seismic station to swarm: MEM in the NC network
0 Comments
Leave a Reply. |
About
This blog page is solely for interesting earthquake swarms that occur in locations other than the ones I already have posted. Pretty much any earthquake swarm I am interested in, that cannot be placed on other pages, will be placed here. Please click the title of each post or "read more" to view each swarm. Archives
October 2019
Categories |
 RSS Feed