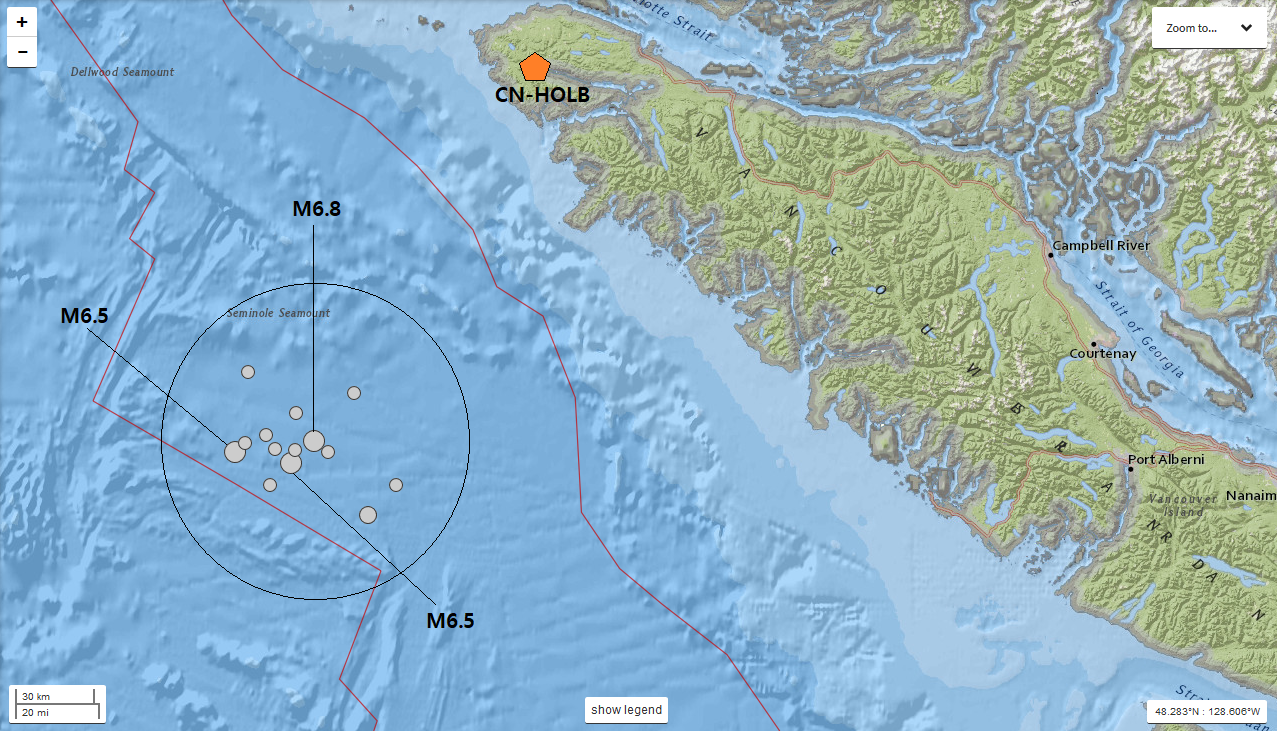
 A map of the earthquake swarm. The circle details the likely earthquake swarm zone. The 3 largest earthquakes are labeled as well as one of the closest seismic stations to this swarm. Station HOLB in the CN network is what I will use for the plots below. During October 22-23, 2018, a large earthquake swarm struck off the northern tip of Vancouver Island. Actually, this swarm occurred extremely close to the epicenter of the smaller swarm that struck on February 13-14, 2019. This swarm I will talk about in this post contained many M4's, some M5's, and 3 earthquakes above M6.0. The 3 earthquakes above M6.0 were reported as M6.5, M6.8, and another M6.5 just after the 6.8. Sadly, the depths were not constrained on any of these earthquakes so all of the earthquakes have a depth set to 10.0km in depth. Obviously it is impossible all of the 14 events occurred exactly at that depth, so it is sad that we cannot add that part of the analysis into the equation. Also, this is likely the largest earthquake swarm this area has seen. Although, as seen below, many M6.0 and above earthquakes have struck since the early-1900s, this has the highest concentration and magnitude of any other swarm in this location since the early-1900s. I could be wrong, but that is what it is looking like! In this post I detail much of the swarm via seismic images and plots. If you haven't already, please click the title of this post or "read more" to continue. Description of these events according to USGS: -Over the course of 43 minutes on October 22, 2018 a series of M6.6, M6.8 and M6.5 earthquakes occurred off of Vancouver Island, Canada. These earthquakes occurred as a result of strike-slip faulting at shallow depths on the boundary or within the interior of the Explorer microplate. Focal mechanism solutions for the earthquakes indicate rupture occurred on either a near-vertical right-lateral northwest-southeast striking fault, or along a near-vertical left-lateral northeast-southwest striking fault. The tectonics of the Pacific margin of North America between Vancouver Island and south-central Alaska are dominated by the northwest motion of the Pacific plate with respect to the North America plate at a velocity of approximately 50 mm/yr. Convergence between the northern extent of the Juan de Fuca plate (also known as the Explorer microplate) and North America plate dominate the regional tectonics. The Explorer Ridge along the western side of the Explorer plate and the Sovanco Fracture Zone to the south define the boundary between the Pacific and Explorer plates. To the east, the Explorer plate subducts beneath the North American Plate. Eastward of the Sovanco Fracture Zone the Nootka fault separates the Explorer plate from the Juan de Fuca plate. As a result of these forces the Explorer plate is internally deformed and faulted and can produce diffuse seismicity away from its boundaries. Although a larger earthquake cannot be ruled out, previous sequences of large, closely spaced events in this region have not resulted in larger events, including a M 6.6 and M 6.4 in 2008 that were separated by an hour. The Explorer microplate is heavily deformed by internal dextral faulting, experiencing frequent moderate-sized earthquakes. Within approximately 70 km of these earthquakes, 11 earthquakes of M 6 or greater have occurred since 1951. The largest previous recorded earthquake in this region was a M 6.8 event that occurred on December 17, 1980. 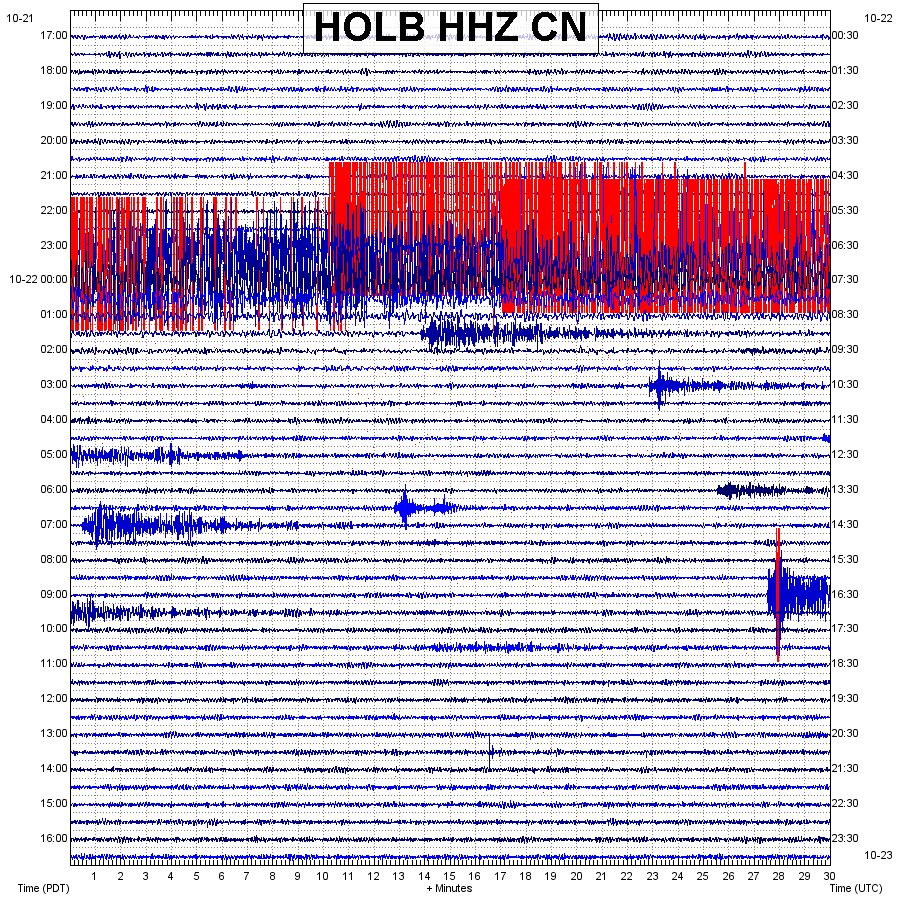 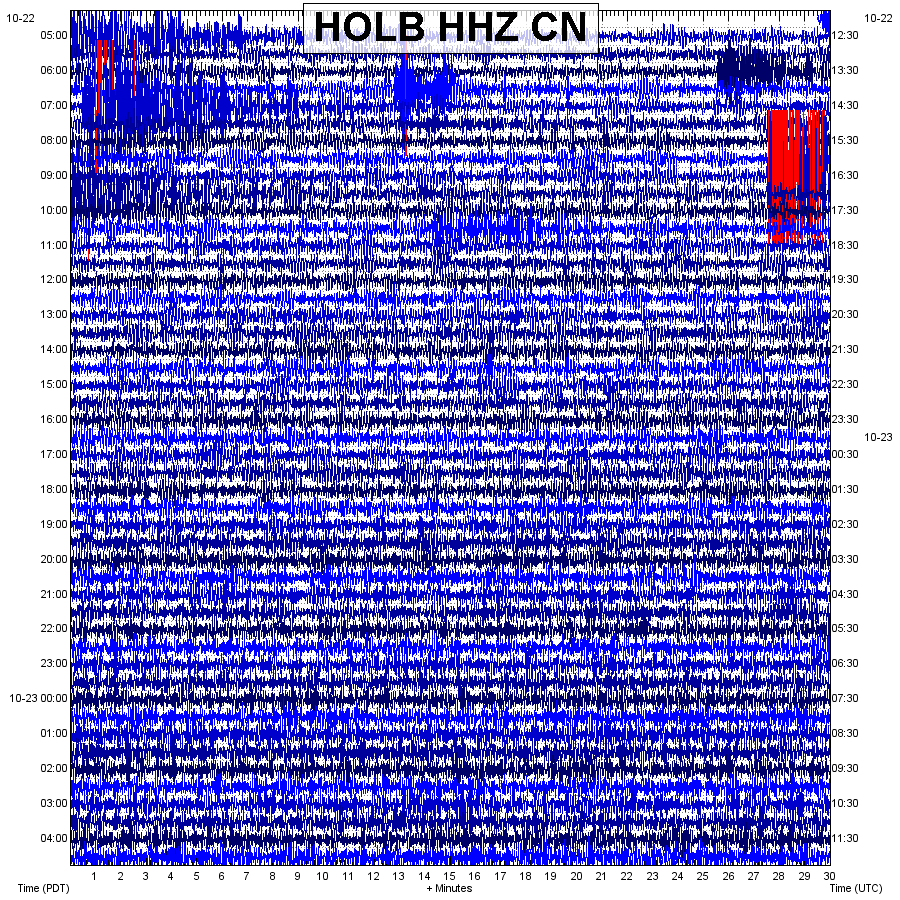 The helicorder charts shown above are from HOLB in the CN network, which is one of the closest stations to this swarm and is the station I used to generate the seismic plot images shown below. From 00:00UTC October 22, 2018 to 00:00UTC October 24, 2018, over 75 seismic events of all sizes were detected by seismic stations all across Vancouver Island, Canada, and the United States. Some of the largest events, M6.0 and above, were detected on seismic stations all across the world (as earthquakes of that size should). Only 14 of the 75 earthquakes were reported for that time period. The total count was determined by using P wave cross correlation and the true count of earthquakes is likely to be much higher than that. Sadly, the depth was not constrained so that means all of the events show 10.0km in depth which is likely to be very inaccurate. If you wish to visit the USGS EQ map which details the 14 reported earthquake events, please CLICK HERE. Although the professionals do state events like these have transpired here before, I doubt none have occurred in such rapid succession with such intensity. Until I see otherwise, I do believe this is the largest swarm this area has seen (at least since the early-1900s). A lot of increased activity has occurred over the past few years at both the northern and southern ends of the Cascadia Subduction Zone. What does this mean? I don't know yet, but it sure is interesting! Another interesting thing to note is the fact that many of the earthquakes in this swarm, including the largest ones, contained much low frequencies than what I would expect. Although the closest stations were some distance away, we should have seen higher frequencies than what was shown. I don't know what this means yet, but I am looking into it. Below I will show the event pages, followed by their seismic plots, of the more important reported events. The events will NOT be in order of time and date. However the slide shows at the bottom should be mostly in order! In the two slideshows I will detail many of the events that transpired during the swarm, especially the unreported events. Remember to always pay attention to all chart labels and any captions beneath any images. Let me know what you think!  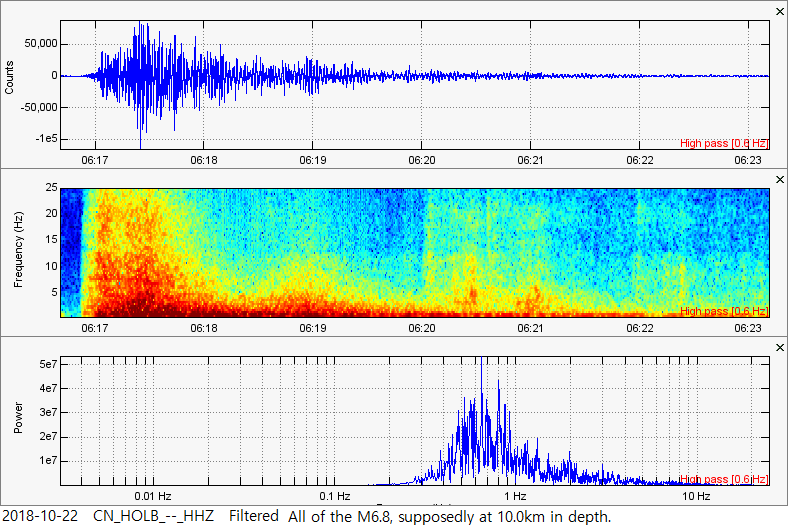 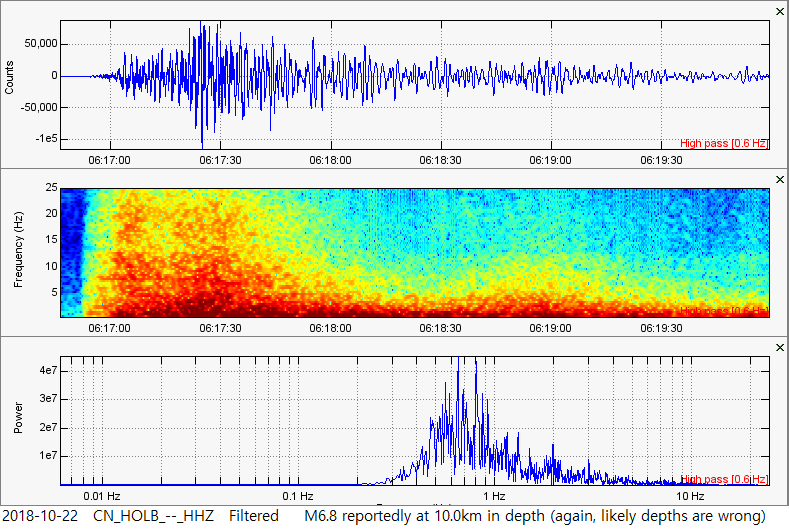 A "zoomed-in" look at the M6.8. 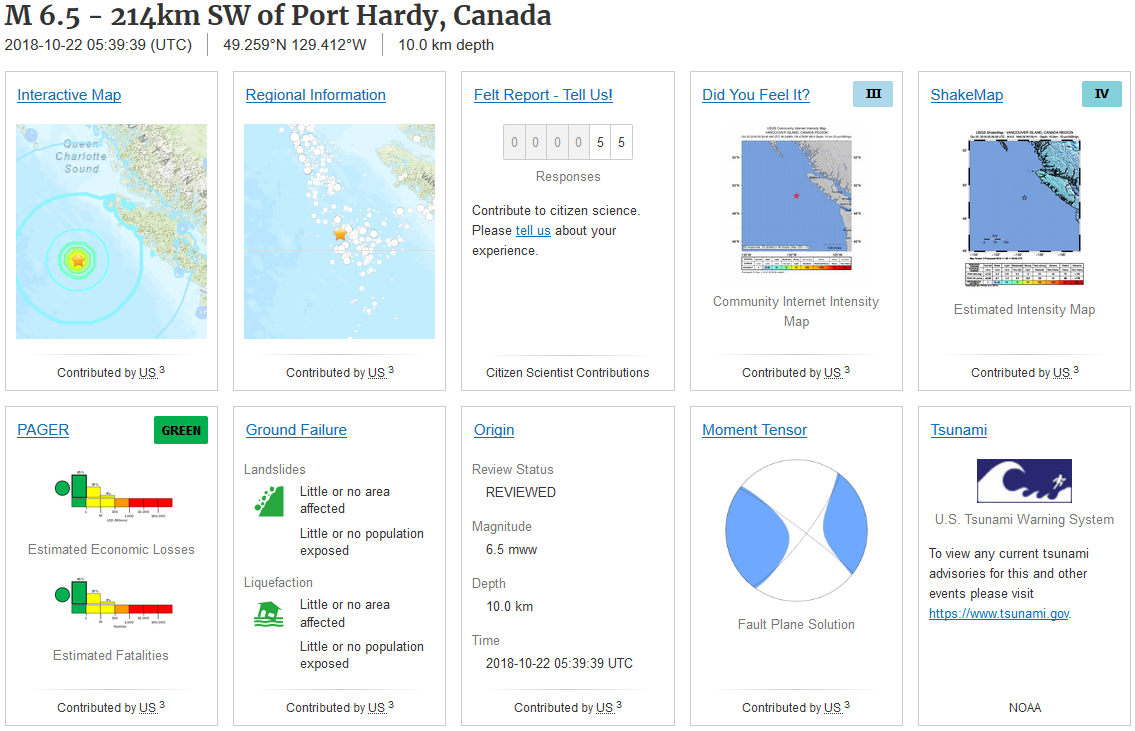 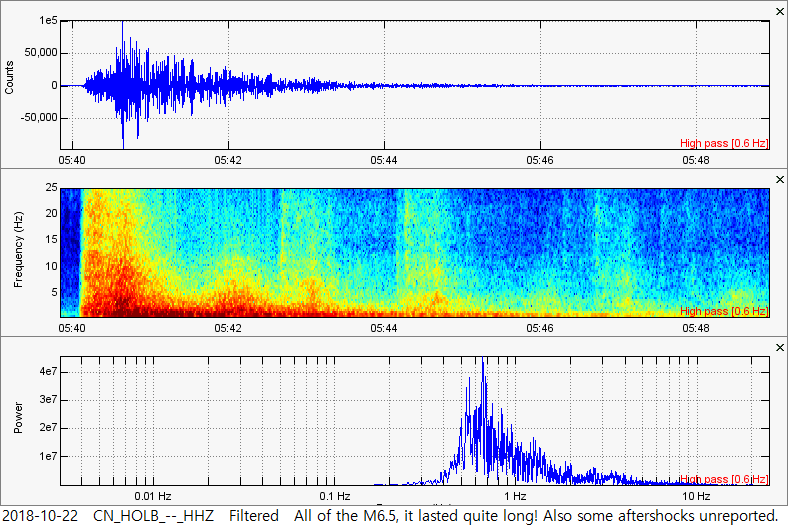 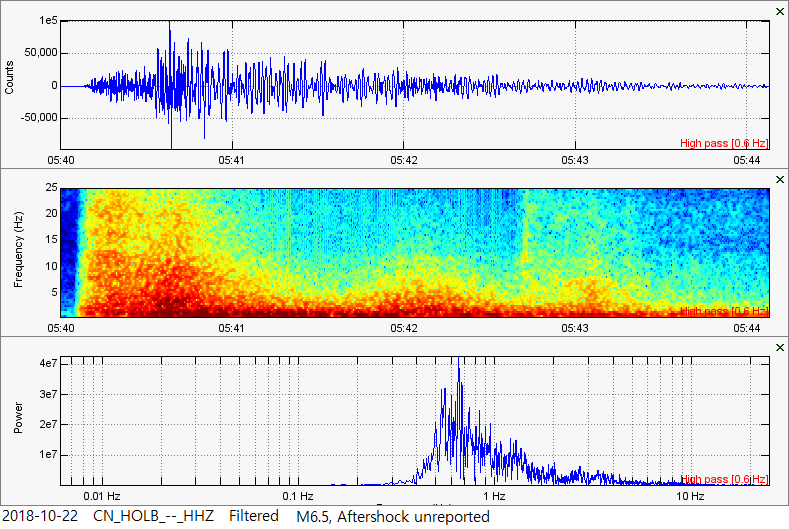 A "zoomed-in" look at the first reported M6.5. 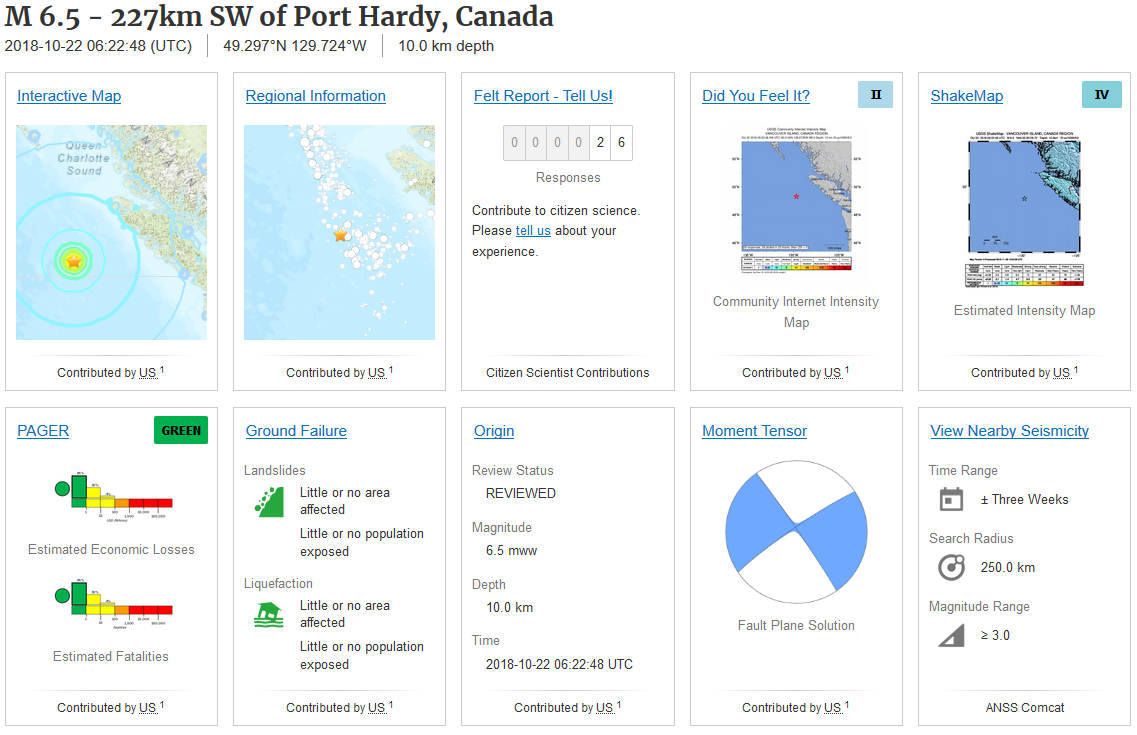 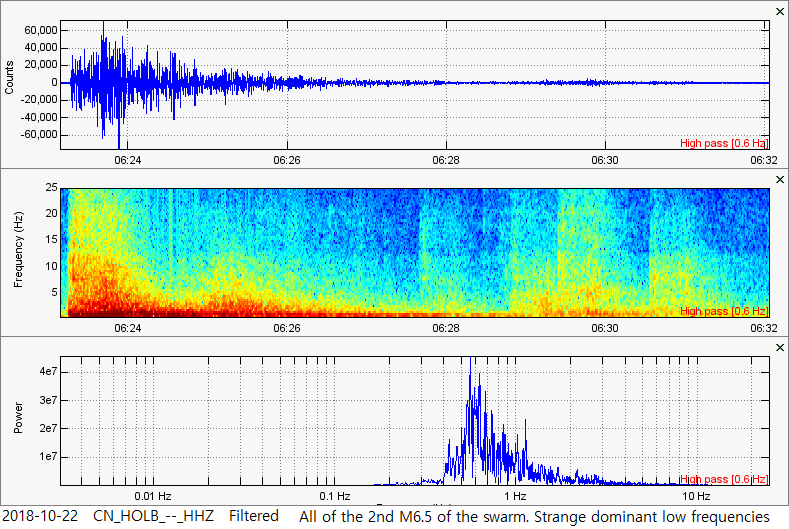 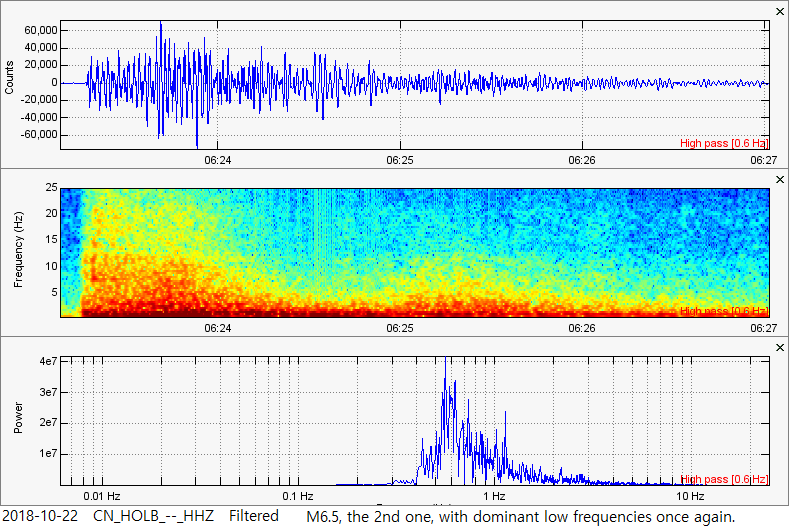 A "zoomed-in" look at the second M6.5 which occurred just after the M6.8. 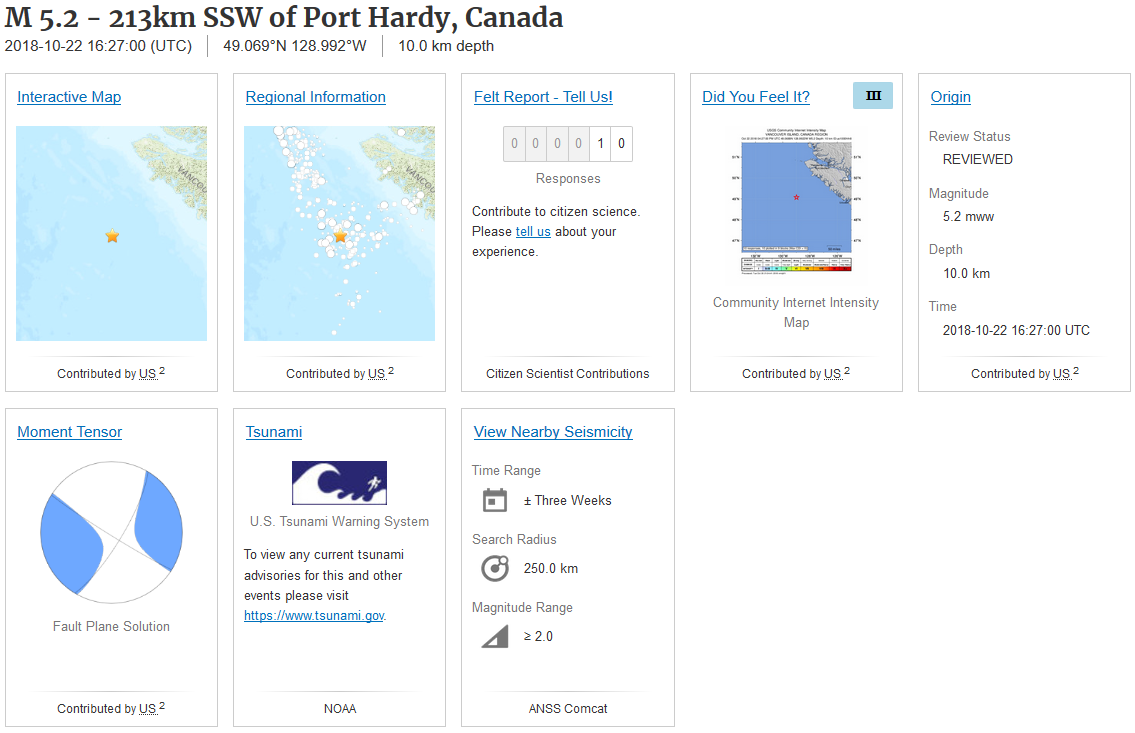 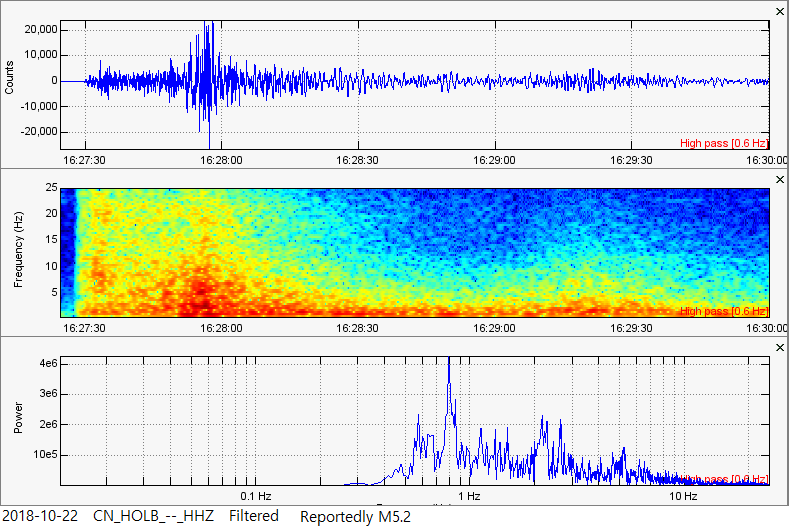 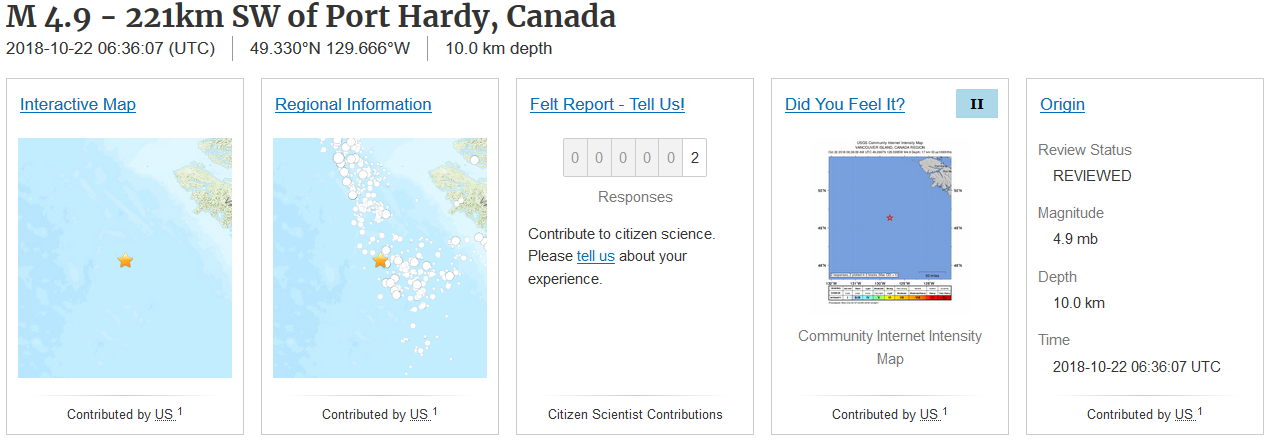 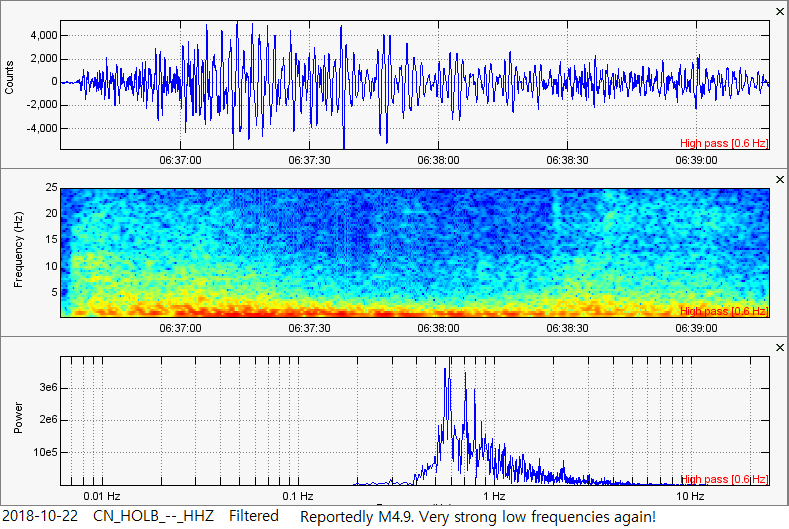 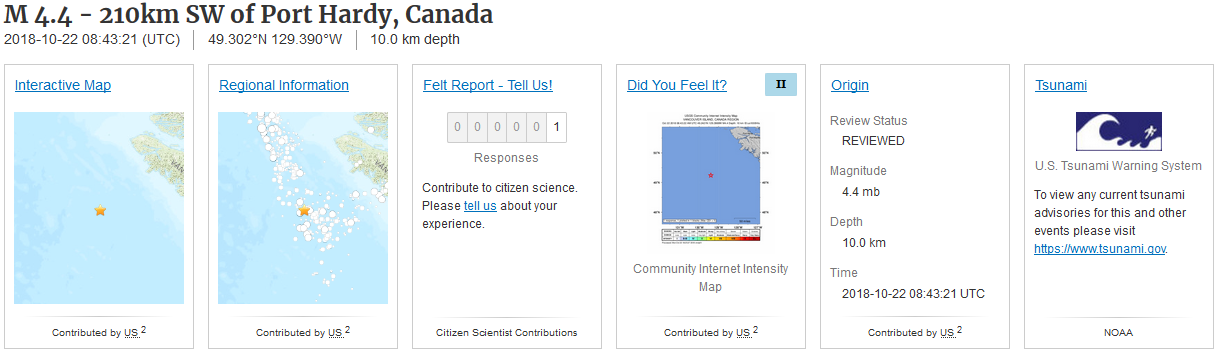 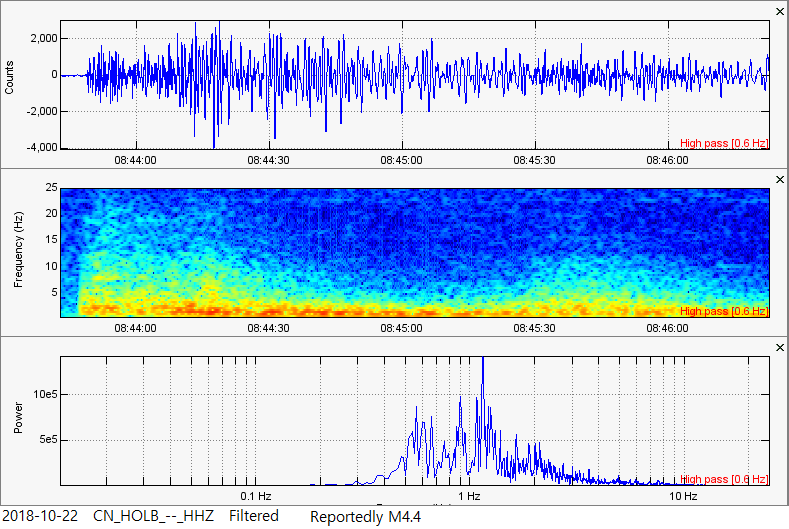  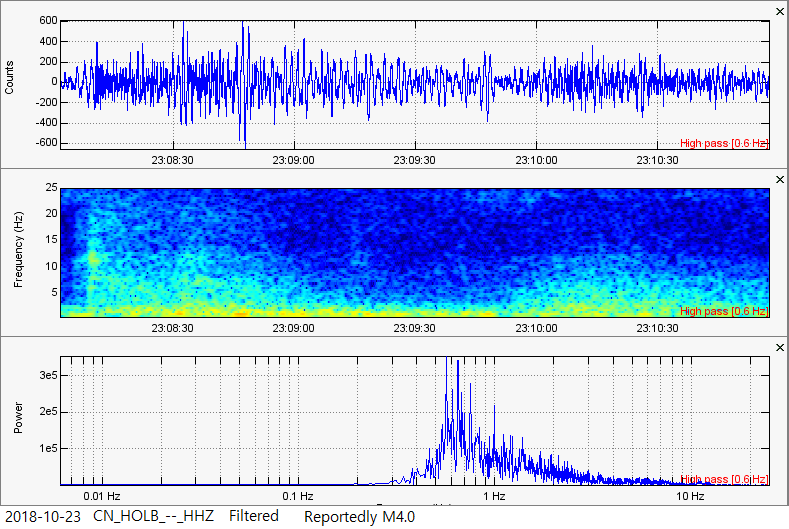 In the two slide shows below I will show multiple reported and unreported events. There are 30 3-plot images with 15 of them in the first one and 15 of them in the second one. Use the arrows to skip through the plots. Again, remember to pay attention to all chart labels! As usual, all times are in UTC and all the plots are labeled and dated.
0 Comments
Leave a Reply. |
About
This blog page is solely for interesting earthquake swarms that occur in locations other than the ones I already have posted. Pretty much any earthquake swarm I am interested in, that cannot be placed on other pages, will be placed here. Please click the title of each post or "read more" to view each swarm. Archives
October 2019
Categories |
 RSS Feed