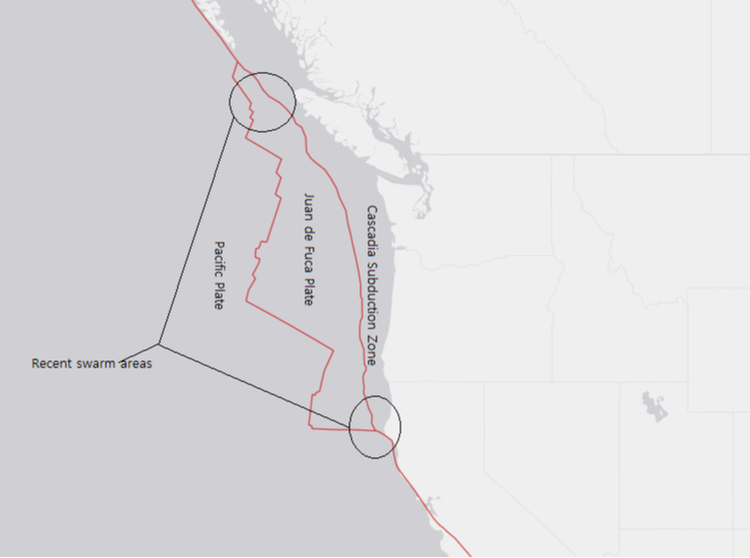
 During late February 13th into the 14th, a strange earthquake swarm appeared under the northern section of the Cascadia Subduction Zone, off the coast of the northern tip of Vancouver Island. It is interesting to note, as seen in the image above, that some swarming has been occurring off and on both near the northern and southern ends of the Cascadia Subduction Zone. The largest earthquake of the Feb. 13-14, 2019 swarm off Vancouver Island was first reported to be a magnitude 4.8, later upgraded to a magnitude 5.3. Although only 2 earthquakes were reported, which is too small to be considered a swarm, there were at least 28 other earthquake events I was able to detect using P wave cross correlation and studying the characteristics of the events themselves. To continue this post, please click the title or "read more" if you have not done so already. As stated above, late in the UTC day of February 13, 2019, a strange swarm started to break out off the coast of the northern tip of Vancouver Island. The majority of the seismicity as of late has been centered around two areas: near the end of the northern section of the Cascadia Subduction Zone (CSZ) and at the end of the southern section of the CSZ. What this means is beyond me, at least for right now. Below is an illustration, put out by oregon.gov, of the Cascadia Subduction Zone: 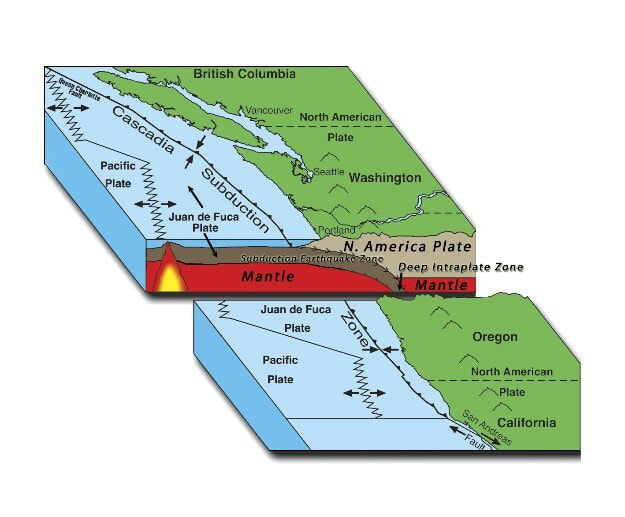 If you don't know what the Cascadia Subduction Zone is, then please CLICK HERE. 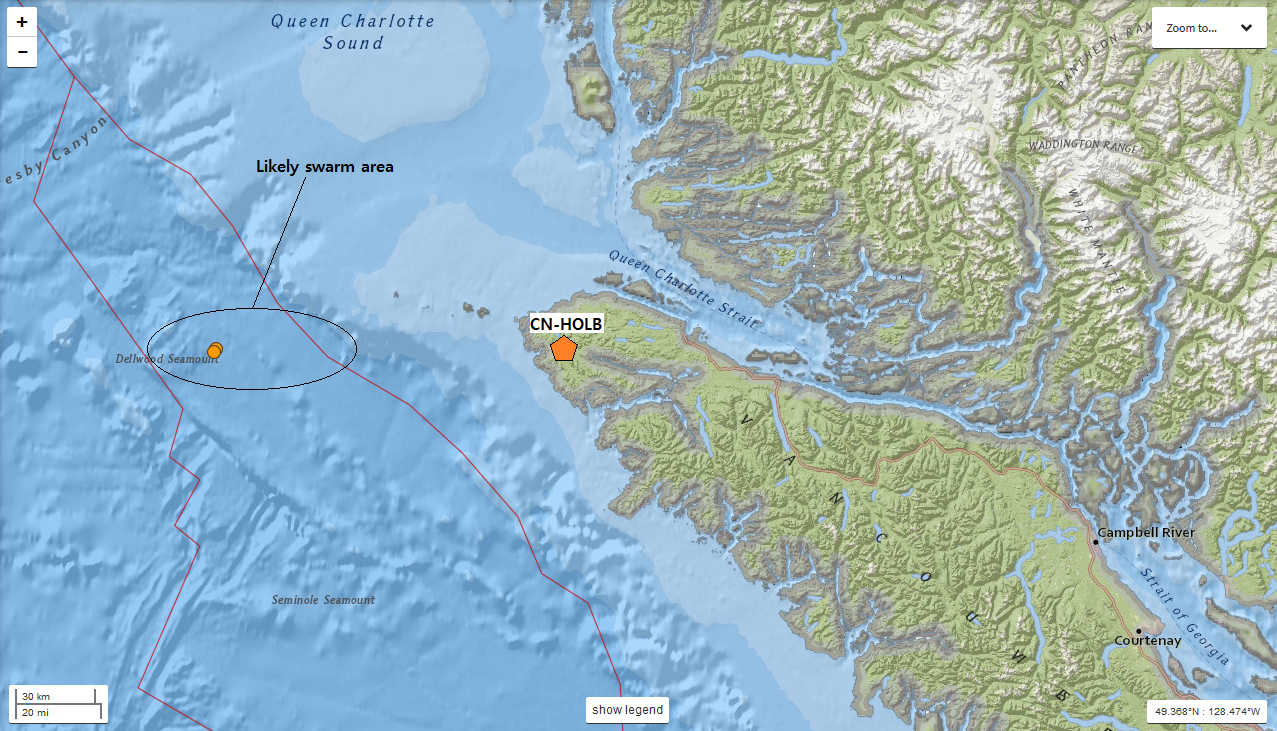 Only 2 events have so far been reported for this swarm that contained approximately 31 events. The circled area is the likely swarm zone and the orange pentagon shows the closest seismic station to this swarm. The image above shows the likely swarm epicenter and the closest seismic station: HOLB in the CN network. Now remember the bottom of the ocean can be very volcanic. Though it is likely these are caused by tectonic stresses, you should never completely rule out some type of volcanic or deep magmatic activity. Now swarming has occurred in this location before. A few months ago there was actually a swarm of many events, including multiple M6.0s and one that almost reached M7.0. Please CLICK HERE to view the post dedicated to that large swarm on October 22-23, 2018. This swarm I am detailing in this post contained approximately 31 earthquakes of many different sizes from around 22:40UTC February 13, 2019 to about 19:34UTC February 14, 2019. That was determined by using the program WAVES, data collected from nearby stations, and cross correlating their possible P wave arrivals. Below I will first show one of the more energetic parts of the swarm and then I will show the helicorder image for station HOLB. It shows some of the events that transpired during this swarm, including the 2 reported events. Then I will show the USGS event pages for the 2 reported events, including their custom made 3-plot images. After that I will show about half of the events within this swarm via my custom 3-plot images and a slideshow. Remember to always pay attention to chart labels and any captions beneath any images. 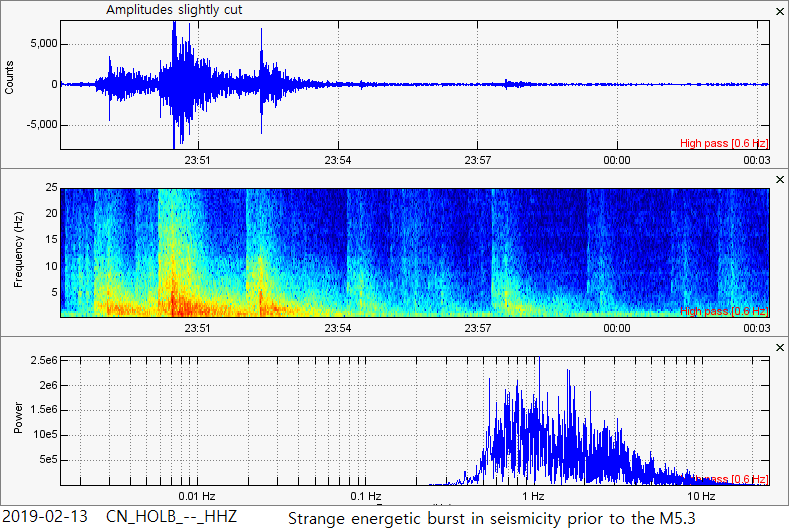 One of the more energetic parts of this earthquake swarm. Note it appears there are approximately 9 or so earthquakes of all sizes. This burst occurred about 30 minutes or so prior to the M5.3 and all of these earthquakes are still not reported (as of 9:00pm PST 2019-02-14). 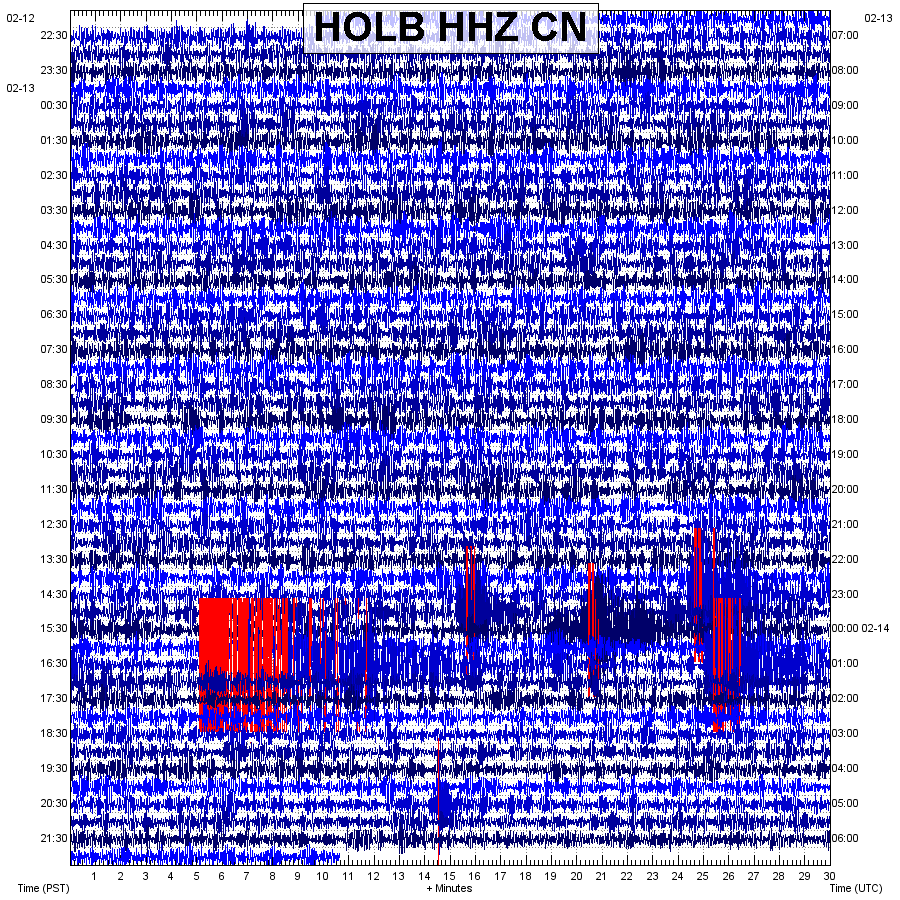 The helicorder chart showing many of the events during this swarm. 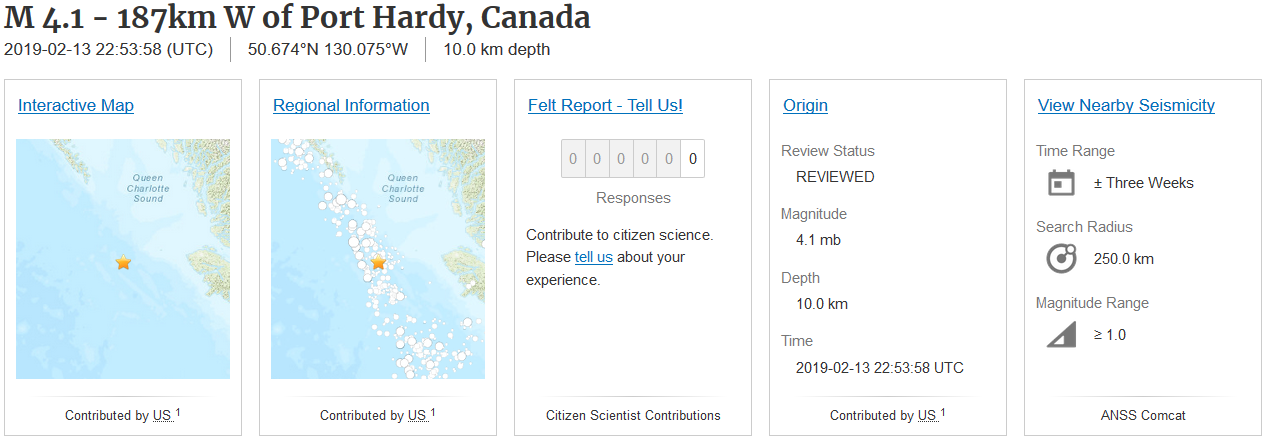 USGS event page for the M4.1. 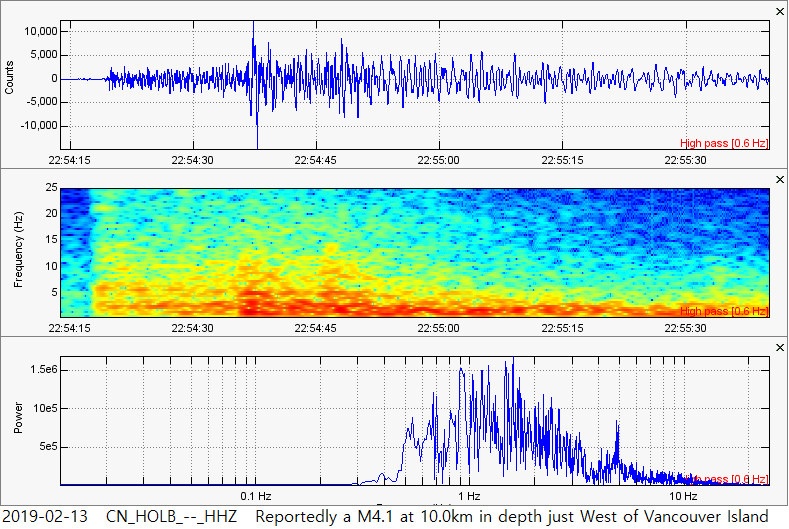 A seismogram, spectrogram, spectra 3-plot image detailing the M4.1 reported earthquake event. 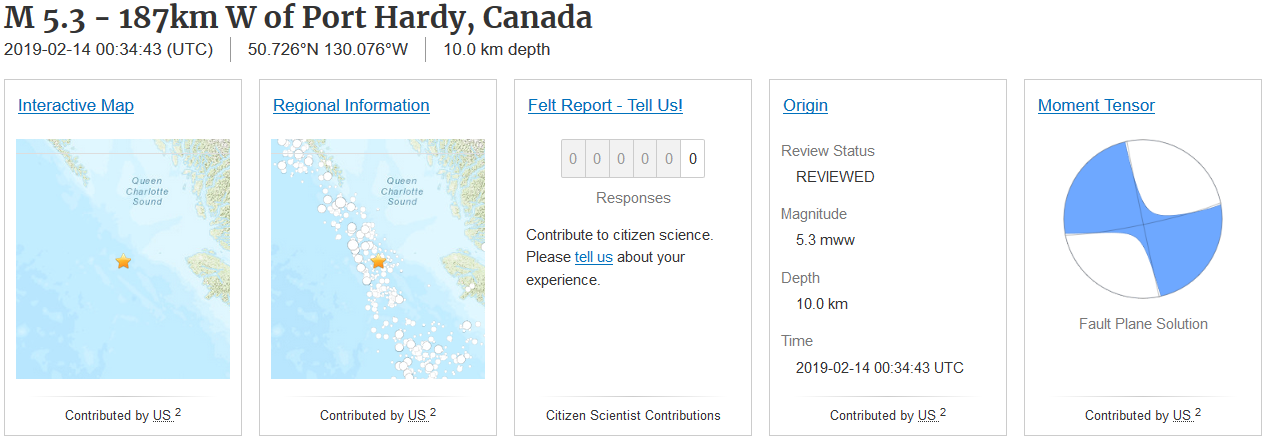 The updated USGS event page for the M5.3 (originally M4.8). Moment tensor included and nobody reported feeling this event (that doesn't necessarily mean no one felt it). 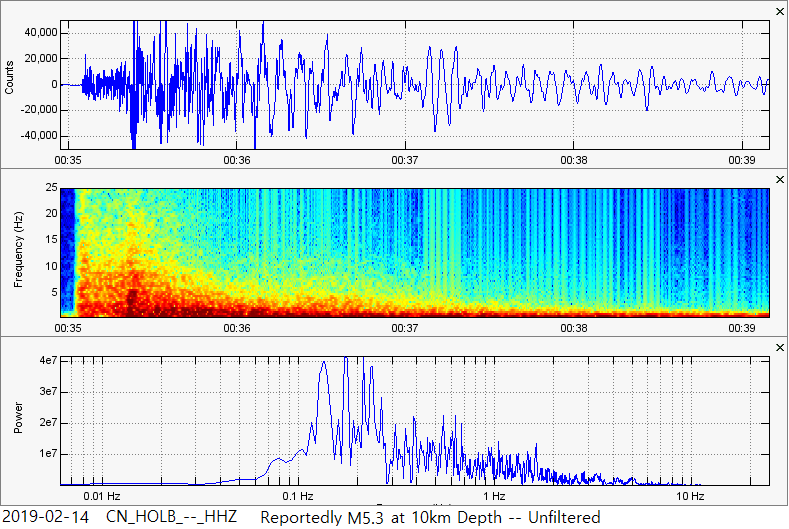 The entire, and completely unfiltered, M5.3 earthquake. This was the largest event of the Feb. 13-14, 2019 earthquake swarm. Although this was taken from the closest seismic station, it was still some distance away. However I am surprised we are seeing such low frequencies. Of course these were not low frequency earthquakes, but I was expecting these events to carry higher frequencies as recorded on this station. 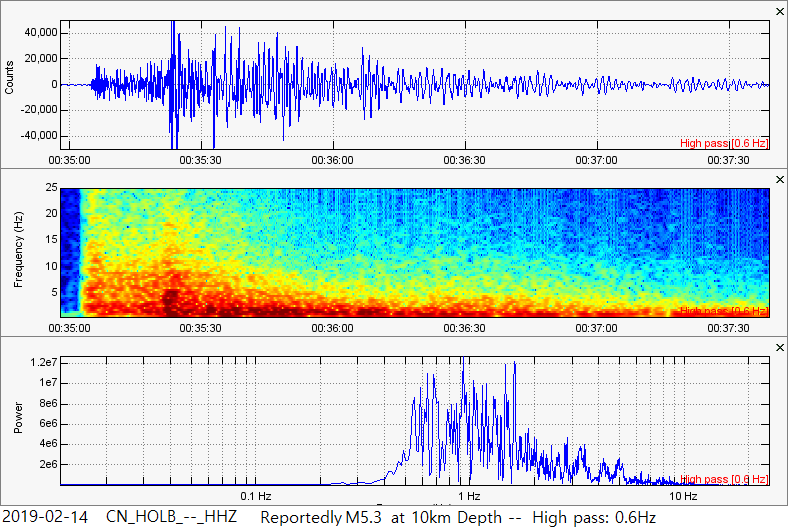 This 3-plot image is slightly more zoomed in than the 3-plot image directly above. This also contains a high pass 0.6Hz filter. 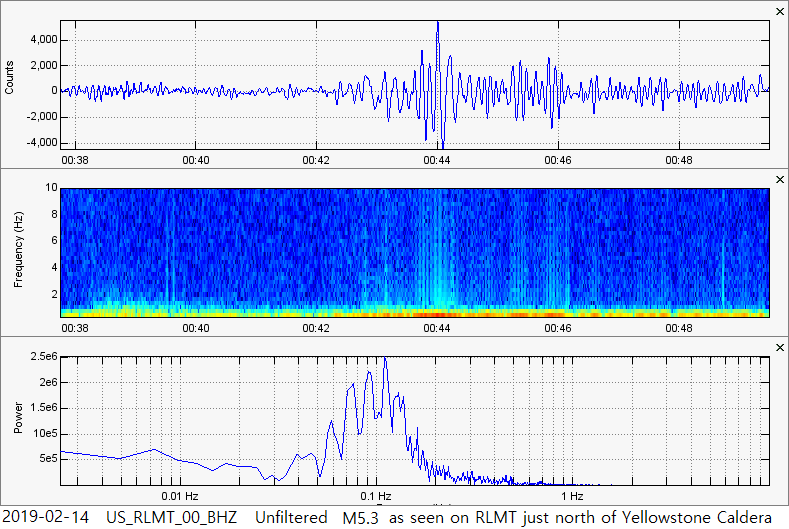 Unsurprisingly, the M5.3 off the coast of Vancouver Island was strong enough to be detected quite well on seismic station RLMT in the US network. RLMT resides in Red Lodge, Montana just north of the Yellowstone Super-Volcano. Now I am going to show you many 3-plot images of many events during this swarm (approximately half of them). There are 15 images within the slide show below. All plots are labeled and all times and dates, as usual, are in UTC format.
6 Comments
Jenni
2/15/2019 06:25:31 am
Hello. Happy heart day. Damn, really low frequences. This assumes worse activity expected? I knew it was coming, I was 100% but I didn't feel it. Saw it 30 minutes later... Thanks for shining light on a matter that will mean life or death for us coastal subduction zone residence. I am less than a mile from the Columbia River. If it was felt in Montana, would Yellowstone blow once the Cascadia plate slips? I know know one really knows, how likely? Silly to ask, I just am very interested in this the last 6 month's. There is a reason beyond me. I just wanna be around after the cracks begin to show. Thanks again for the hours you pour into this. I would totally tip you but I am less than poor. Once that changes you will most likely be my karma node. Please keep up the truth seeking. I love it.
Cindy smiley
2/15/2019 08:00:21 am
All I can say is Wow an keep up the good work :)
Ben
2/15/2019 12:28:06 pm
Hey Jenni!
Anne miller
2/15/2019 05:38:55 pm
Hey Ben. Anne here. This is pretty interesting. I have the QuakeFeed app and set for Yellowstone and Oregon Washington etc. my phone was beeping constantly today. My son noticed too. Ive posted on your YouTube channel before but live in Everett near Paine field. Glad the snow melted! I heard that snoqualmie pass had 8 feet of snow in 7 days!!!!
Ben
2/17/2019 11:30:36 pm
Hey Anne! Good to see (or in this case hear from) someone from near my area. Yup, very interesting seismicity as of late but everything is still calmer than what I expect. Yellowstone is even acting weird. Even the weather is acting weird worldwide! Leave a Reply. |
About
This blog page is solely for interesting earthquake swarms that occur in locations other than the ones I already have posted. Pretty much any earthquake swarm I am interested in, that cannot be placed on other pages, will be placed here. Please click the title of each post or "read more" to view each swarm. Archives
October 2019
Categories |
 RSS Feed