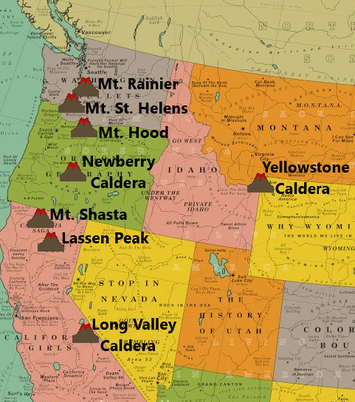
 This is the monthly volcano report for September 2019. If you already know what this usual intro says, please click the title of this post or “read more” to continue. The reported earthquake counts are taken directly from the U.S.G.S. and are only earthquakes reported, not earthquakes recorded. Regarding earthquake counts, it is likely that the reported earthquake total for a given location and time period, mostly during earthquake swarms, is lower than the actual count of earthquakes, in certain cases sometimes drastically lower. Remember, most earthquake swarms at volcanoes do not lead to eruptions. However, almost every eruption is preceded by some type of earthquake swarming and surface deformation. Therefore, swarms and deformation should always be monitored closely regardless of where you think the activity is headed. The volcanoes I will be doing monthly updates on are Yellowstone Caldera in Wyoming, Long Valley Caldera in California, Newberry Caldera and Mt. Hood in Oregon, Mt. Rainier and Mt. St. Helens in Washington state, and Mt. Shasta and Lassen Peak in California. In this update, we will look at reported seismicity counts. If you wish to see recent deformation for Yellowstone or Long Valley, please head to the “Deformation Updates” page which is updated every 2 months or so. The time period of the reported seismicity counts for this update, derived from the USGS earthquake catalog, is from 00:00UTC September 1, 2019 through 23:59UTC September 30, 2019 and magnitudes are always going to be -1.0 and above so you will see every single earthquake that was reported for this time period. The smallest earthquake ever recorded was a M-1.0 and the largest earthquake ever recorded was a M9.5. Also, the coordinate box I use for each volcano is exactly the same every month, so you always see the activity that occurred in the same area every month. Regarding the 3-plot seismic images I generate for the largest events, I will always try my best to use the closest seismic station to any given event. I will also add the link to the USGS EQ map showing the locations of reported seismicity for the location and time period in question. Volcanoes of interest for this month are Long Valley Caldera and Mt. Shasta. Please click the title of this post or “read more” to continue… Yellowstone Caldera 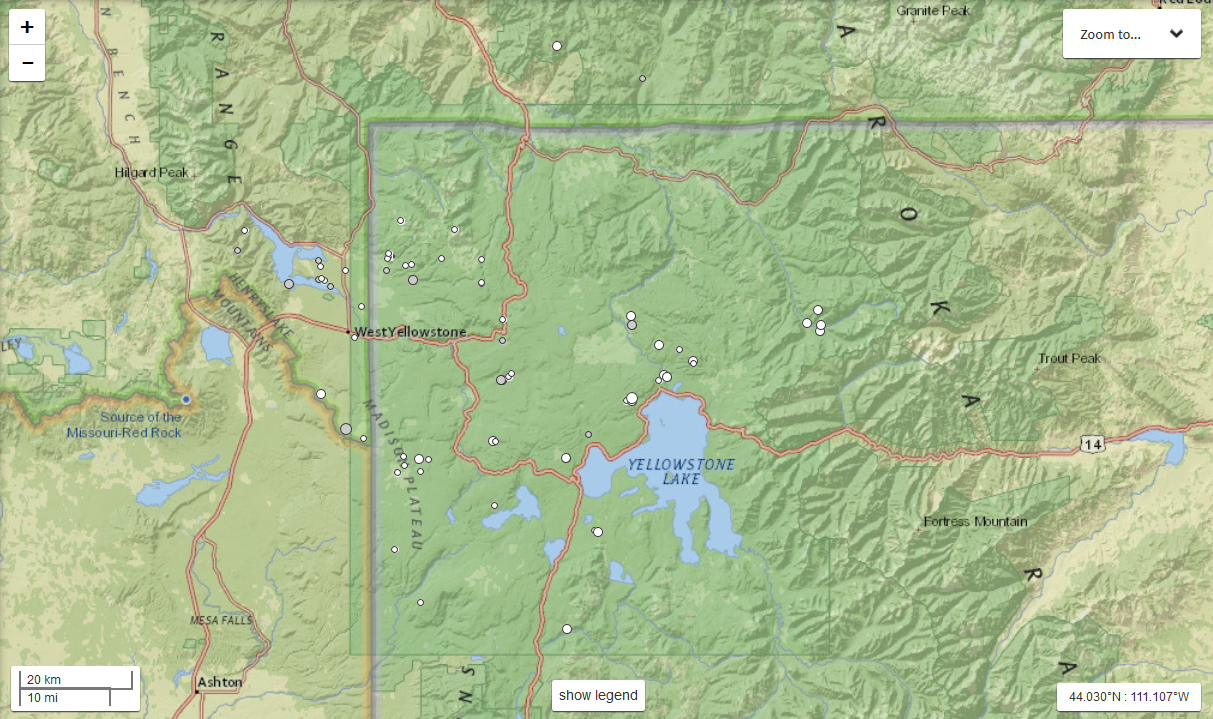 During September 2019, there were 72 reported earthquakes for Yellowstone National Park. This count is lower than the past 3 months and September was a boring month for Yellowstone earthquake enthusiasts. No moderate to major swarming took place during this month. Steamboat Geyser, which resides in the Norris Geyser basin, continues to shatter the 2018 record since it broke the record on August 27, 2019. Steamboat erupted 4 times in September 2019, basically once per week. As of the time of this writing, October 9, 2019, Steamboat has erupted 39 times in 2019, 71 times since it reactivated in early-2018. The largest earthquake within Yellowstone National Park for September was a M2.4 at 15.7km in depth. It struck on Sept. 8, 2019 at 19:59UTC along the western border of the national park, just 17km south of West Yellowstone, MT. Plots are shown below of this event. 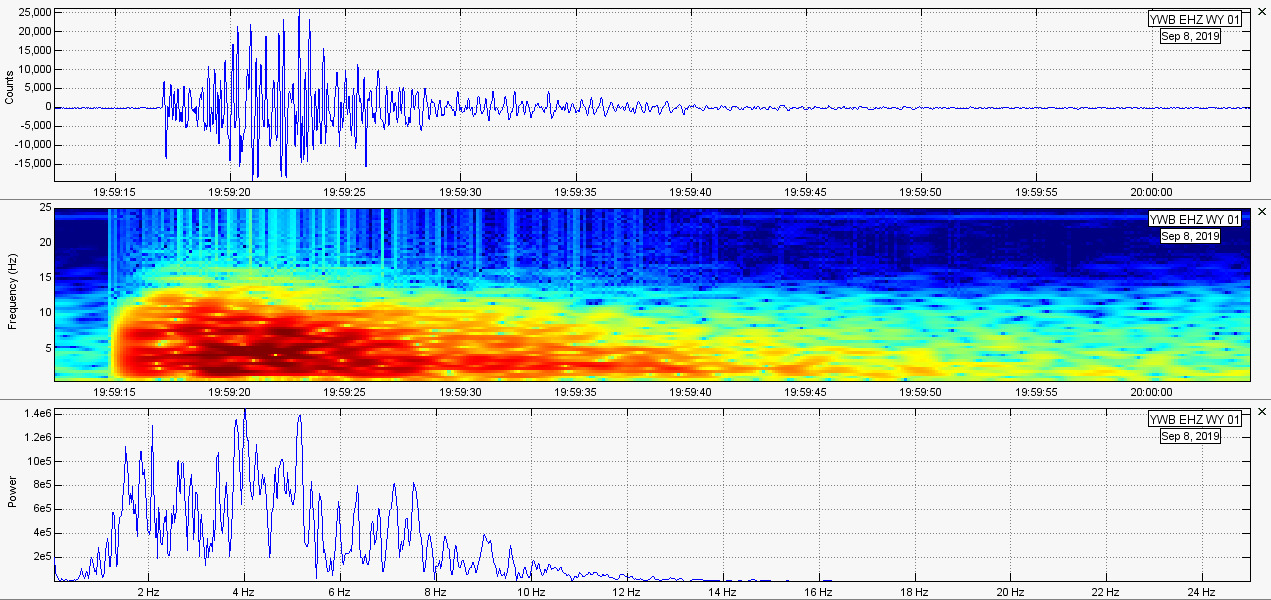 Long Valley Caldera 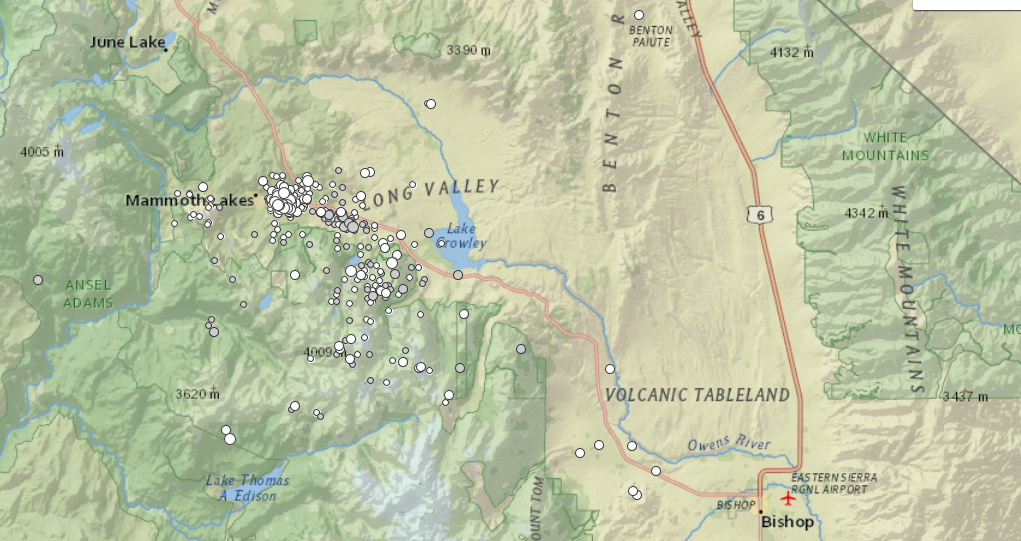 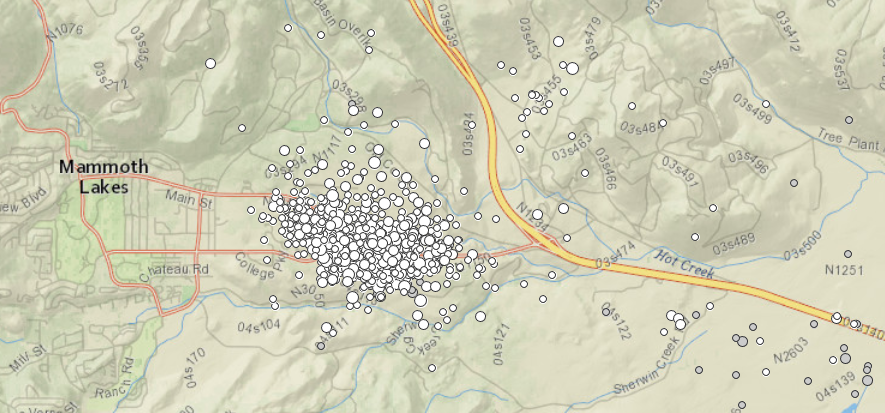 Most of September's seismicity occurred near Mammoth Lakes within a concentrated area. September 2019 was a very active month for Long Valley Caldera. There were a shocking 1,115 earthquakes reported for the Long Valley Caldera area during this month. A large majority of the seismicity occurred as part of swarming near Mammoth Lakes, CA which resides within the caldera itself. Please click the button above if you wish to see some info and data pertaining to the energetic swarming that took place. The swarming started on Sept. 13 and struck on and above the roof of the magma chamber beneath the caldera. The swarm also was non-linear in formation and looks more like fluid flow rather than tectonic activity. Also, for a few months prior to September, seismicity was slowly growing for the caldera. For example, June saw around 340 quakes reported, July saw around 405, August saw around 643, and September of course saw around 1,115 earthquakes. The largest events of this month were actually two M3.0 earthquakes. One occurred at 5.3km in depth on September 25 as part of the ongoing swarming near Mammoth Lakes, CA. The other one struck at 5.1km in depth on September 27 along the southern rim of the caldera. Both quakes were reportedly felt by multiple people. The plots below are of the M3.0 on September 25, 2019 which struck near Mammoth Lakes, CA. 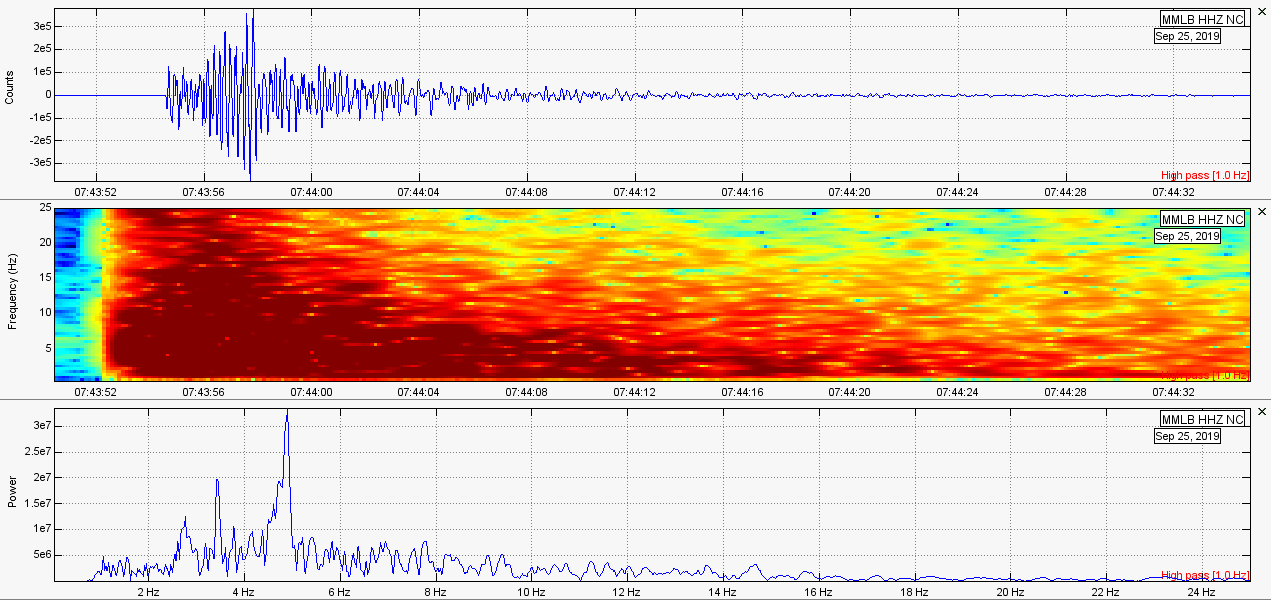 Newberry Caldera 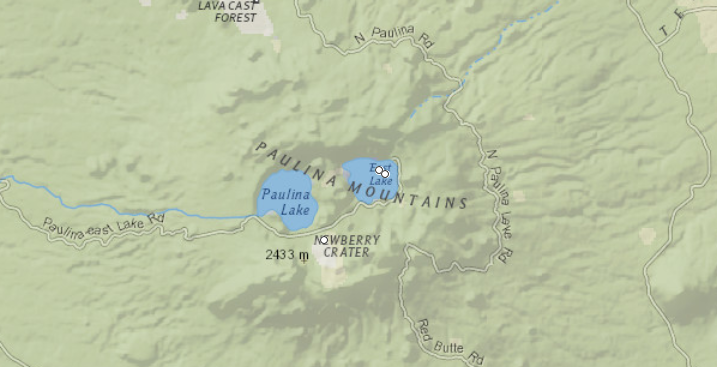 Newberry Caldera saw a total of 3 reported earthquake events for September 2019. Newberry remains within background levels and is usually very quiet. Low frequency earthquakes used to dominate seismicity for a few years at Newberry. However, as of the past 5 months or so, low frequency seismicity has not been reported or noticed by amateur seismologists. The largest earthquake reported was a M0.3 at 2.9km in depth on Sept. 16, 2019 at 12:00UTC just under the eastern caldera lake called East Lake. Plots below are of this event. 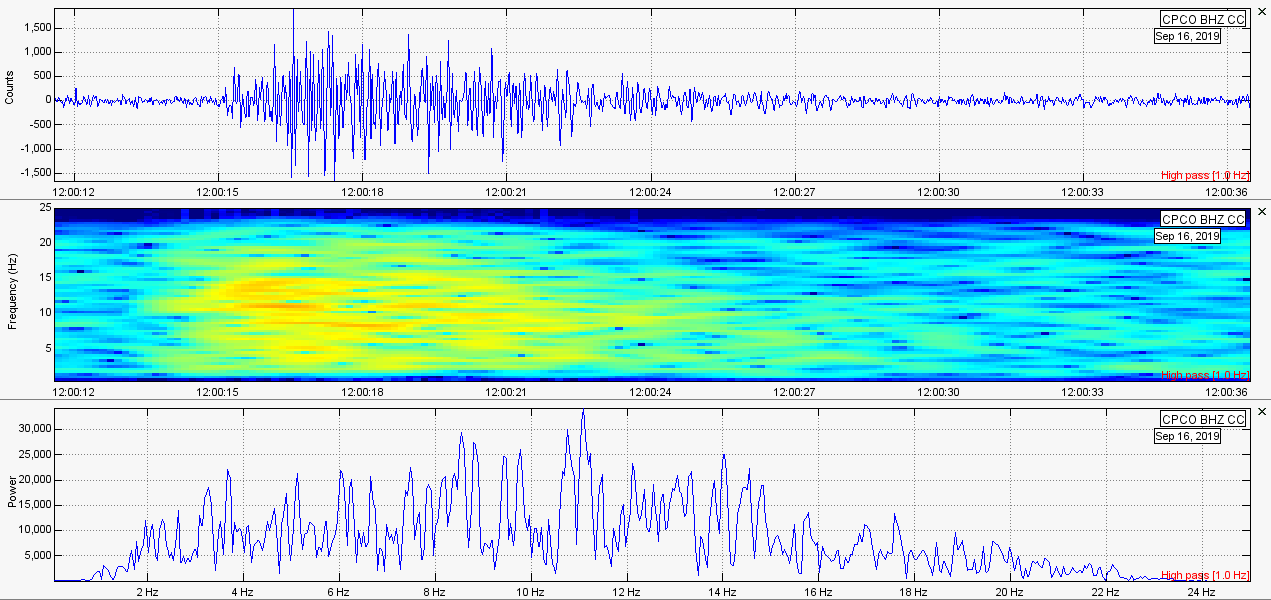 Mt. Rainier 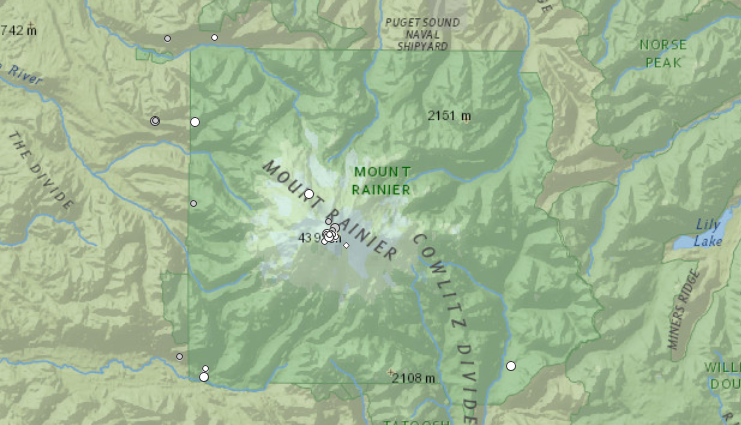 During September 2019, Mt. Rainier saw 27 reported earthquakes. This is higher than last months total of 21 earthquakes. Included within the 27 reported events there was a strange M-0.0 "Other Event", which will be mentioned in just a second. Most of the seismicity this month occurred within the volcano itself. The largest event was a M1.6 at -2.7km in depth. Very shallow, but still within the edifice of the volcano. It struck on Sept. 7, 2019 at 10:49UTC. Plots below are of this earthquake. 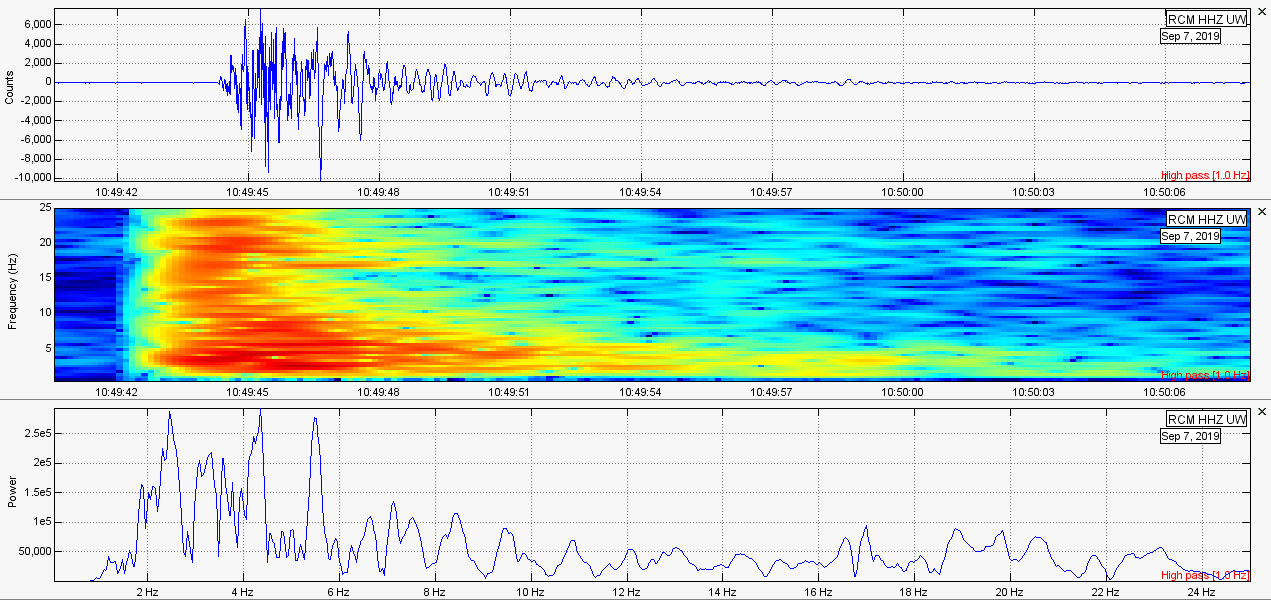 Now, on September 26, 2019 at 19:10UTC there was a very strange M-0.0 "Other Event" at -2.3km in depth under the SE slopes of the volcano. It does not appear to be a glacier earthquake or avalanche. However, it is a very strange event nonetheless. Was this truly seismic? Or was this surface activity? If this were a surface event, I doubt USGS would have labeled it as a M-0.0 "Other Event". The seismogram plots below are from 3 select stations around Mt. Rainier. Station RCS was the closest station to this event. Station OBSR is further to the northwest and station RUSH is even further west. So it is interesting this event traveled so far in the way that it did if this was a surface event. 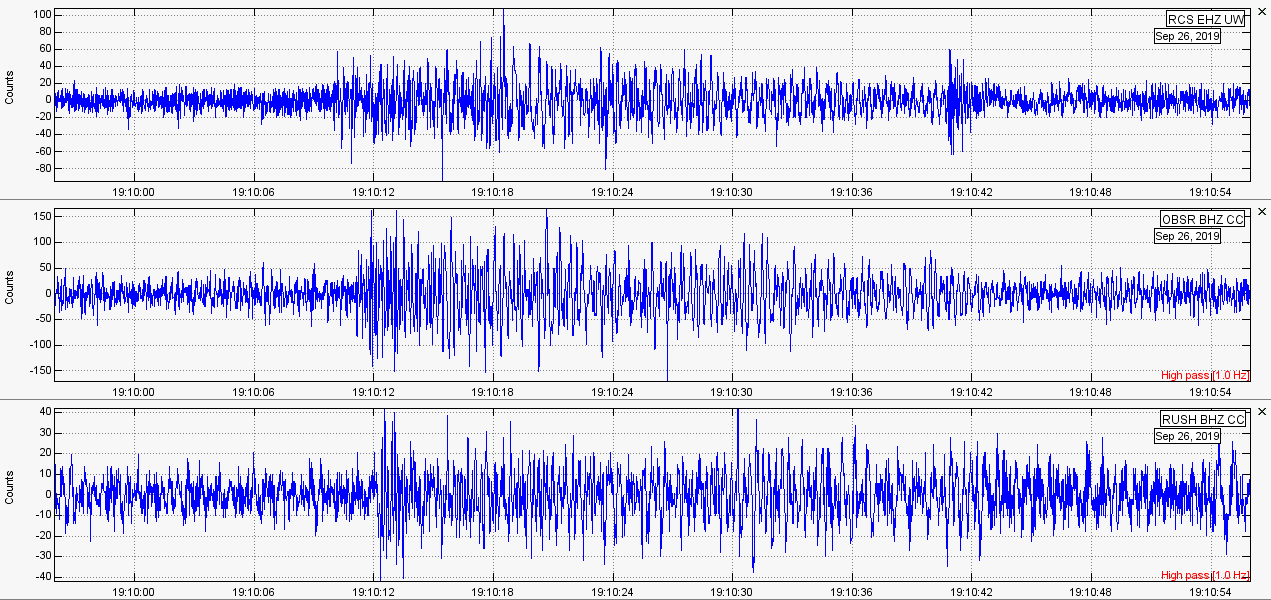 M-0.0 "Other Event" under the SE slopes of Mt. Rainier on Sept. 26, 2019. Mt. St. Helens 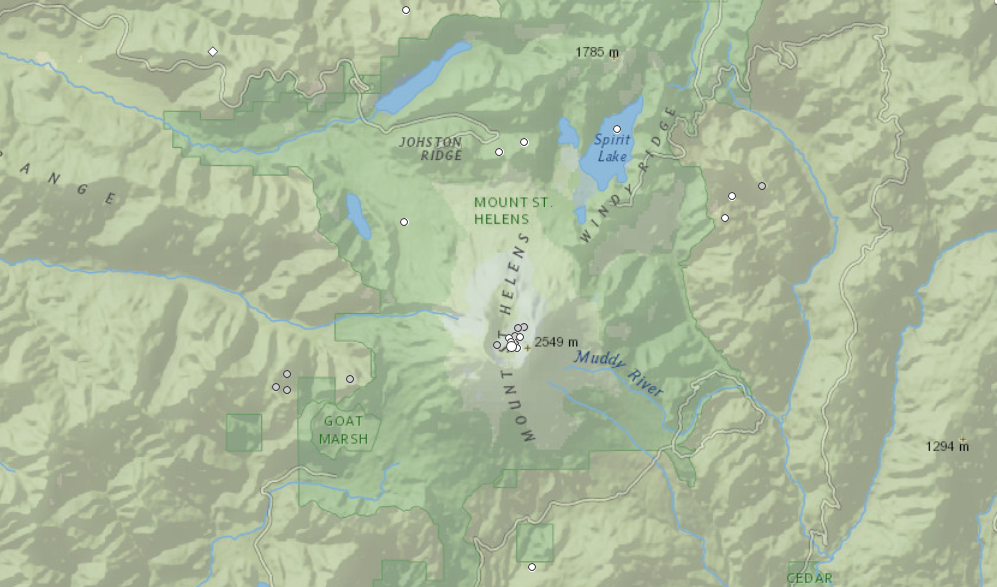 First off, I visited Mt. St. Helens on August 13 and September 12 of 2019. Both times I noticed the dome was slightly steaming, even though it was not steaming earlier in August when I first visited it. CLICK HERE to see the footage of St. Helens steaming on August 13. However, CLICK HERE to see it steam even more on September 12. Mt. St. Helens experienced 25 reported earthquakes for Sept. 2019. Most occurred directly under the summit. The largest event was actually an explosion to the NW but that was likely a logging blast of some sort. For the largest earthquake this month, it was reportedly a M1.0 at -1.1km in depth, very shallow right under the summit. It struck on Sept. 17, 2019 at 06:02UTC. Plots below are of this event. 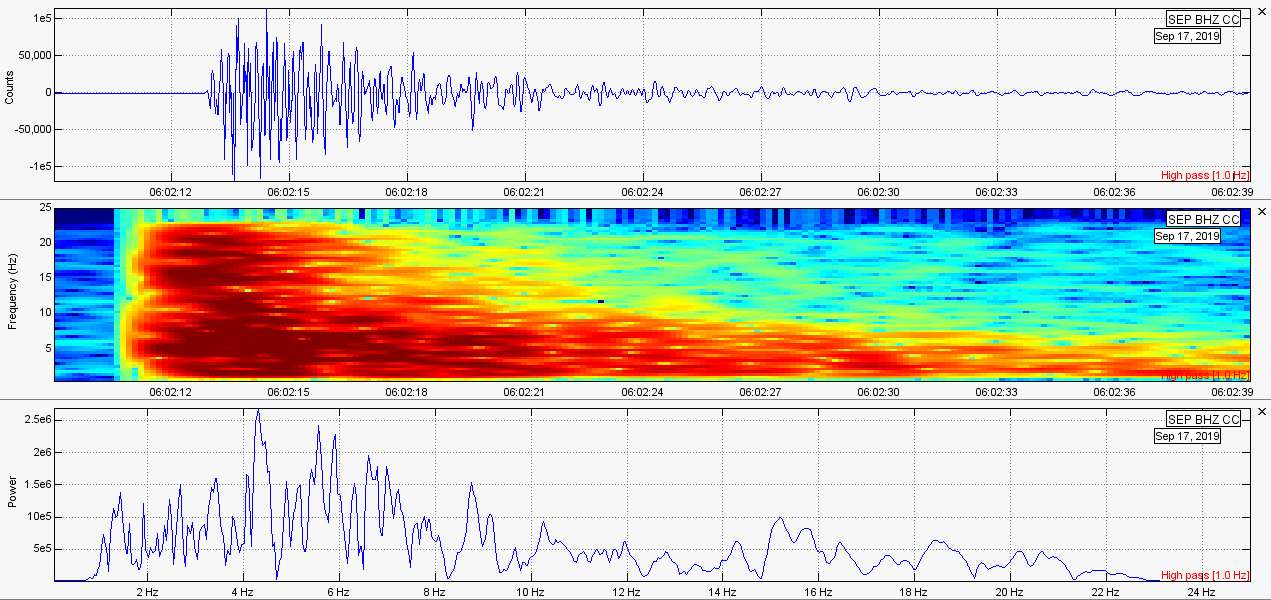 Mt. Hood 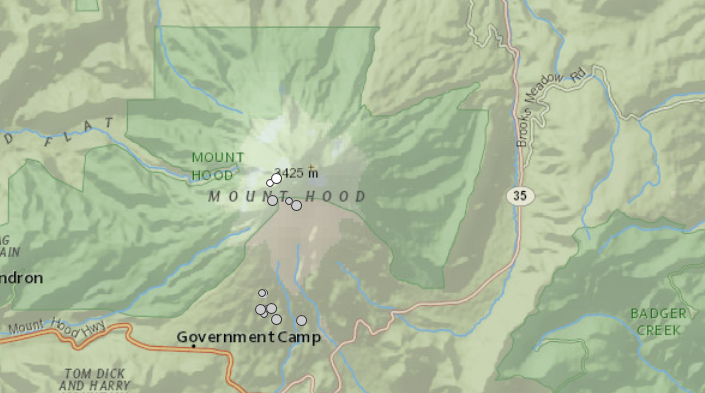 Mt. Hood in Northern Oregon experienced 13 reported earthquake events. That is 3 higher than last month's total. Remember, July saw a total of 155 earthquakes reported within only a few days. It was a very energetic and rapid-fire swarm so please CLICK HERE to visit my blog post about that crazy earthquake swarm. Most of the earthquakes this month occurred under the southern base of the volcano with a few striking under the volcano itself. The largest event of Sept. 2019 was a M1.6 at 6.8km in depth. It struck on Sept. 5, 2019 at 06:35UTC under the southern base of the volcano. Plots below are of this event. 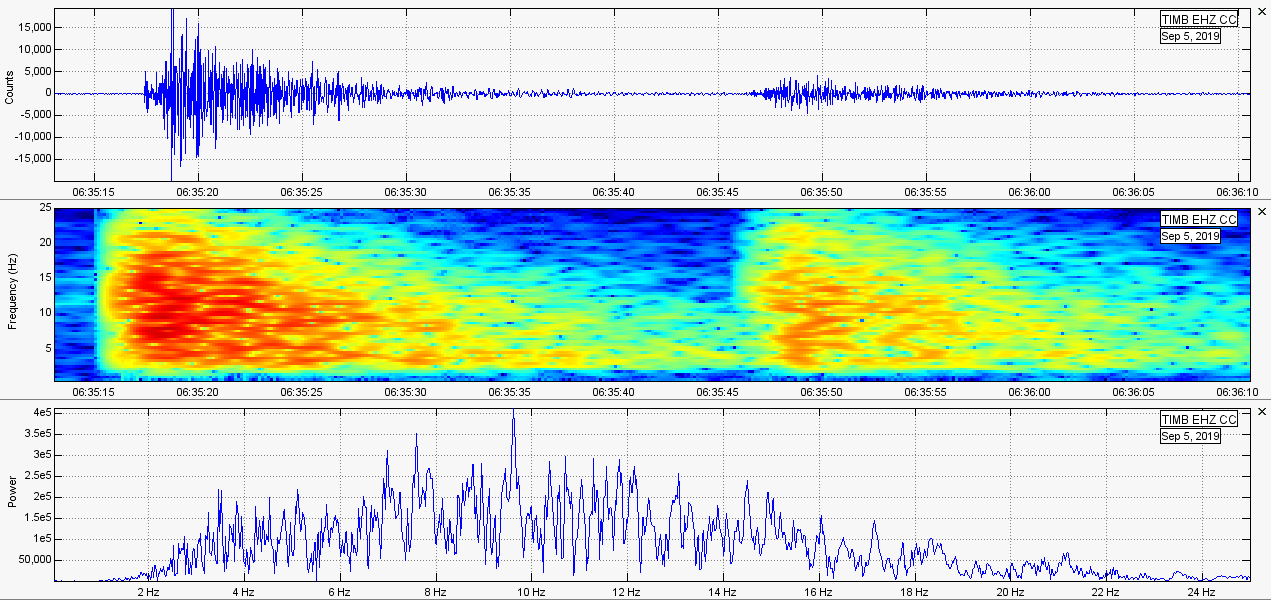 M1.4 is shown on these plots first. The 2nd event was a deeper M1.6. Mt. Shasta 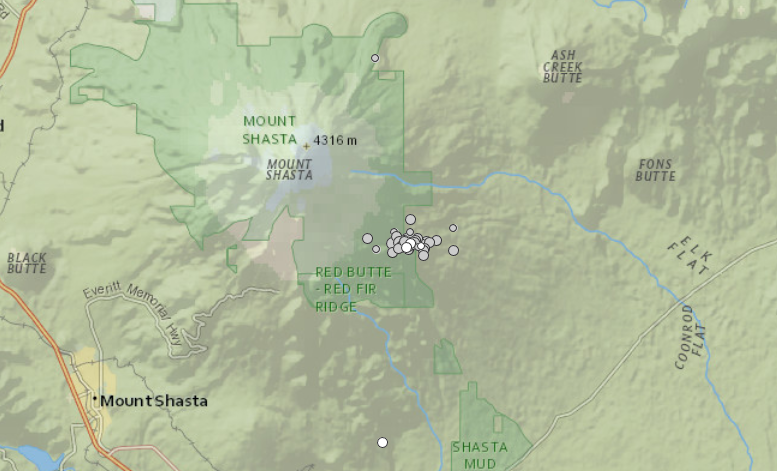 September 2019 was an extremely intriguing month for Mt. Shasta. Although Shasta typically only sees a few earthquakes reported per month, there were 47 events reported for Sept. 2019. Almost all of these events occurred within a very short time frame of 1 day and occurred in a concentrated patch under the SE base of the volcano. Although Mt. Shasta has seen swarms before, and this swarm was small compared to swarms at other volcanoes, this was likely the largest earthquake swarm to strike Mt. Shasta in decades. If you wish to see my blog post about this swarm, and the swarm many years prior to this, please CLICK HERE. The largest reported earthquake for Sept. 2019 was a M2.7 at 5.6km in depth on Sept. 2, 2019 at 17:34UTC. It occurred under the SE section of Mt. Shasta and struck as part of the Sept. 2-3, 2019 earthquake swarm. 19 people reported feeling the M2.7 which is impressive for an earthquake of that size and depth. Plots below are of this event. 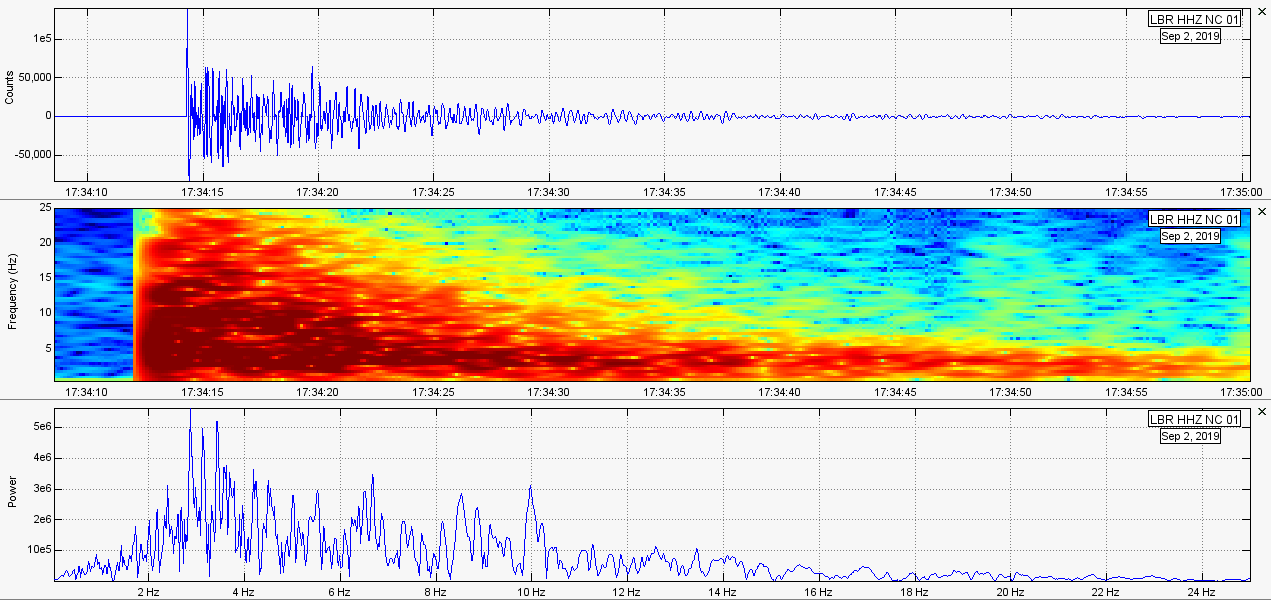 Lassen Volcanic Center (LVC) 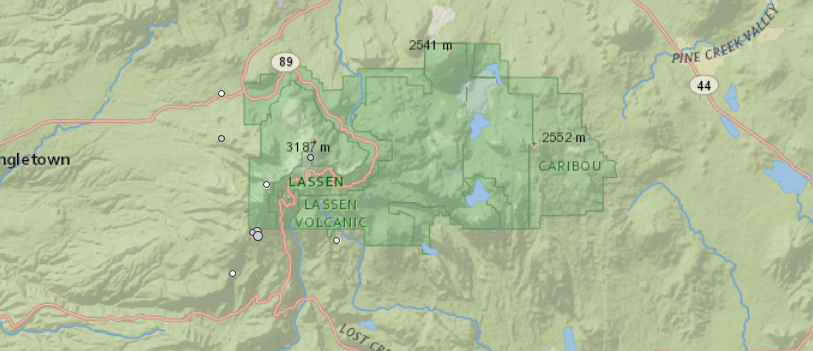 Lassen Volcanic Center, a.k.a. LVC, experienced 10 reported earthquake events for Sept. 2019. That is pretty low compared to the last two months of seismicity. The largest event this month was a M1.4 at 5.7km in depth on Sept. 4, 2019 at 10:38UTC. It struck just SSW of Lassen Peak. Plots below are of this event. 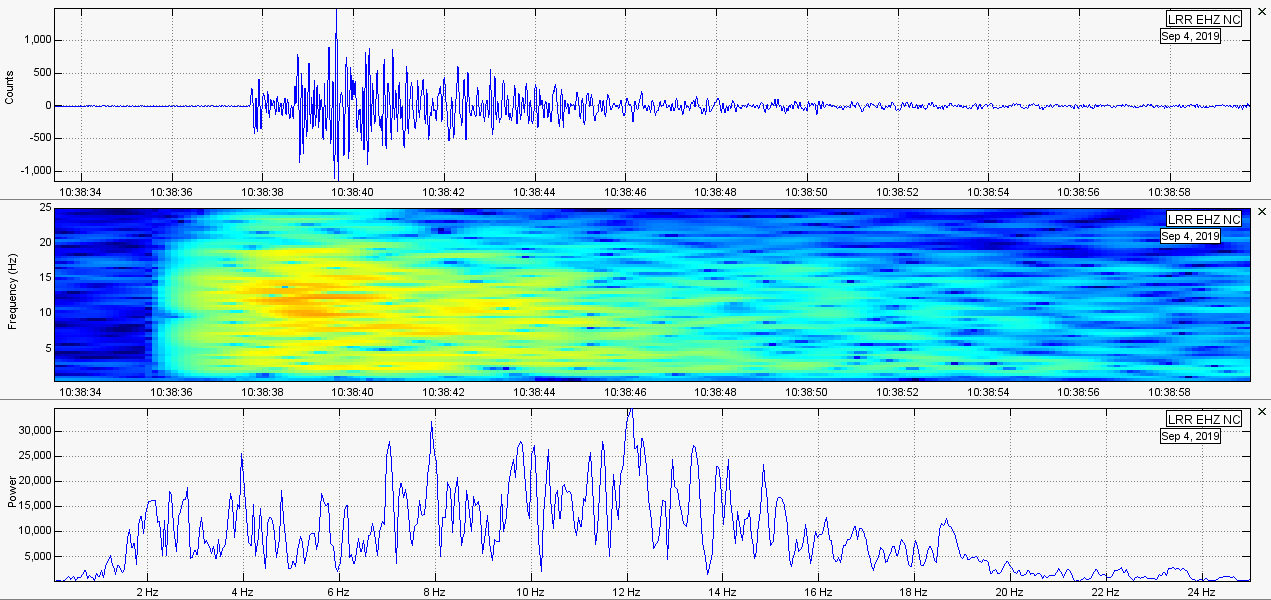
0 Comments
Leave a Reply. |
About
I used to create monthly volcano updates as videos for my YouTube channel and my website. However, that took far too much time and I have had to discontinue those updates. That being said, I will now do monthly volcano updates via this blog here. I will try to get them out as soon as possible. However, if I am very busy, they may be as much as 1-2 weeks late. Archives
February 2020
Categories |
 RSS Feed