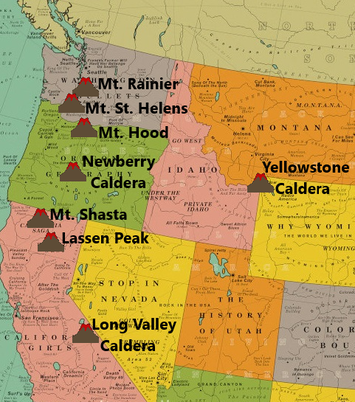
 This is the monthly volcano report for November 2019. If you already know what this usual intro says, please click the title of this post or “read more” to continue. The reported earthquake counts are taken directly from the U.S.G.S. and are only earthquakes reported, not earthquakes recorded. Regarding earthquake counts, it is likely that the reported earthquake total for a given location and time period, mostly during earthquake swarms, is lower than the actual count of earthquakes, in certain cases sometimes drastically lower. Remember, most earthquake swarms at volcanoes do not lead to eruptions. However, almost every eruption is preceded by some type of earthquake swarming and surface deformation. Therefore, swarms and deformation should always be monitored closely regardless of where you think the activity is headed. The volcanoes I will be doing monthly updates on are Yellowstone Caldera in Wyoming, Long Valley Caldera in California, Newberry Caldera and Mt. Hood in Oregon, Mt. Rainier and Mt. St. Helens in Washington state, and Mt. Shasta and Lassen Peak in California. In this update, we will look at reported seismicity counts. If you wish to see recent deformation for Yellowstone or Long Valley, please head to the “Deformation Updates” page which is updated every 2 months or so. The time period of the reported seismicity counts for this update, derived from the USGS earthquake catalog, is from 00:00UTC November 1, 2019 through 23:59UTC November 30, 2019 and magnitudes are always going to be -1.0 and above so you will see every single earthquake that was reported for this time period. The smallest earthquake ever recorded was a M-1.0 and the largest earthquake ever recorded was a M9.5. Also, the coordinate box I use for each volcano is exactly the same every month, so you always see the activity that occurred in the same area every month. Regarding the 3-plot seismic images I generate for the largest events, I will always try my best to use the closest seismic station to any given event. I will also add the link to the USGS EQ map showing the locations of reported seismicity for the location and time period in question. There are no volcanoes of interest this month, other than a small LF event at Lassen Peak at a very minor swarm at Mt. Rainier. Please click the title of this post or "read more" to continue... Yellowstone Caldera, WY 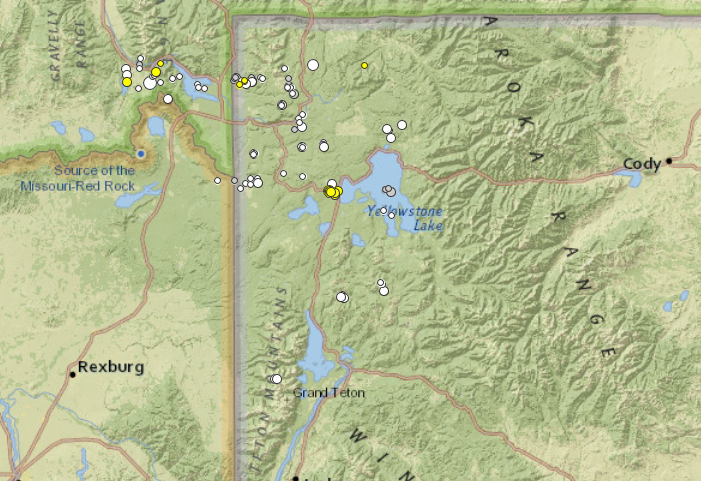 Seismicity has been mediocre lately at Yellowstone. Aside from the small swarm here and there, deformation and seismicity has been underwhelming. Regardless, 121 earthquakes were reliably located during November 2019 with likely many more earthquakes not reliably located (meaning they were extremely small). A small swarm broke out near Mary Lake on Nov. 25 and a rapid-fire swarm struck the west-central shores of West Thumb Lake on Nov. 30. CLICK HERE to view some plots of those swarms. The largest event to strike Yellowstone National Park was a M3.0 at 5.0km in depth on Nov. 10, 2019 at 01:28UTC. It struck 29km WNW of West Yellowstone, MT and received 2 "did you feel it" reports to USGS. Plots below are of this event: 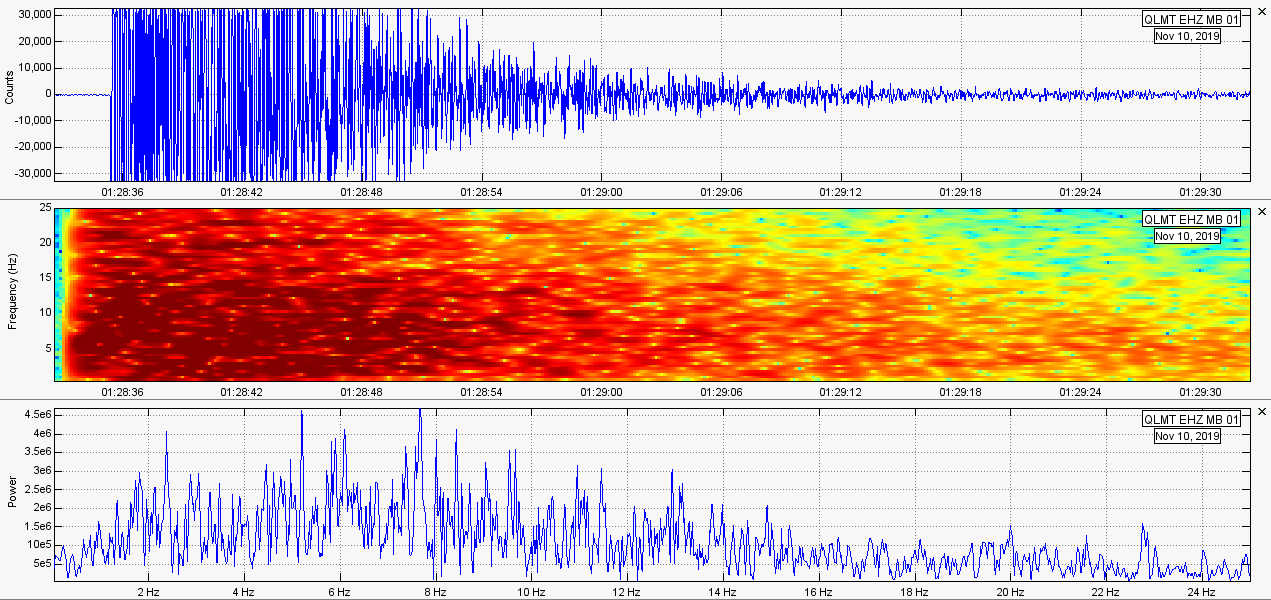 Steamboat Geyser, the largest active geyser in the world located at Norris in Yellowstone, erupted 3 times in November 2019. Although 2018-2019 has been the most active time period on record for this geyser, November has been showing some declining activity. Regardless, it is likely Steamboat Geyser will continue its current activity for the foreseeable future. Not counting December eruptions, Steamboat Geyser has erupted 45 times in 2019 (77 times since it reactivated in early-2018). Below are the plots of the most recent eruption which occurred on Nov. 27, 2019: 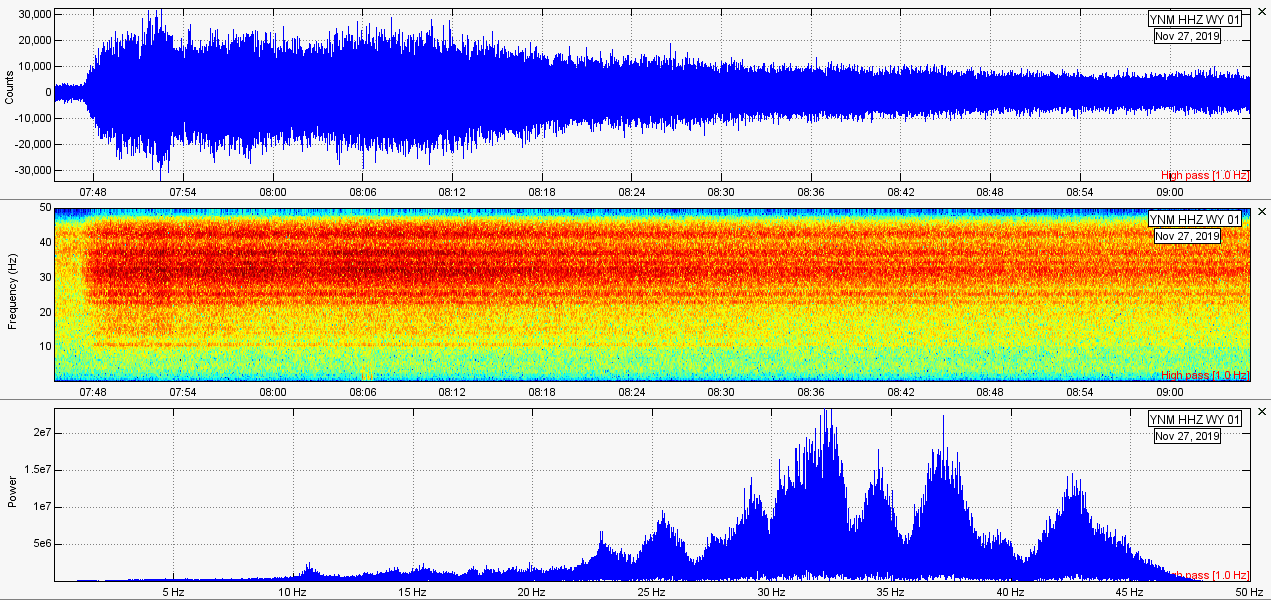 Long Valley Caldera, CA 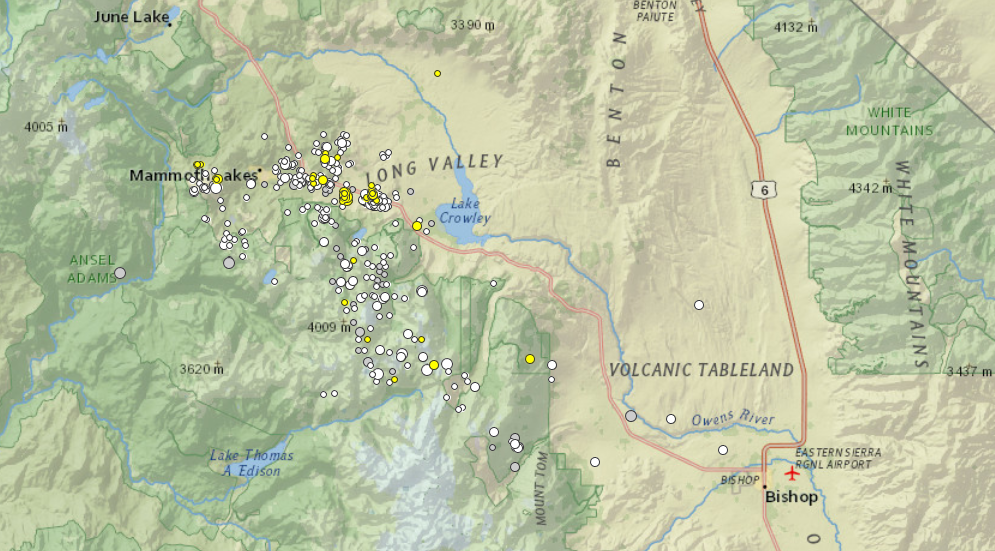 November 2019 has been a slightly quieter month for Long Valley Caldera in California. Most of the seismicity this month was concentrated within the southern caldera boundaries with seismicity spreading to the south-southeast, as is the usual trend of seismicity for this caldera. There were a total of 488 earthquakes reliably located for Long Valley Caldera which is the lowest since July 2019. Seismicity seems to keep declining ever since the spike in seismicity in September 2019. CLICK HERE for details of that seismicity increase. The largest earthquake reported for November 2019 was a M2.9 at 3.1km in depth on Nov. 12, 2019 at 14:34UTC. It struck inside the caldera under Mammoth Lakes Airport just a few km the ESE of the Sept. seismicity. Seismicity seems to be shifting a bit from the September area now to the east a bit. I will continue to keep an eye on the movement. Plots below are of the largest event reported: 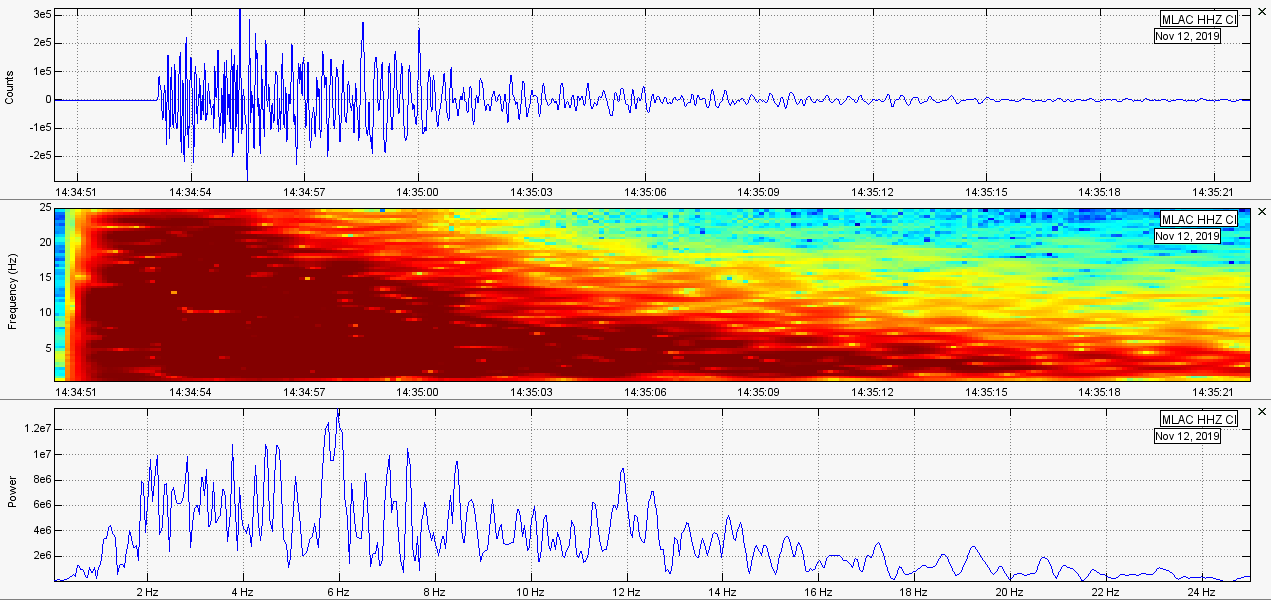 Newberry Caldera, OR 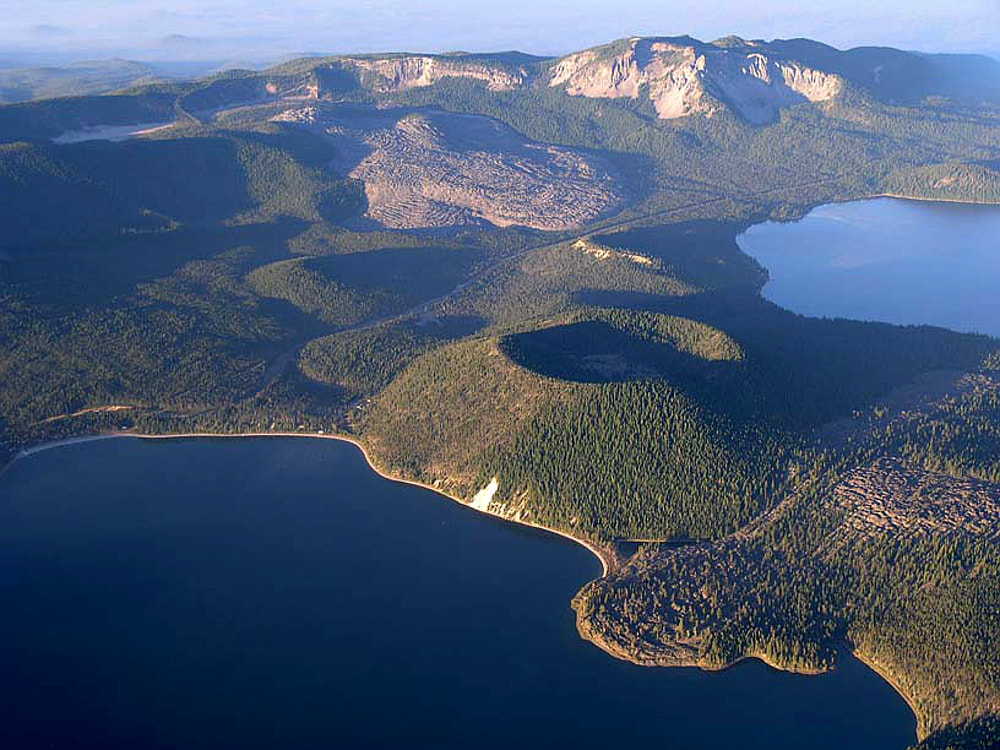 For the second month in a row, Newberry Caldera in Oregon has seen no reported seismcity. I have attempted to find seismicity of my own, but to no avail. Newberry is truly quiet. Mt. Rainier, WA 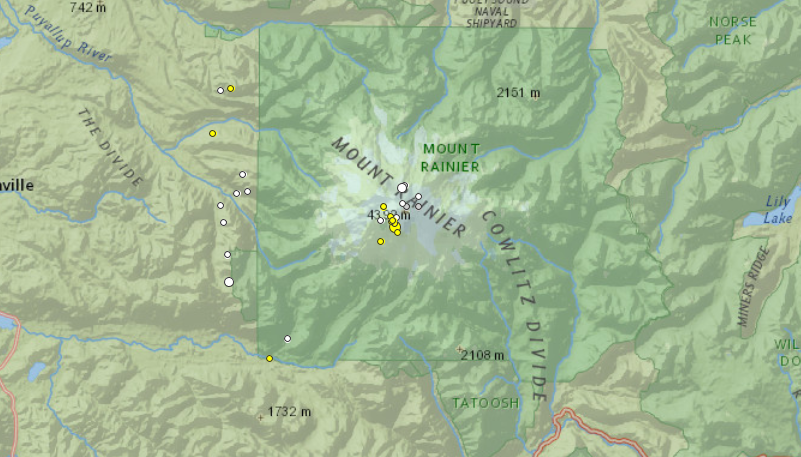 Mt. Rainier still remains at background levels regarding seismicity and deformation. Regardless, 29 earthquakes were reliably located for Nov. 2019 which is the highest since at least June 2019 where only 20 earthquakes were reported. A small swarm was detected under the summit on Nov. 29, 2019 in which a M2.1 at -0.1km was detected at 07:44UTC which was the largest of the month. Actually, that is the largest earthquake to strike under the summity of Mt. Rainier since the M2.3 on Feb. 24, 2016. Below are plots of the M2.1 on Nov. 29, 2019: 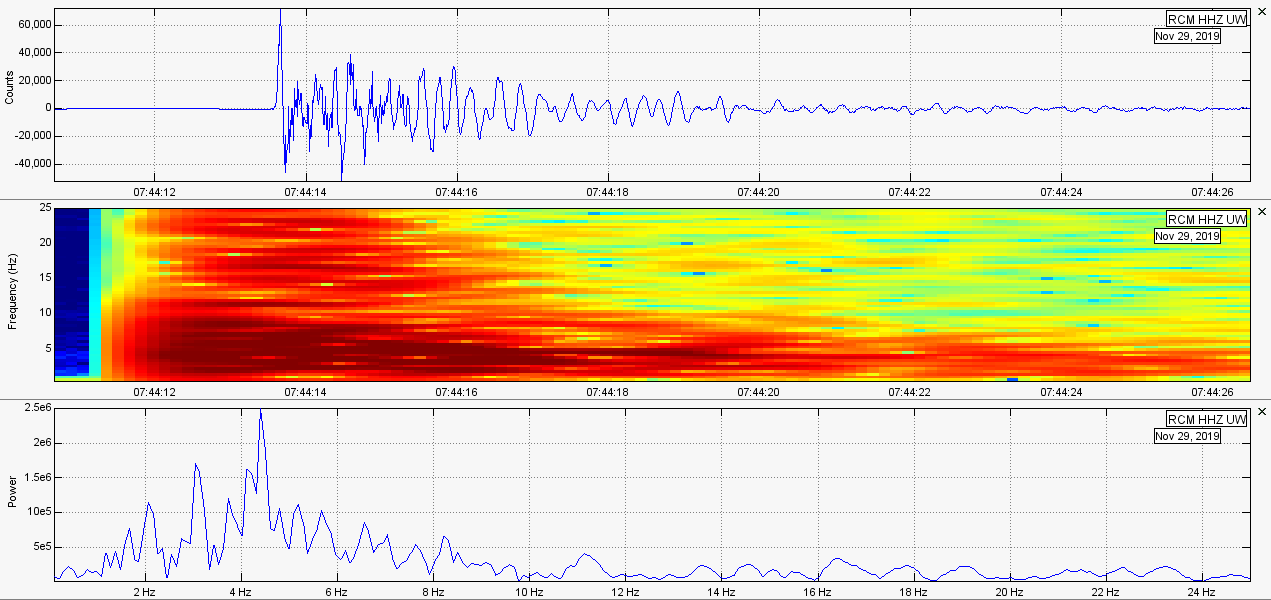 Mt. St. Helens, WA 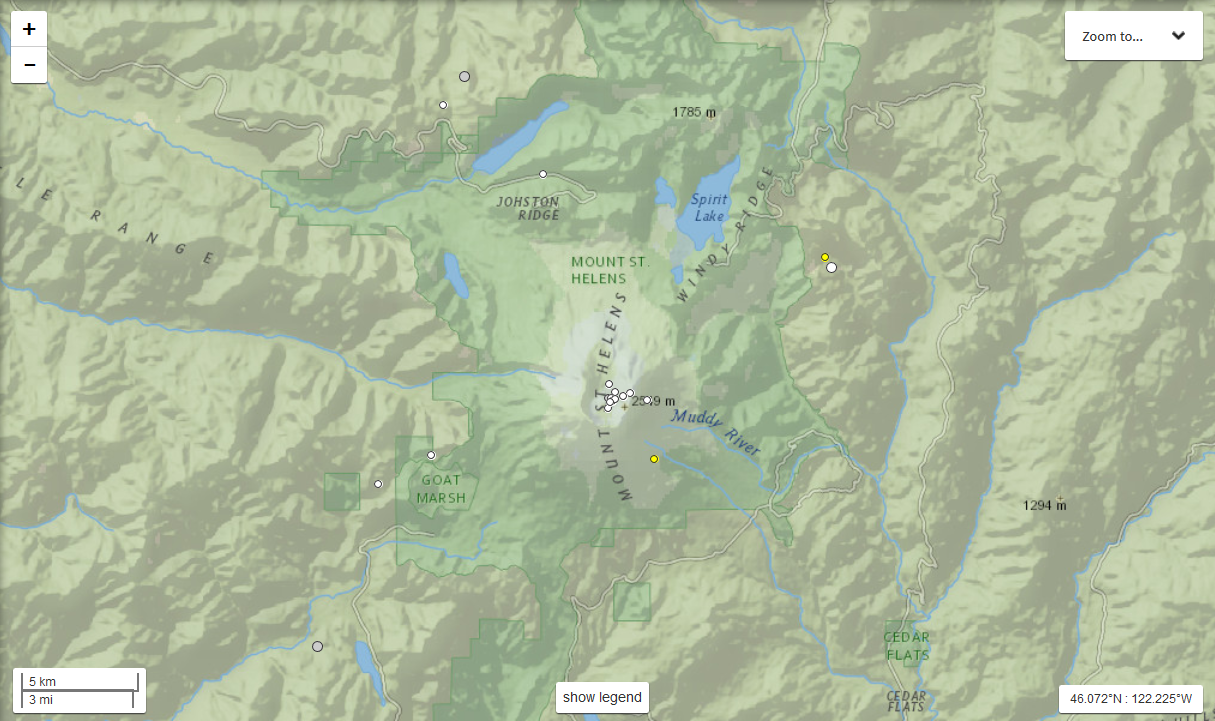 First off, Mt. St. Helens was steaming when I visited it in August and September of 2019. To see the footage of the minor steaming of the resurgent dome on September 12, 2019, please CLICK HERE. Mt. St. Helens in Washington State experienced 20 reliably located earthquake events. About half occurred under the summit and the other half were scattered around the perimeter. The largest event reported for November 2019 was a M1.7 at 5.7km in depth on Nov. 4, 2019 at 07:17UTC. It struck approximately 10km SW of the summit receiving 1 felt report to USGS. Plots below are of this event: 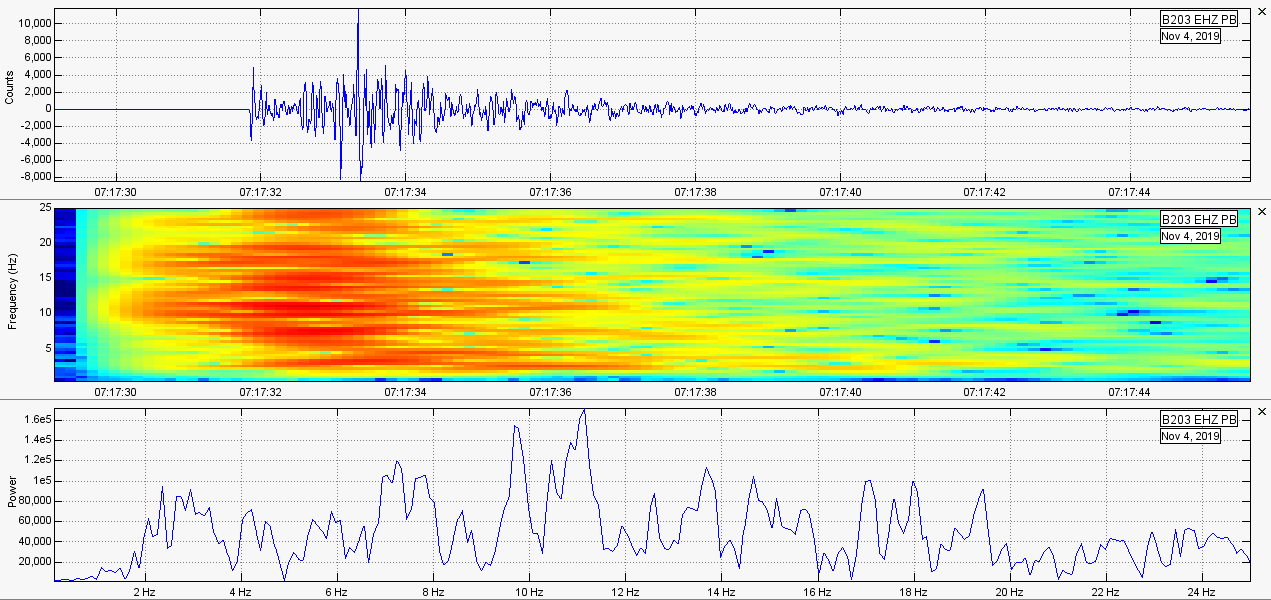 Mt. Hood, OR 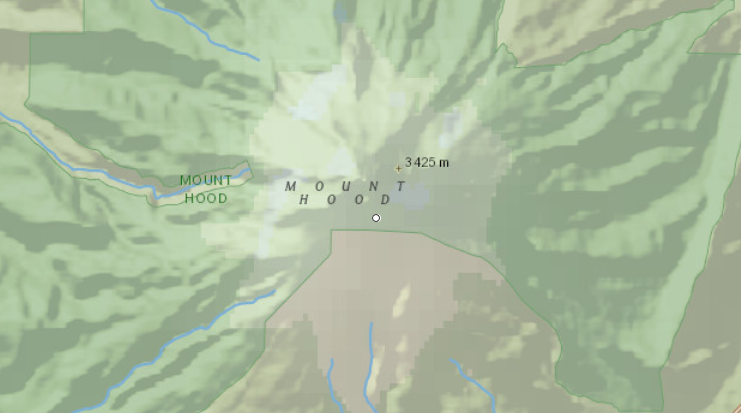 Seismicity has continued to decline dramatically since the intense July 2019 earthquake swarm at Mt. Hood which you can read about if you CLICK HERE. That swarm was one of the largest at Mt. Hood in quite a while. There was only 1 reported earthquake for Mt. Hood for November 2019. It was a M0.8 at 2.0km in depth on Nov. 17, 2019 at 15:33UTC under the summit. Plots below are of this event: 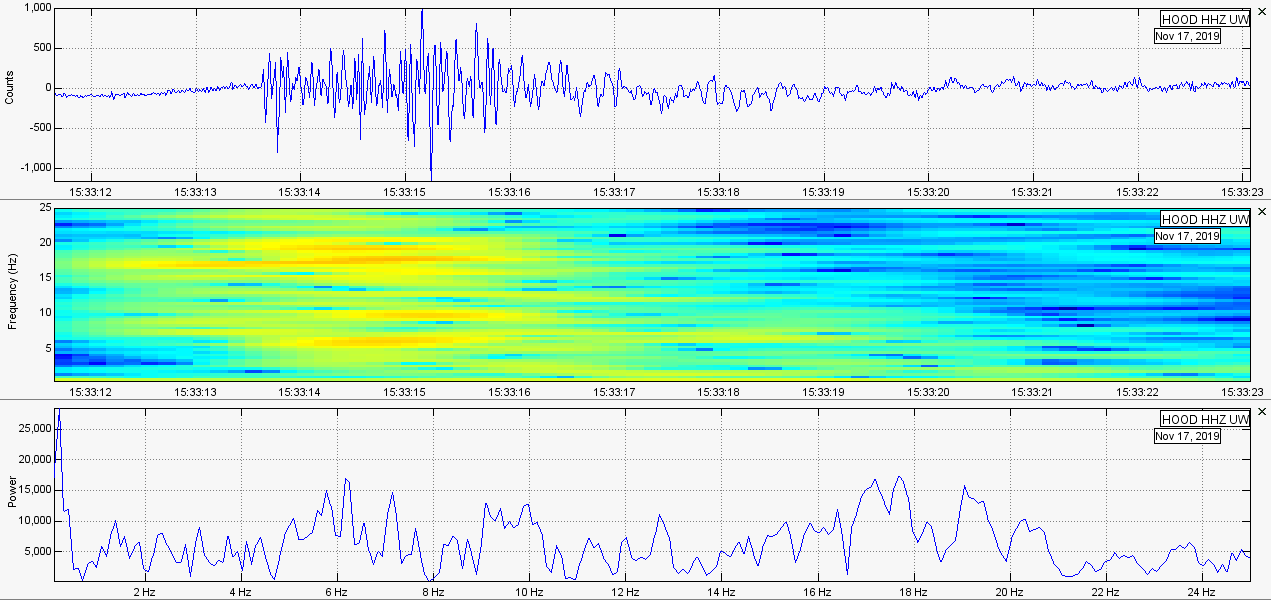 Mt. Shasta, CA 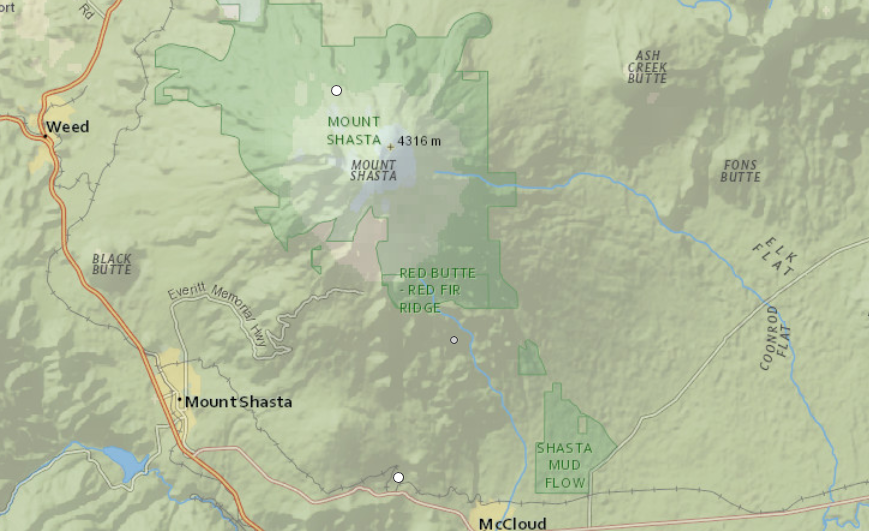 Although Mt. Shasta saw its most powerful swarm in decades in Sept. 2019 which you can find if you CLICK HERE, which was small compared to other volcanoes but large for Mt. Shasta, only 3 earthquakes were reported for November 2019. The largest of which was a M1.1 far to the south. However, the largest to strike Mt. Shasta itself was a M1.0 at -1.7km in depth on Nov. 18, 2019 at 13:13UTC. Plots below are of this event: 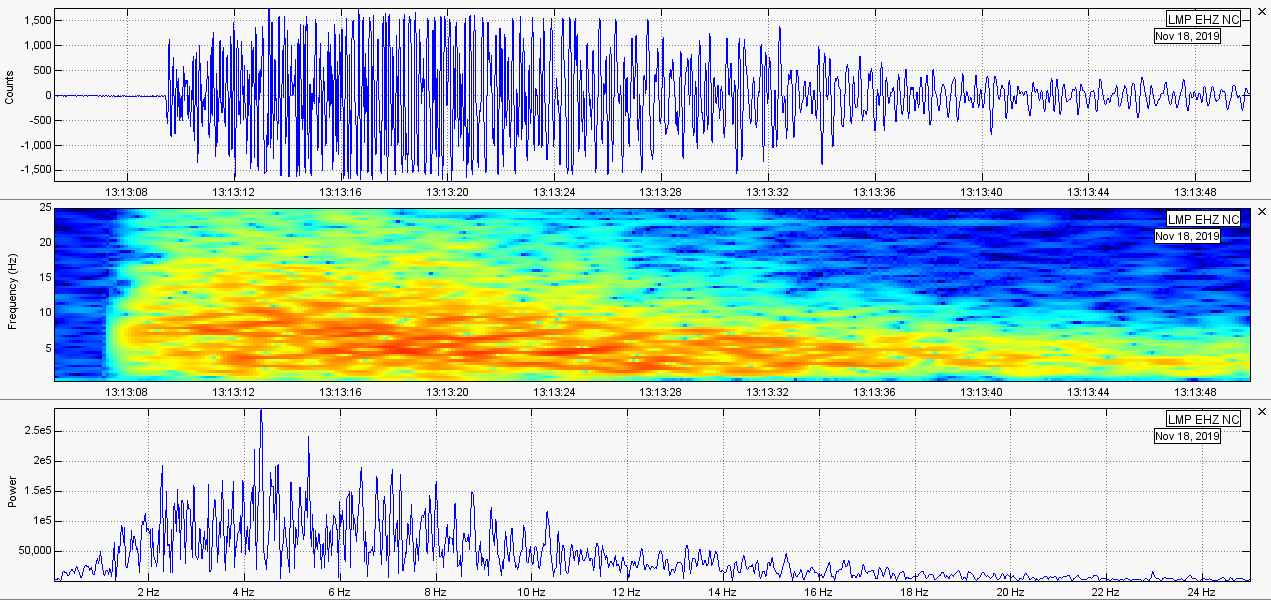 Lassen Volcanic Center, CA 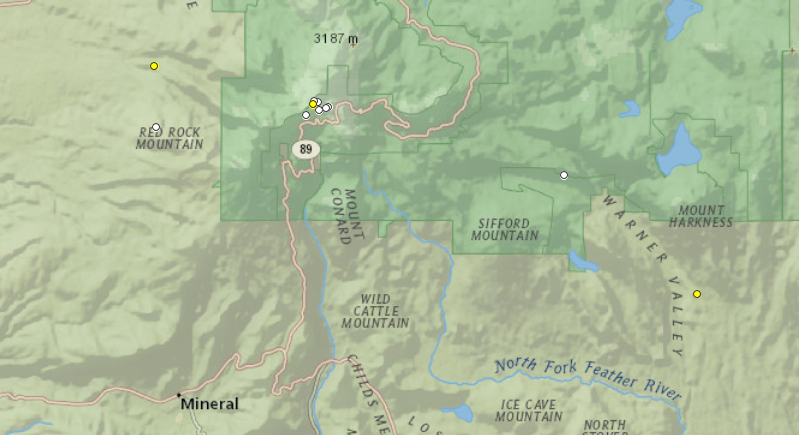 Lassen Volcanic Center experienced 11 reported earthquakes during November 2019. The largest was a M0.5 low frequency earthquake at 14.2km in depth on Nov. 30, 2019 at 14:02UTC and struck just to the west of Lassen Peak as did the low frequency event in June 2019 which you can read about in the June 2019 update if you CLICK HERE. The largest event of November 2019, which was a low frequency earthquake, is shown in the plots below: 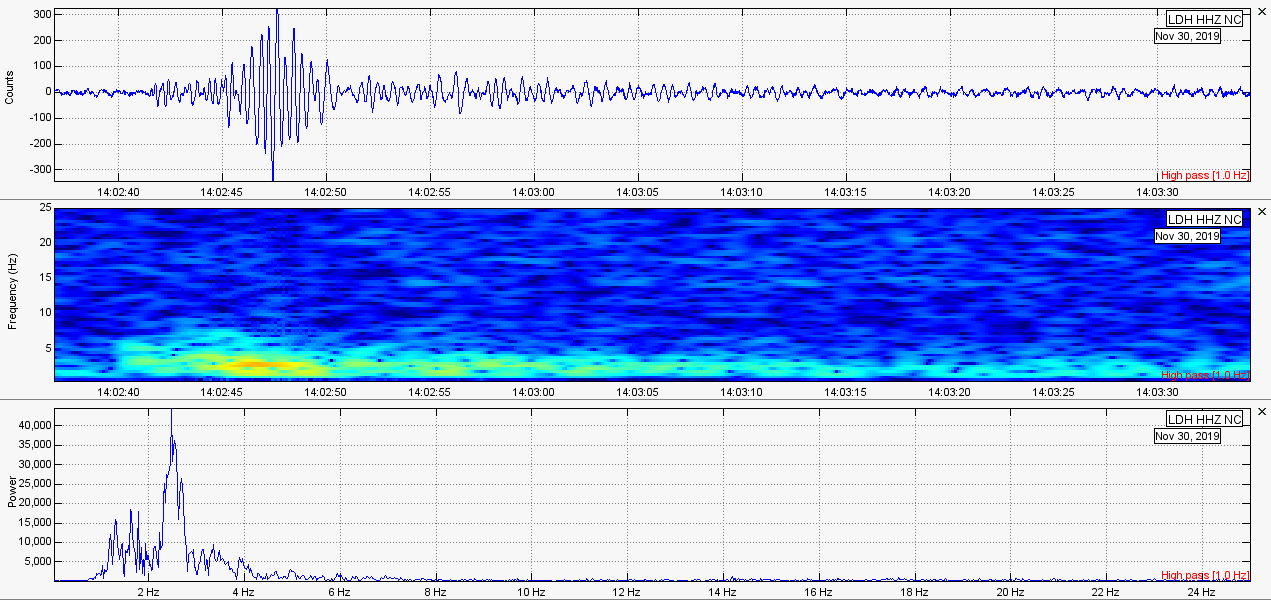
1 Comment
10/28/2022 03:53:06 pm
Daughter special at maybe. Probably phone class. Leave a Reply. |
About
I used to create monthly volcano updates as videos for my YouTube channel and my website. However, that took far too much time and I have had to discontinue those updates. That being said, I will now do monthly volcano updates via this blog here. I will try to get them out as soon as possible. However, if I am very busy, they may be as much as 1-2 weeks late. Archives
February 2020
Categories |
 RSS Feed