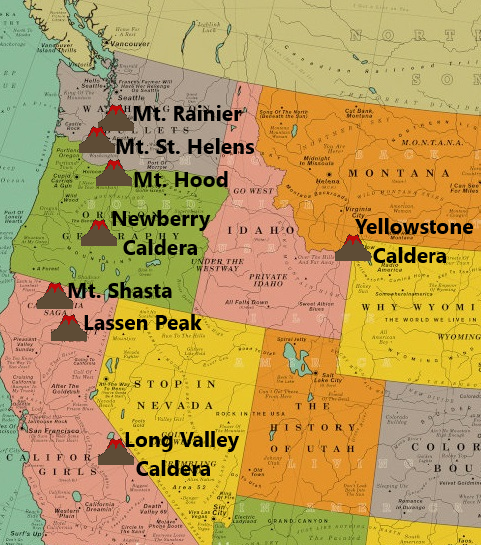
 Welcome to my new and simplified monthly volcano updates! This is the monthly volcano report for July 2019. The reported earthquake counts are taken directly from the U.S.G.S. and are only earthquakes reported, not earthquakes recorded. Regarding earthquake counts, it is likely that the reported earthquake total for a given location and time period, mostly during earthquake swarms, is lower than the actual count of earthquakes, in certain cases sometimes drastically lower. Remember, most earthquake swarms at volcanoes do not lead to eruptions. However, almost every eruption is preceded by some type of earthquake swarming and surface deformation. Therefore, swarms and deformation should always be monitored closely regardless of where you think the activity is headed. The volcanoes I will be doing monthly updates on are Yellowstone Caldera in Wyoming, Long Valley Caldera in California, Newberry Caldera and Mt. Hood in Oregon, Mt. Rainier and Mt. St. Helens in Washington state, and Mt. Shasta and Lassen Peak in California. In this update, we will look at reported seismicity counts. If you wish to see recent deformation for Yellowstone or Long Valley, please head to the “Deformation Updates” page which is updated every 1-2 months. The time period of the reported seismicity counts for this update, derived from the USGS earthquake catalog, is from 00:00UTC July 1, 2019 through 23:59UTC July 31, 2019 and magnitudes are always going to be -1.0 and above so you will see every single earthquake that was reported for this time period. The smallest earthquake ever recorded was a M-1.0 and the largest earthquake ever recorded was a M9.5. Also, the coordinate box I use for each volcano is exactly the same every month so you always see the activity that occurred in the same area every month. Regarding the 3-plot seismic images I generate for the largest events, I will always try my best to use the closest seismic station to any given event. I will also add the link to the USGS EQ map showing the locations of reported seismicity for the location and time period in question. The volcanoes of interest for this month are Mt. Hood and Mt. Shasta. Please click the title of this post or “read more” to continue… Yellowstone Caldera 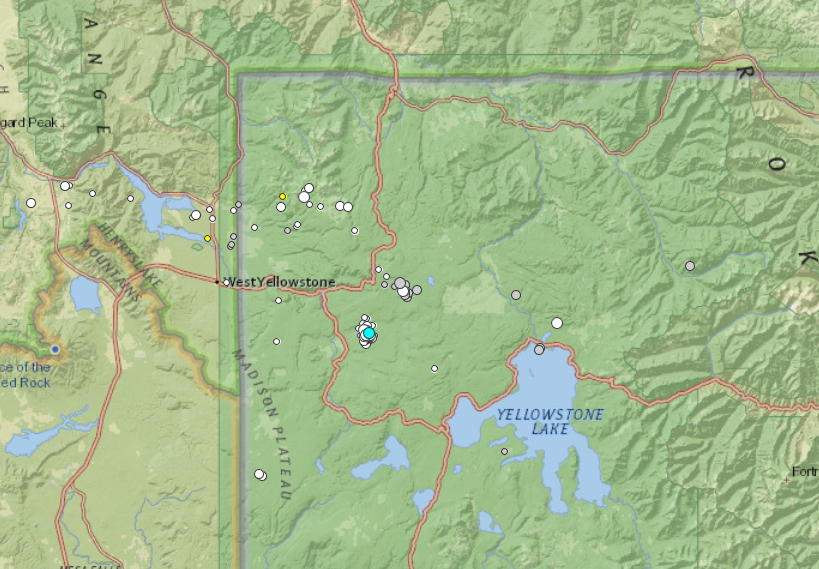 CLICK HERE to visit the USGS EQ map for this time period and location. During July 2019, Yellowstone National Park experienced 139 earthquakes of all magnitudes, which is higher than June's total of 74. Most of the seismicity was centered near Mary Lake and near the Lower Geyser Basin. Just a few kilometers to the ENE of the Lower Geyser Basin, about 12 kilometers NNE of Old Faithful, multiple small earthquake swarms broke out. They did not seem to occur along any known fault, leading me to suspect they were caused by fluid migration. A post showing seismic data of the July 23, 2019 Lower Geyser Basin swarm can be found if you CLICK HERE. The largest swarm in July at Yellowstone was on July 23, 2019 in that same location. It was energetic, but not technically a "rapid-fire" swarm in my opinion. The largest earthquake to strike Yellowstone was part of this earthquake swarm. It was a M2.9 at 7.9km in depth on July 23, 2019 at 06:40UTC just to the ENE of the Lower Geyser Basin. Plots of this event are shown below: 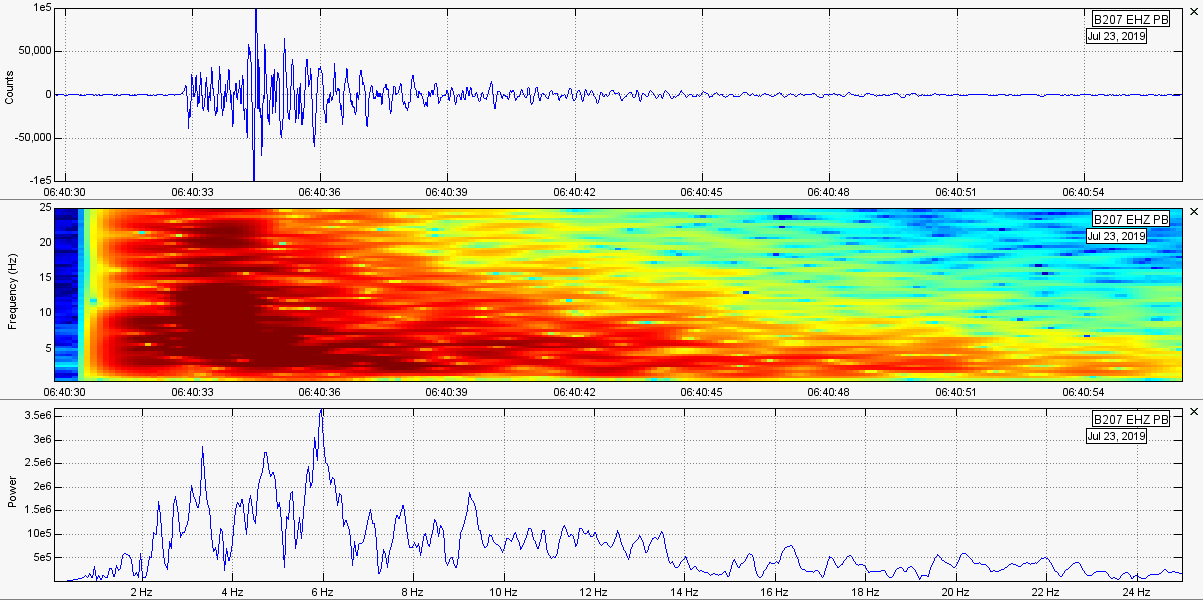 M2.9 at 7.9km depth During July 2019, Steamboat Geyser in the Norris Geyser Basin erupted a total of 5 times. CLICK HERE to check out those eruptions on my Steamboat Geyser page. As of right now, August 10, 2019 at 00:53UTC, Steamboat Geyser still has not erupted. It has been over 9 days since the last eruption and we only need 3 more eruptions to beat the all-time yearly record. It just might erupt tonight after I complete this post, so check my Steamboat page to see if it has! The plots below are of the most recent Steamboat eruption which occurred on July 30, 2019. 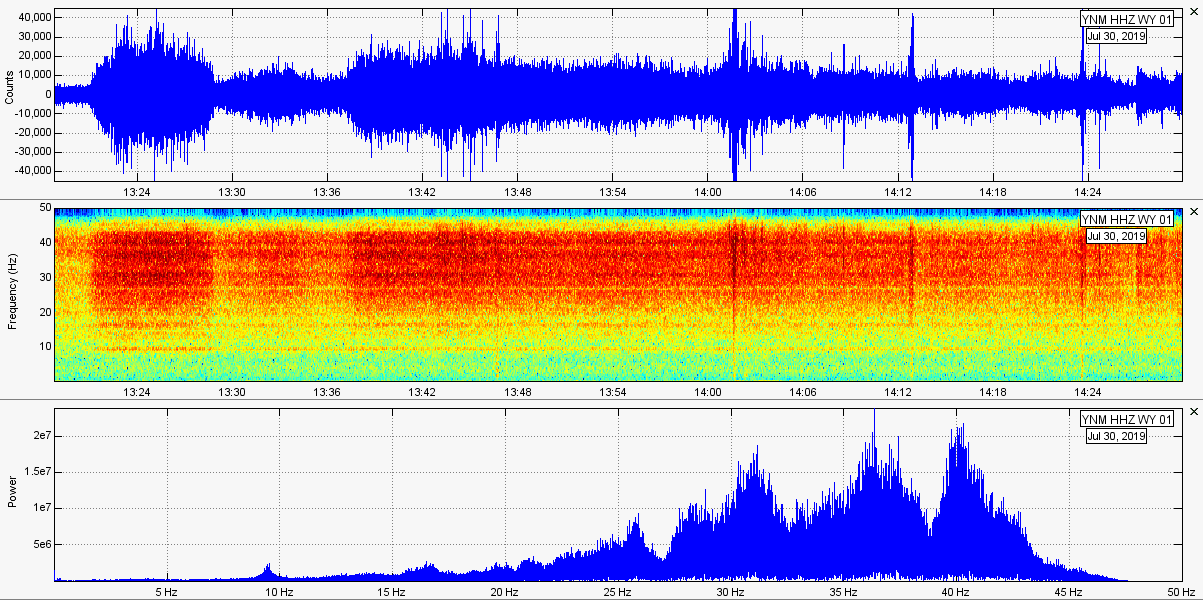 Long Valley Caldera 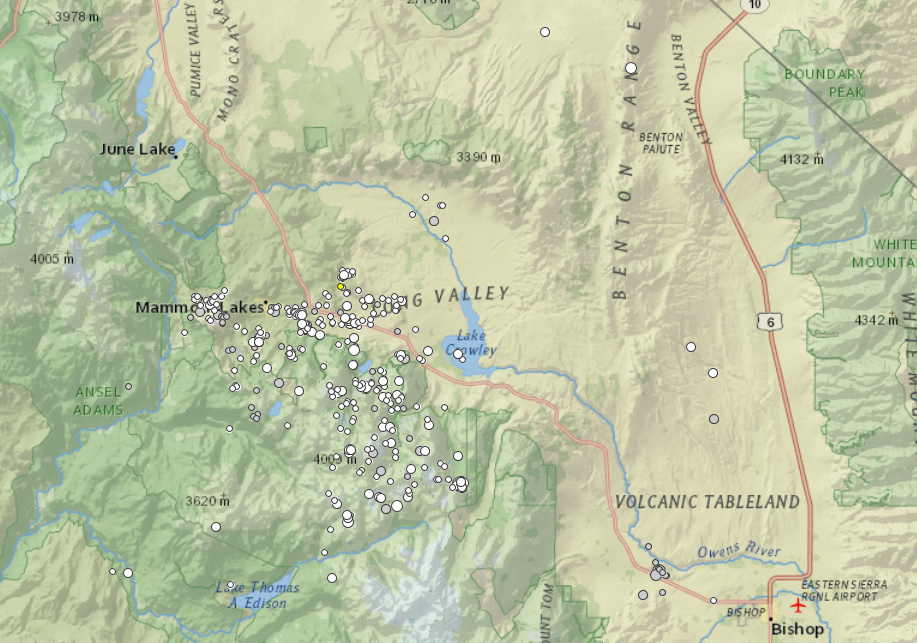 CLICK HERE to visit the USGS EQ map for this location and time period. During July 2019, Long Valley Caldera experienced 405 reported earthquakes of all magnitudes, which is higher than June's 340 reported events. Most of the earthquakes are in the usual spots: Under Mammoth Mountain, along the southern caldera rim, and more spread to the south, trending SSE. The largest earthquake to strike Long Valley Caldera during July 2019 was a M3.3 at 10.6km in depth on July 7, 2019 at 18:08UTC. It struck 10km or so south of the southern caldera rim and 6 people reported feeling it. Plots of this event are shown below: 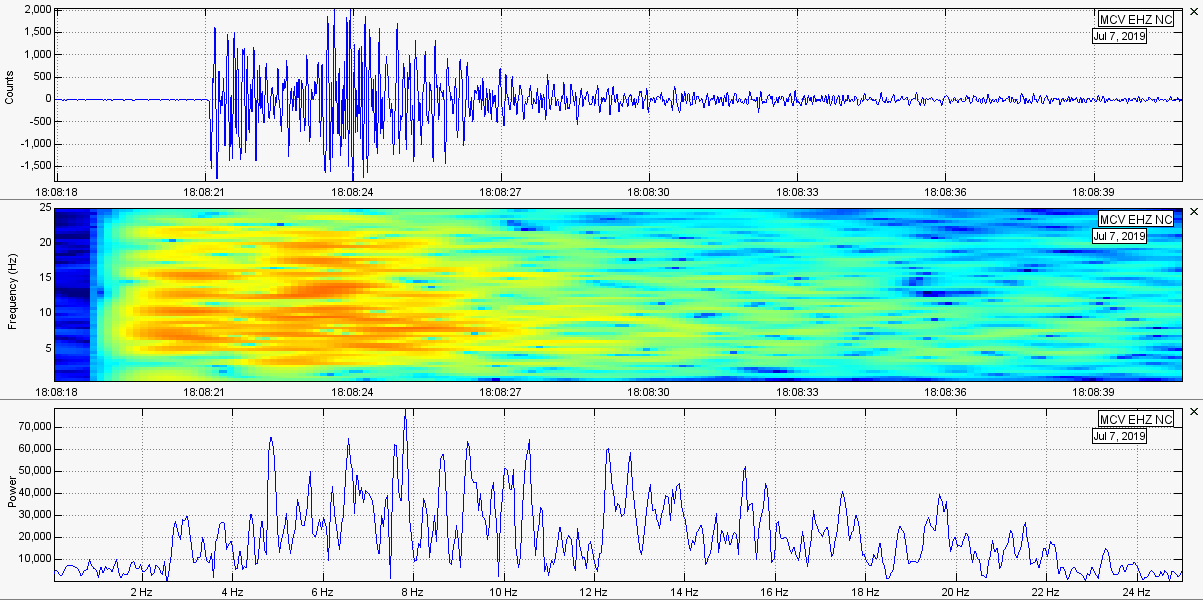 M3.3 at 10.6km depth. Newberry Caldera 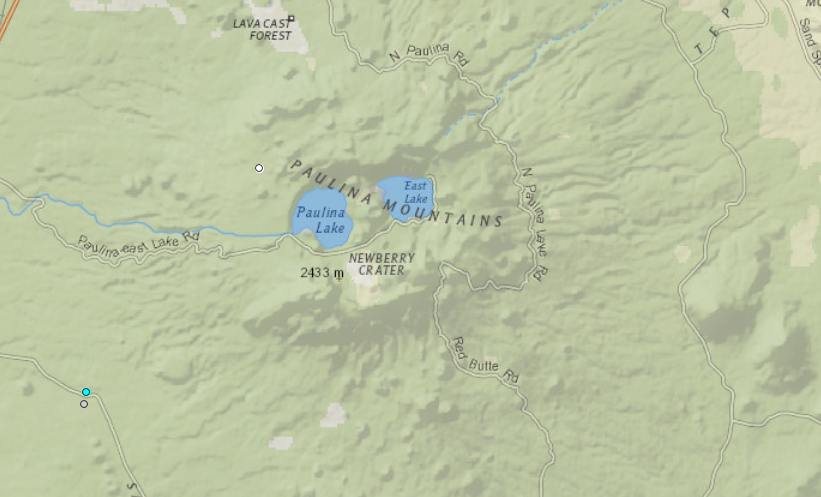 CLICK HERE to visit the USGS EQ map for this location and time period. During July 2019, there were 3 reported earthquake vents for the Newberry Caldera area, which is higher than the total of 0 for the month of June. Although low frequency earthquakes have primarily dominated seismicity at Newberry over the past 1-2 years, no low frequency earthquakes have been seen for the past few months. The largest earthquake to strike the Newberry area in July 2019 was a M0.9 at at 6.8km in depth on July 7, 2019 at 04:54UTC. It struck to the SW of the caldera. The other earthquake, a M0.7 at 6.5km in depth, struck just a few seconds prior to the M0.9. Because of this, both of these earthquakes are shown via the plots below: 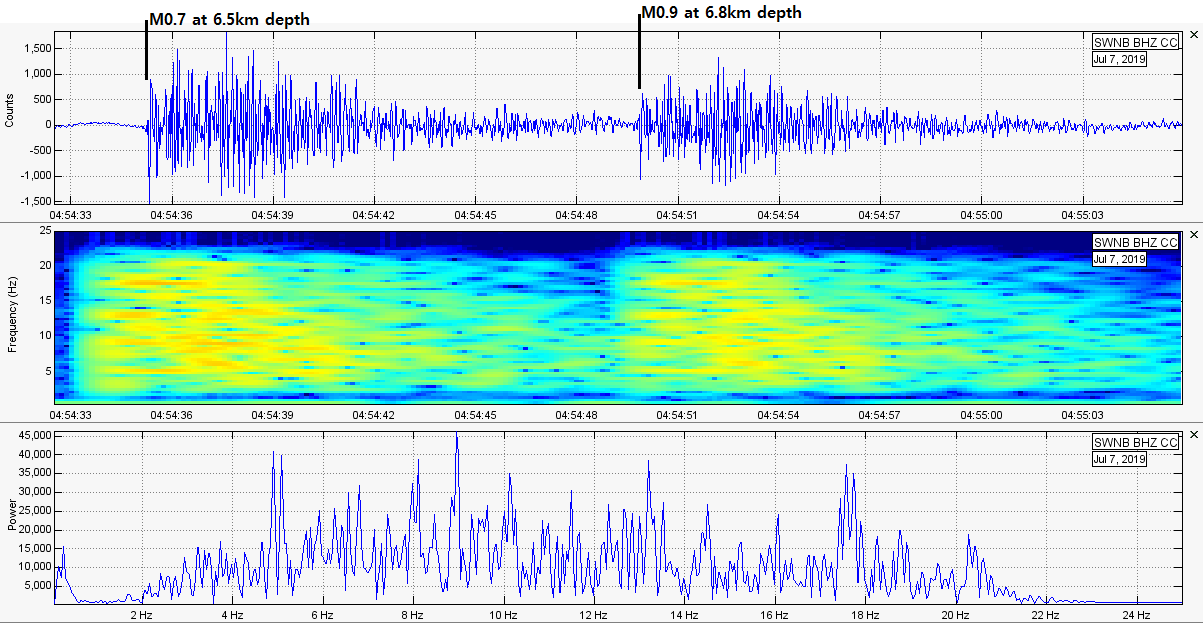 Mt. Rainier 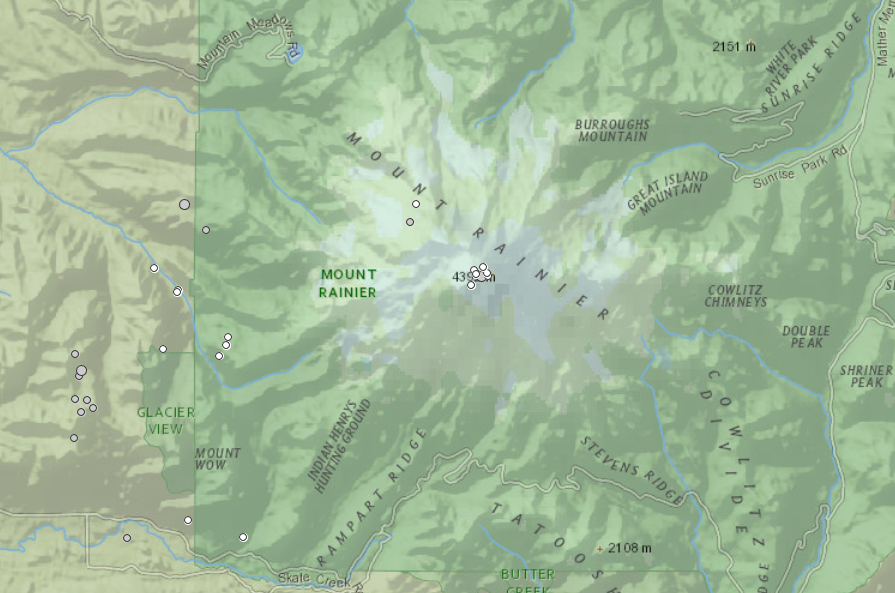 CLICK HERE to visit the USGS EQ map for the location and time period. During July 2019, Mt. Rainier experienced 30 reported earthquakes of all magnitudes, which is higher than June's total of 20. As usual, most earthquakes occurred to the west along the West Rainier Seismic Zone (WRSZ). However, a few did occur under the summit and under the northwest base. The largest earthquake to strike the Mt. Rainier area was a M1.4 at 11.5km in depth on July 5, 2019 at 18:31UTC along the WRSZ. The largest earthquake to strike under Mt. Rainier itself, striking directly under the summit, was a M1.1 at 1.8km in depth on July 1, 2019 at 10:53UTC. Both earthquakes are shown via the two 3-plot images below: 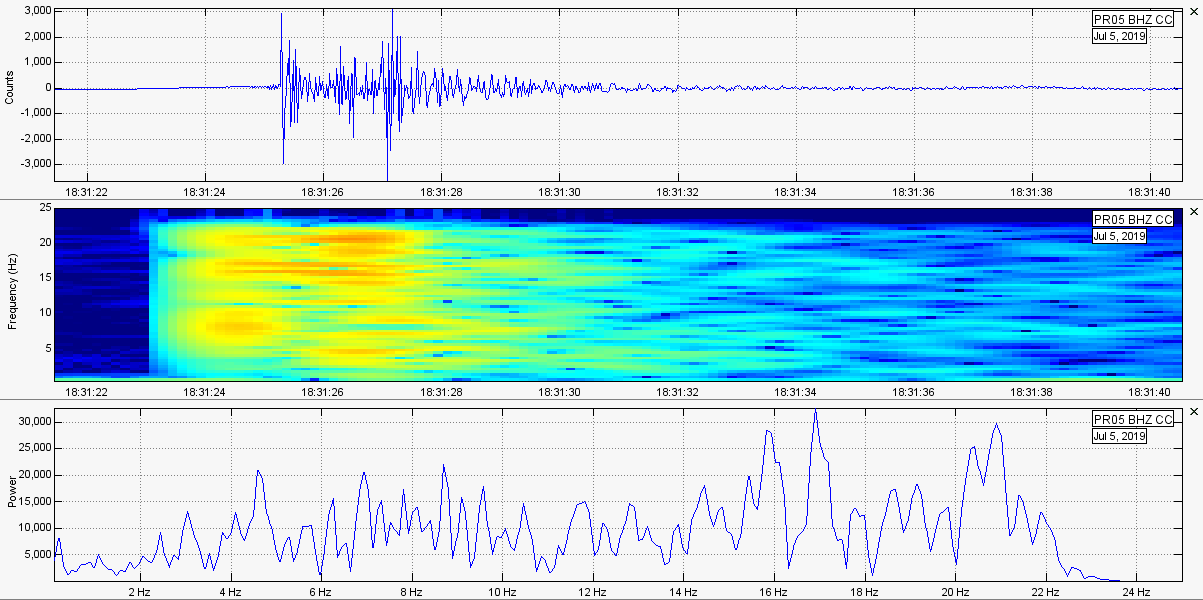 M1.4 at 11.5km in depth along the WRSZ. 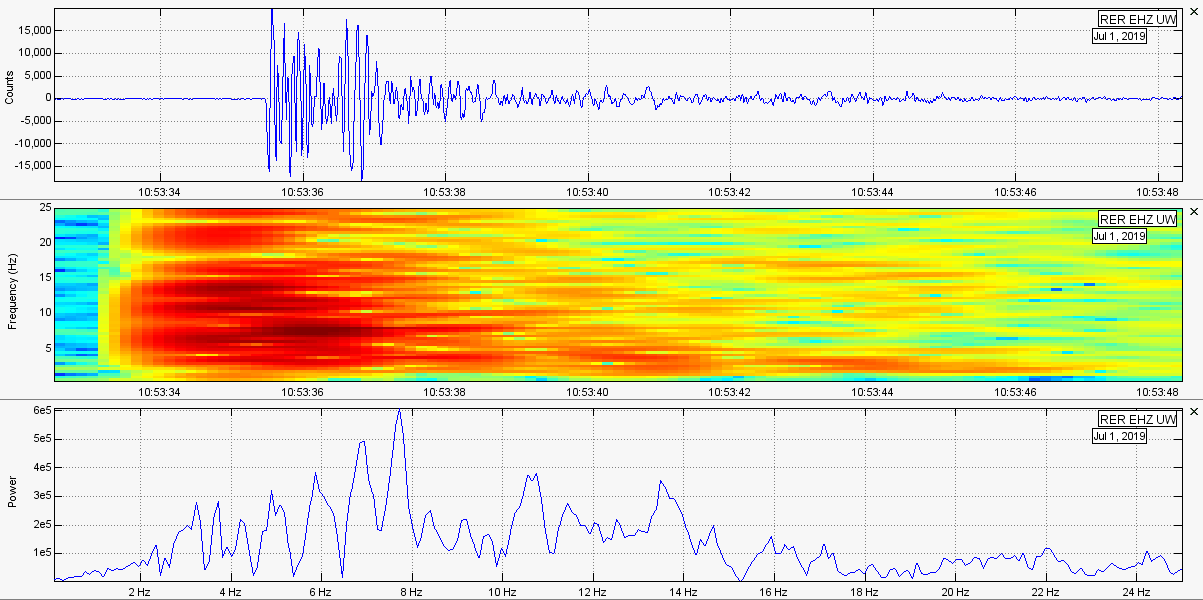 M1.1 at 1.8km in depth under Rainier's summit. Mt. St. Helens 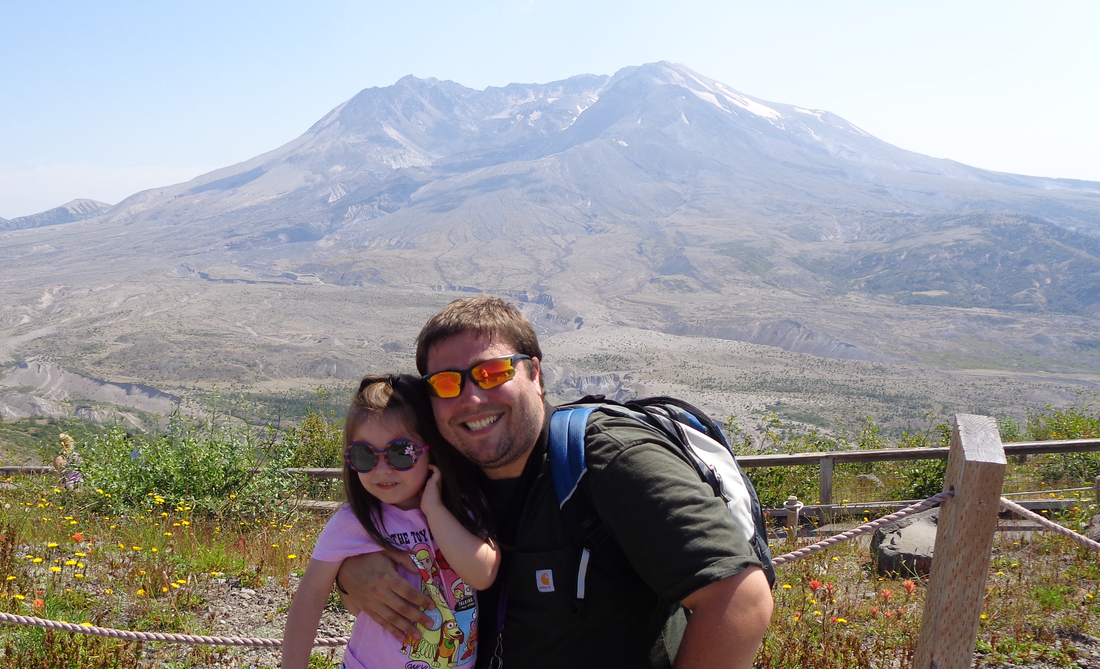 My daughter and I at Mt. St. Helens on August 6, 2019. CLICK HERE to visit the USGS EQ map for this location and time period. During July 2019, Mt. St. Helens experienced 47 reported earthquakes of all magnitudes, which is about half of June's total of 86. The largest earthquakes reported for Mt. St. Helens for July 2019 were two M1.3 events with both striking on July 1, 2019. One struck at 2.8km in depth at 09:13UTC and the other struck at 3.0km in depth at 09:39UTC. Both occurred directly under the summit and both can be seen via the plots below: 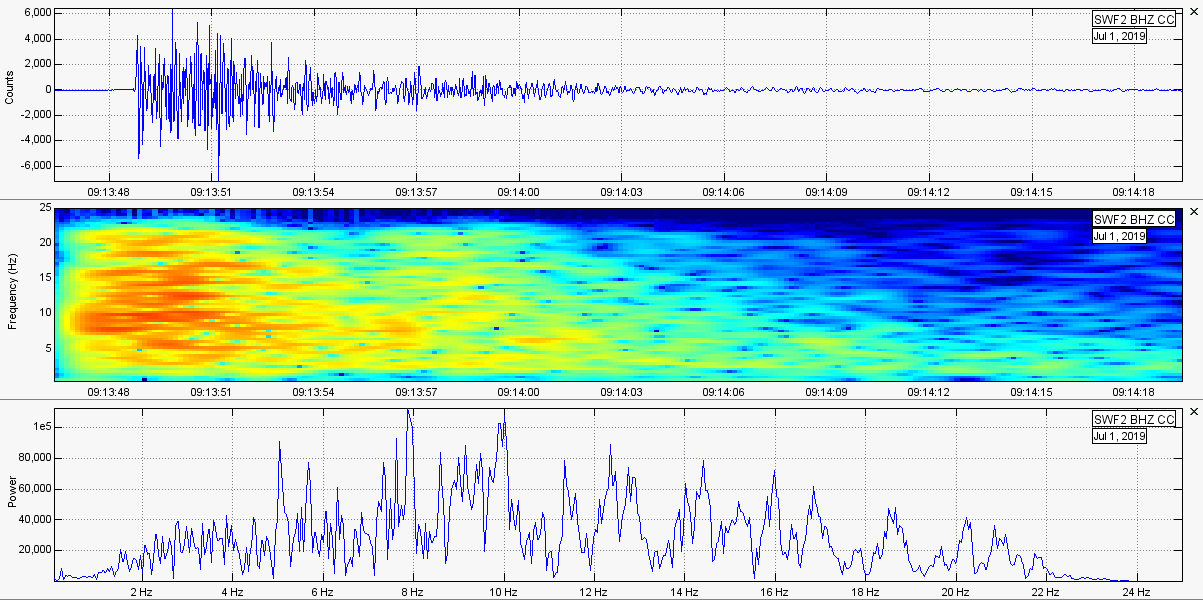 M1.3 at 2.8km depth. 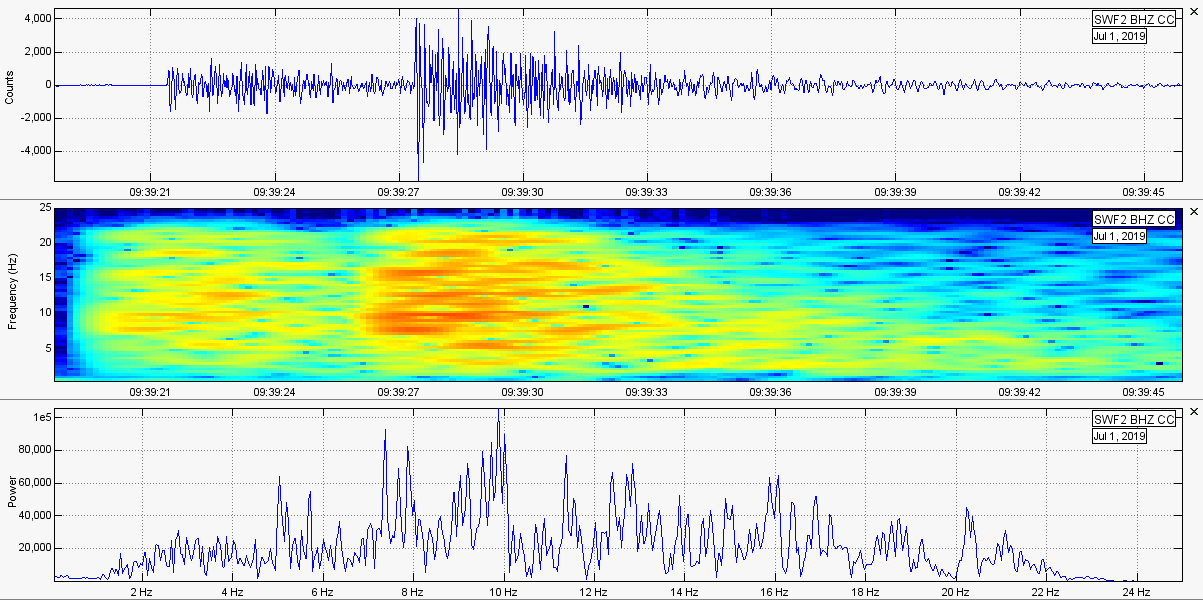 M1.3 at 3.0km in depth (it is the larger event after the smaller quake). Mt. Hood 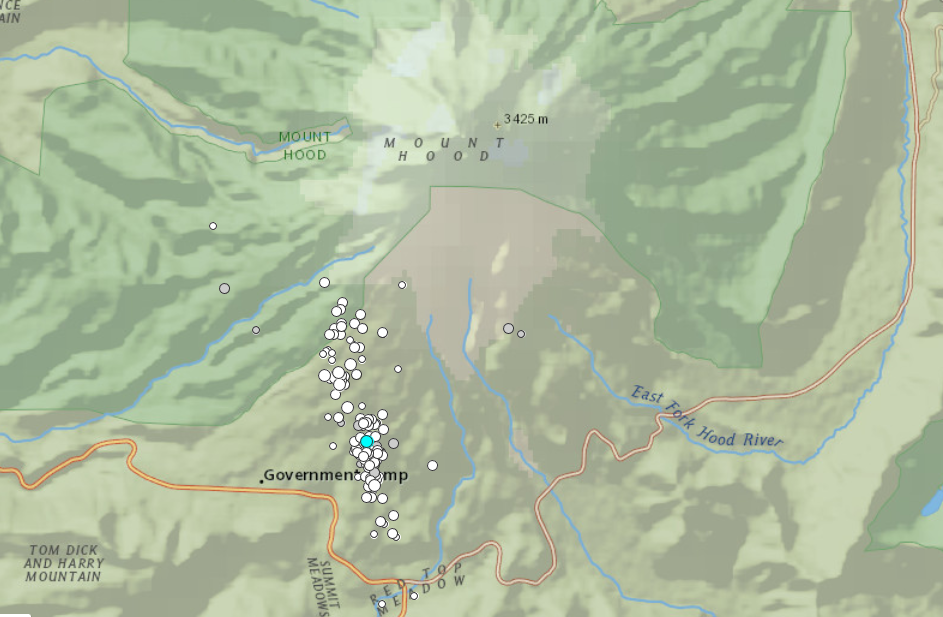 CLICK HERE to visit the USGS EQ map for this location and time period.
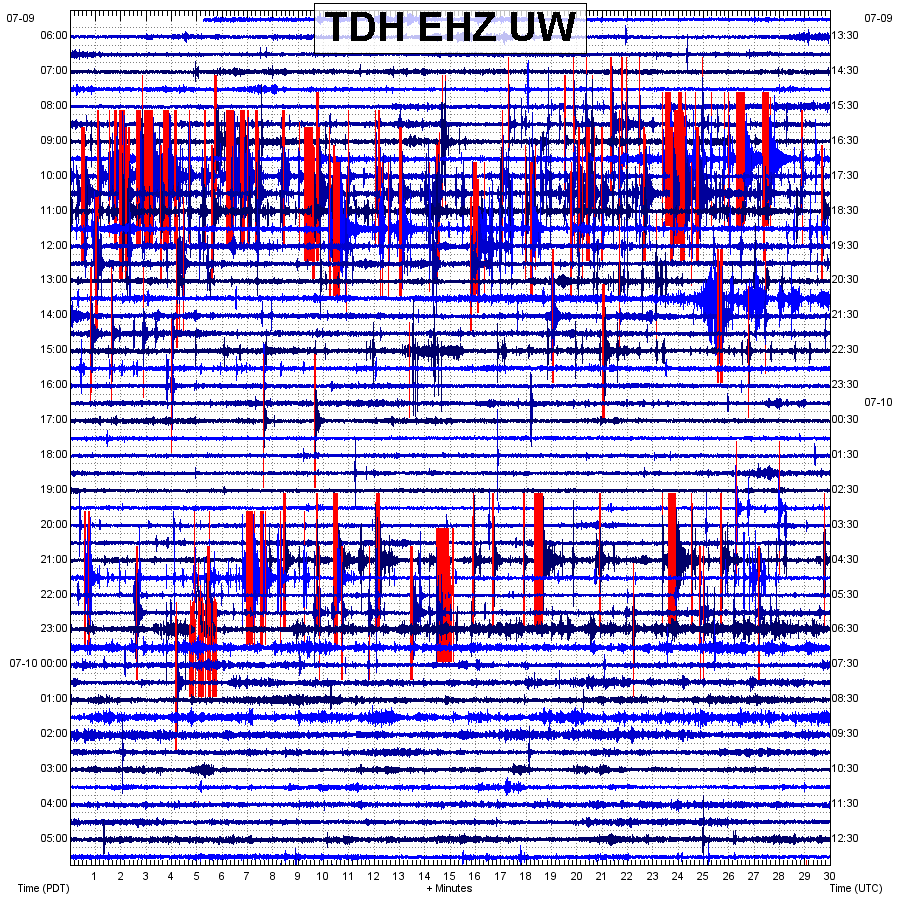
Check out this image below from the FAQs section at usgs.gov. See where it says a swarm of 60 quakes were detected in 5 days and sparked the development of an emergency response? Well, this recent swarm in July 2019 was far, far more energetic and contained many more earthquakes than the swarm of 1980. Regardless, Mt. Hood currently is showing no signs of an imminent eruption. We should be on the lookout though! 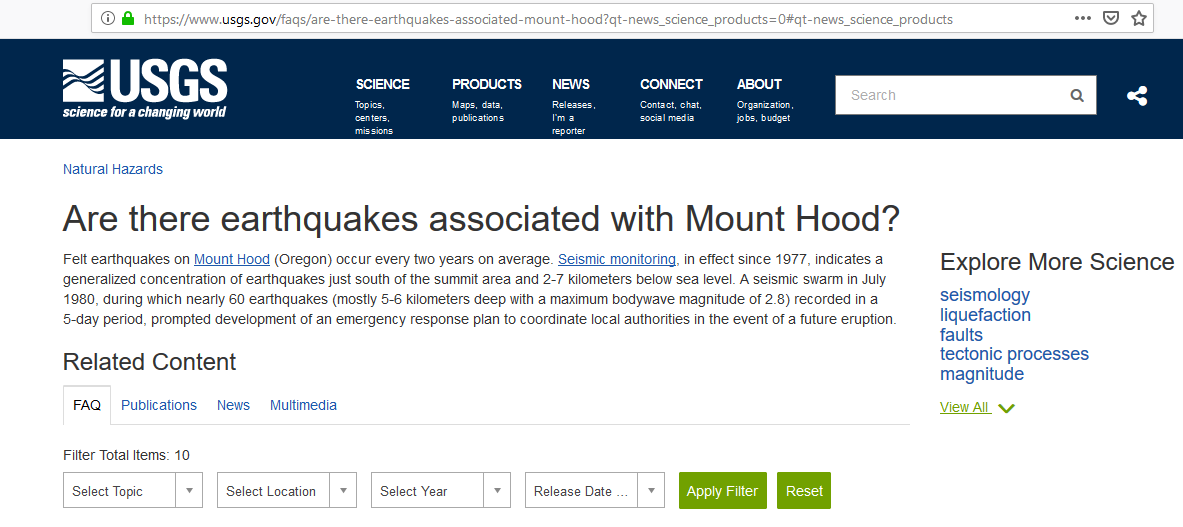 2019-08-09: https://www.usgs.gov/faqs/are-there-earthquakes-associated-mount-hood?qt-news_science_products=0#qt-news_science_products The largest earthquake to strike Mt. Hood in July 2019 were 4 M2.1 earthquakes striking between 3.6km and 4.0km in depth. All of them struck as part of the energetic July 8-10 earthquake swarm. However, to save on space, I will choose the most recent. It was a M2.1 at 4.0km in depth on July 10, 2019 at 04:23UTC and received 1 felt report. However, a M2.0 at 3.7km in depth on July 9, 2019 received 7 felt reports. 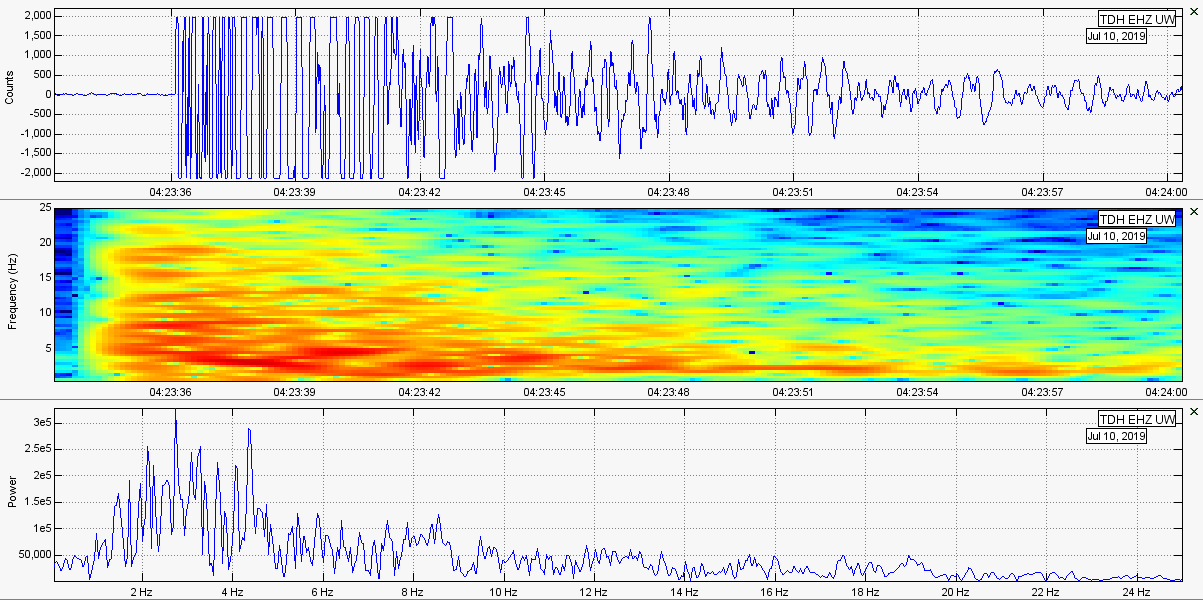 M2.1 at 4.0km depth. Mt. Shasta 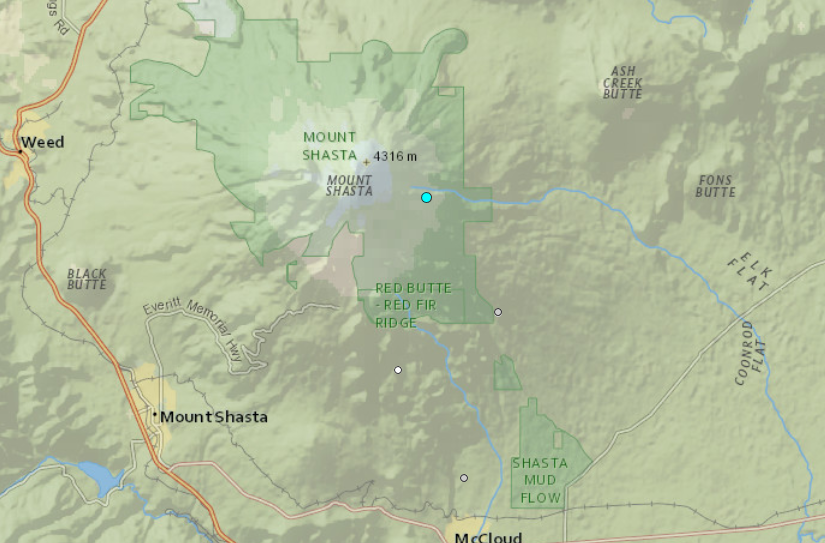 CLICK HERE to visit the USGS EQ map for this location and time period. During July 2019, Mt. Shasta saw 4 reported earthquakes of all magnitudes, which is higher than June's total of only 1 reported earthquake. This is normal, seeing Mt. Shasta is usually extremely quiet. Regardless, this month saw something interesting. The largest reported event occurred just under the eastern base of Mt. Shasta. It was quite an interesting earthquake! I believe it could be labeled as a low frequency earthquake. However, some of the neighboring stations reported some slightly higher frequencies. So, maybe a mid-frequency earthquake? There is no such terminology yet. So I will just call it a low frequency earthquake. It was a M1.6 at 10.9km in depth on July 25, 2019 at 00:48UTC. I have two of the closest stations possible show in the plots below. As you can see, it does appear to be a low frequency earthquake. I triple checked the data to make sure this was not an error from a global distant earthquake (teleseism) or a regional event. It definitely occurred under Mt. Shasta. So why the low frequencies? Maybe some small gas release or fluid migration? If it were fluid migration, there would be an earthquake swarm. So maybe just some minor degassing. Regardless of the cause, it sure was interesting! 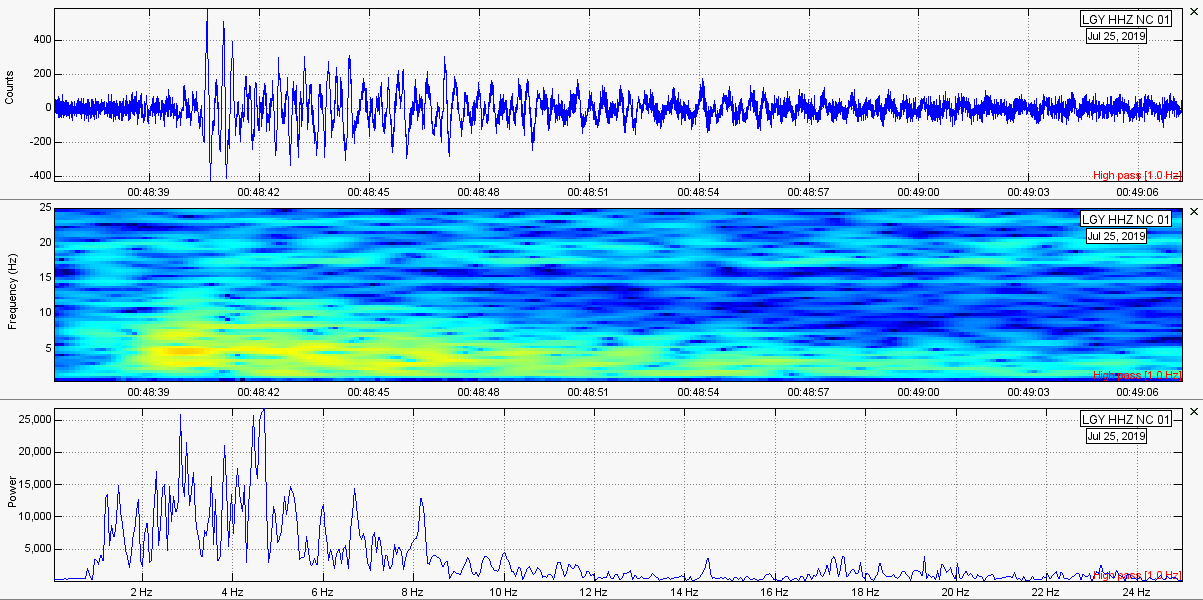 M1.6 at 10.9km in depth (closest station). 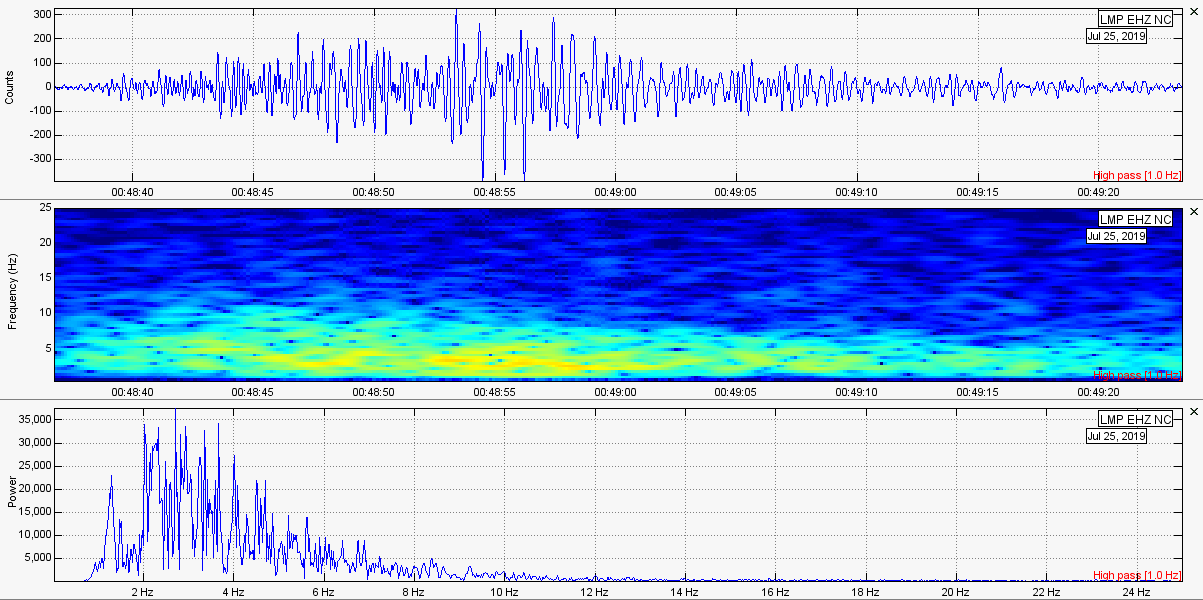 M1.6 at 10.9km in depth (2nd closest station). Lassen Volcanic Center 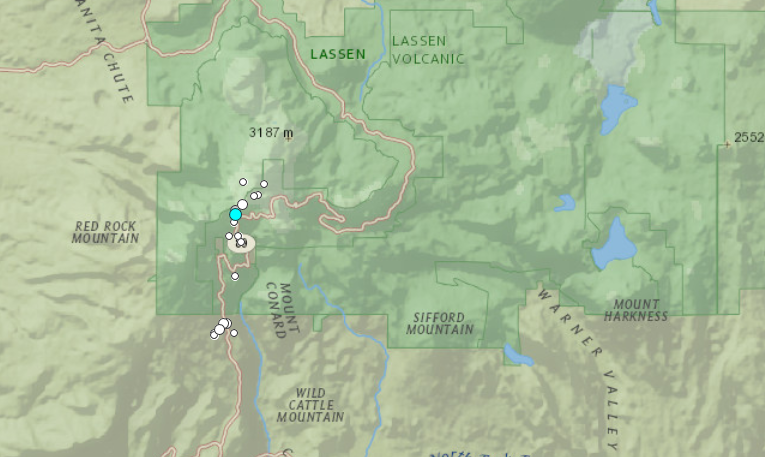 CLICK HERE to visit the USGS EQ map for this location and time period. During July 2019, Lassen Volcanic Center saw 18 reported earthquake events of all magnitudes, which is twice as many as June's total of 9 reported events. They all struck within the volcanic center itself and no earthquakes were reportedly felt. If you go to my last update, which was for June 2019, Lassen Volcanic Center experienced a couple of low frequency volcanic earthquakes. They were very fun to analyze, so check that out if you wish. The largest earthquake to strike Lassen Volcanic Center during the month of July 2019 was a M2.0 at 1.6km in depth on July 17, 2019 at 20:47UTC. It struck directly under Lassen Peak itself. Below are plots of this event: 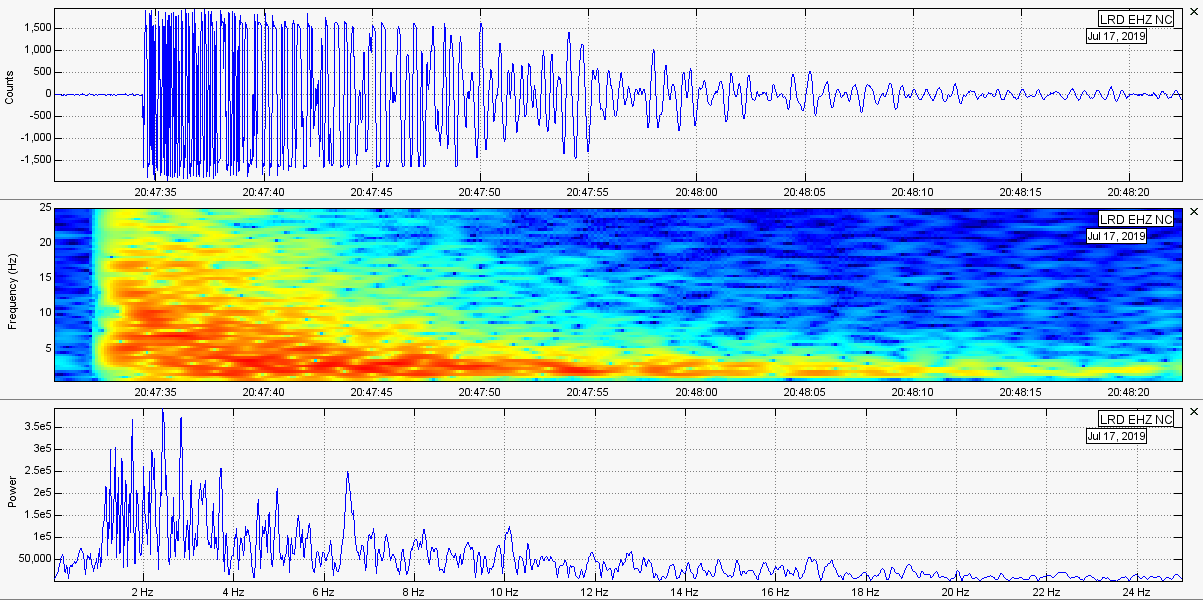
5 Comments
Rico
8/10/2019 04:39:39 am
Thank you for this update, Sir. Your work is appreciated.
Ben
8/12/2019 07:47:14 pm
Hey there! thank you much! As for that website, yes it is terrible that it is down. In the past, it has gone down many times but has been restored very quickly. I don't know why it is taking so long, but hopefully it will be restored soon. For now, I use the U of U website which has the same exact webicorders: https://quake.utah.edu/earthquake-center/heli-map
Cheryl Young
8/10/2019 07:21:50 pm
Really enjoyed this update! It's so hard for me to look up everything i want to know on my phone This is awesome Thank you for your work and dedication.
Ben
8/12/2019 07:48:33 pm
No problem! thank you! And yes, it is hard when using only a phone. If you ever need any plots or images generated for you for any event, feel free to shoot me an email at [email protected] Leave a Reply. |
About
I used to create monthly volcano updates as videos for my YouTube channel and my website. However, that took far too much time and I have had to discontinue those updates. That being said, I will now do monthly volcano updates via this blog here. I will try to get them out as soon as possible. However, if I am very busy, they may be as much as 1-2 weeks late. Archives
February 2020
Categories |
 RSS Feed