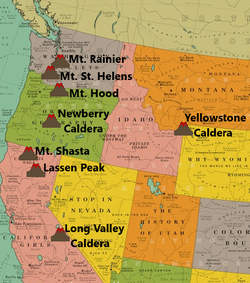
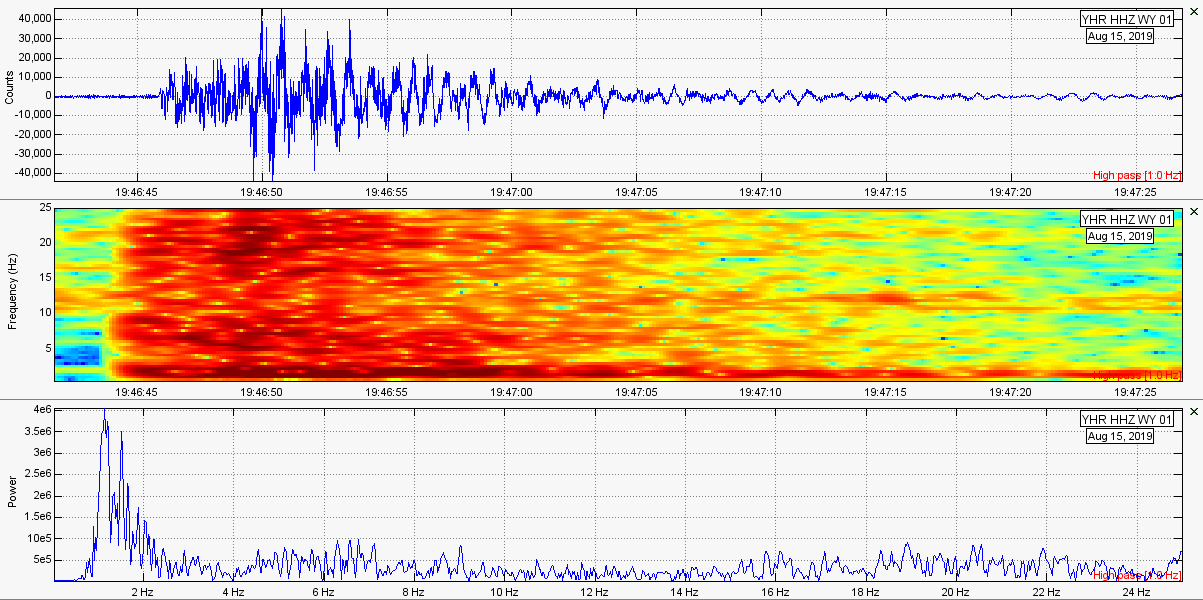
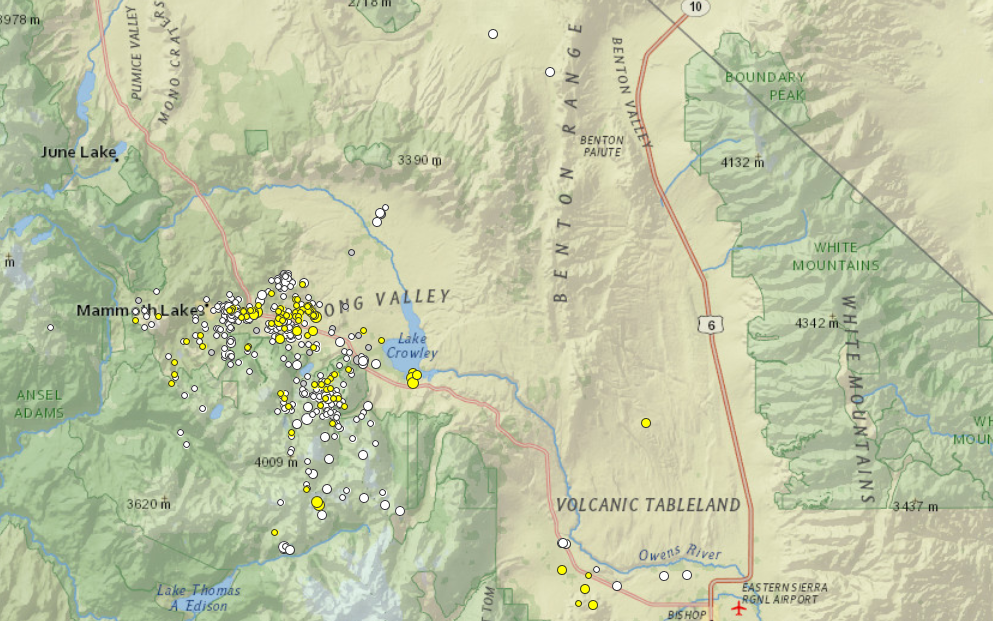
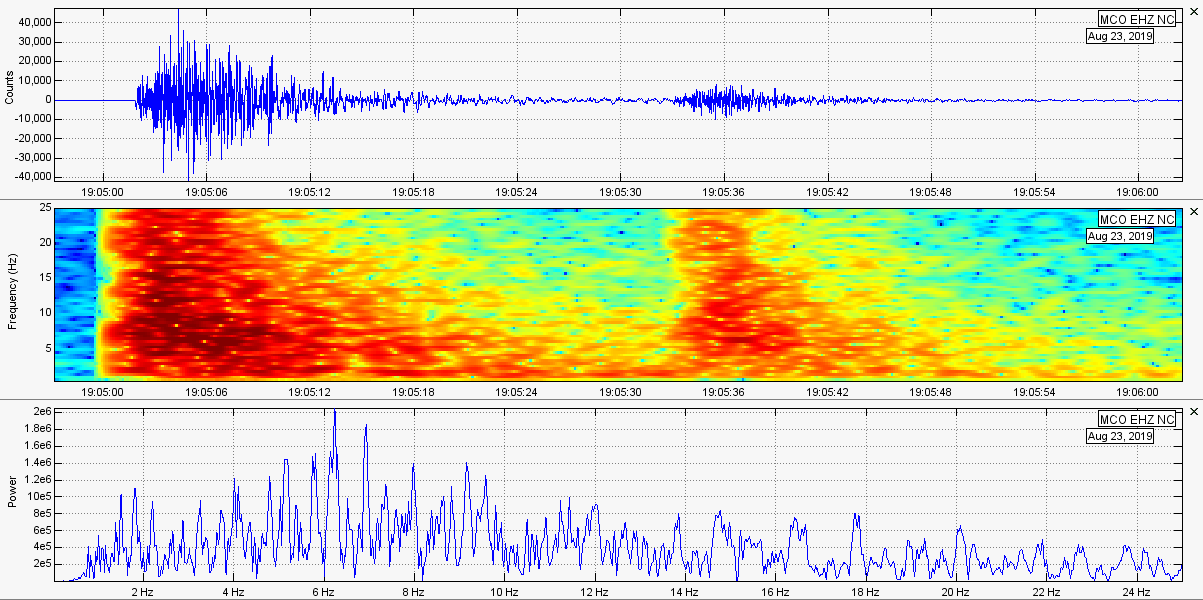
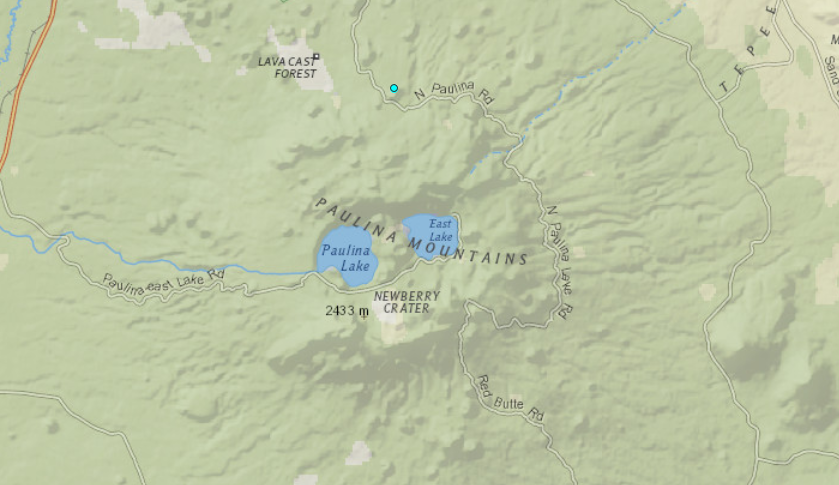
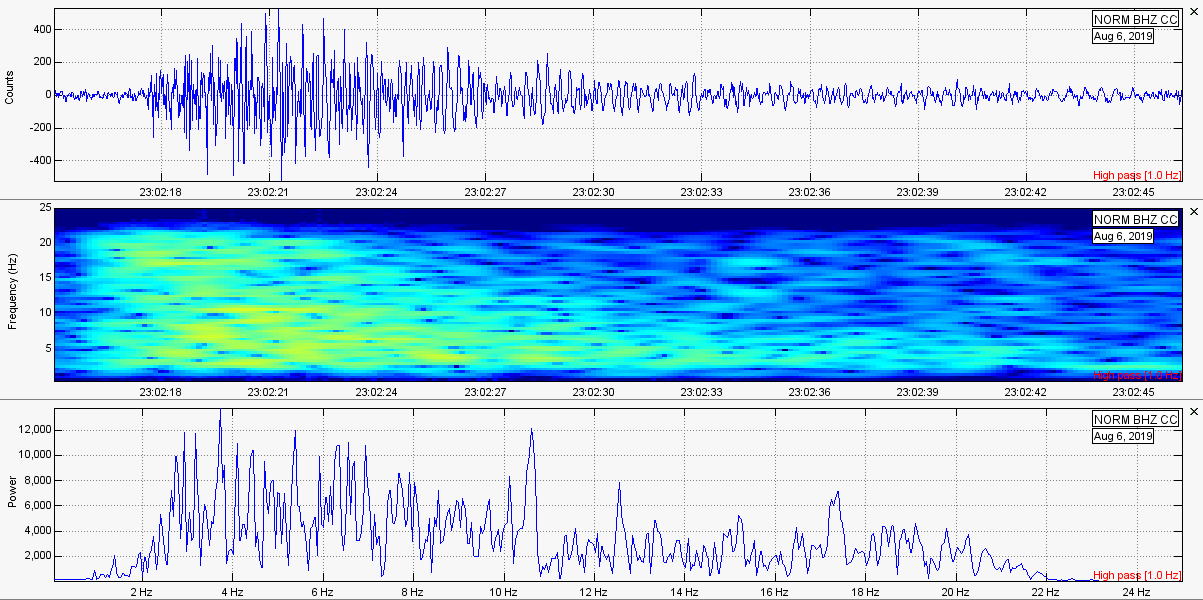
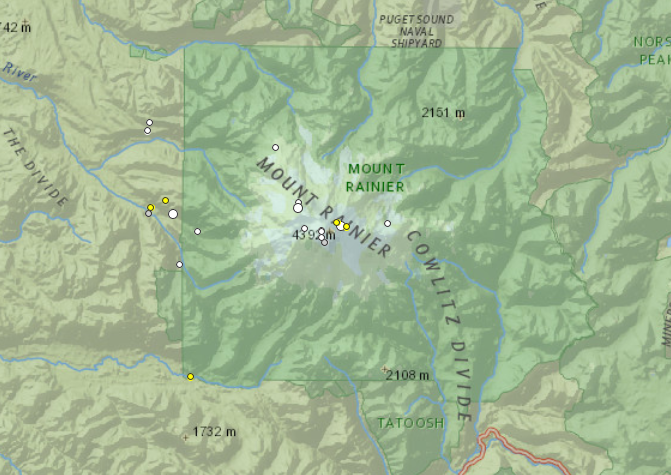
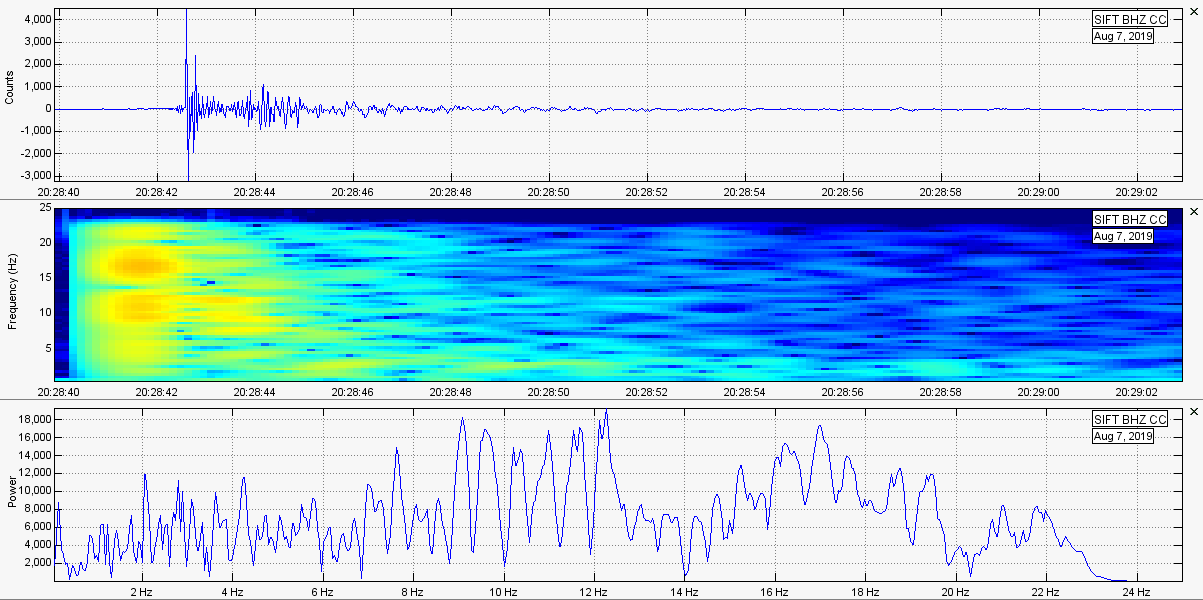
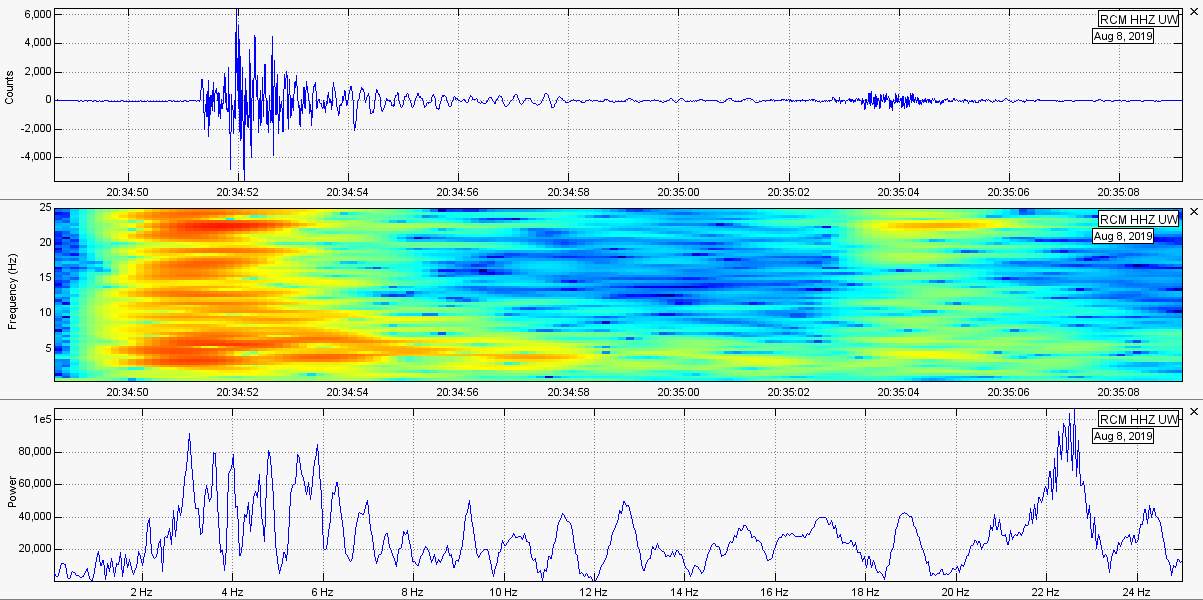
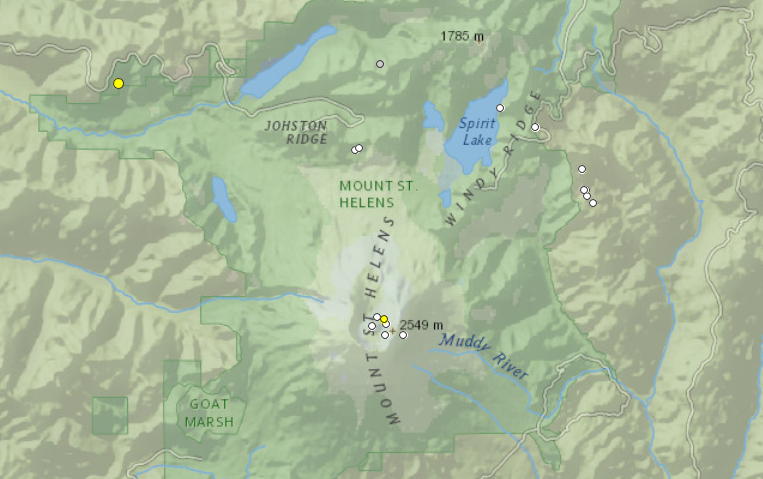
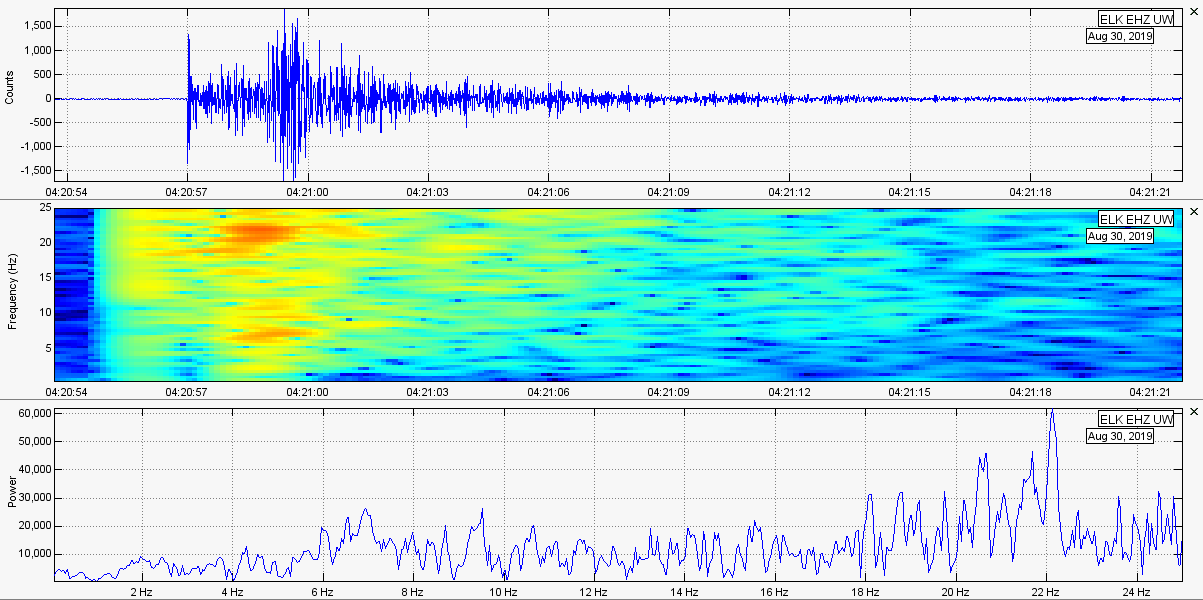
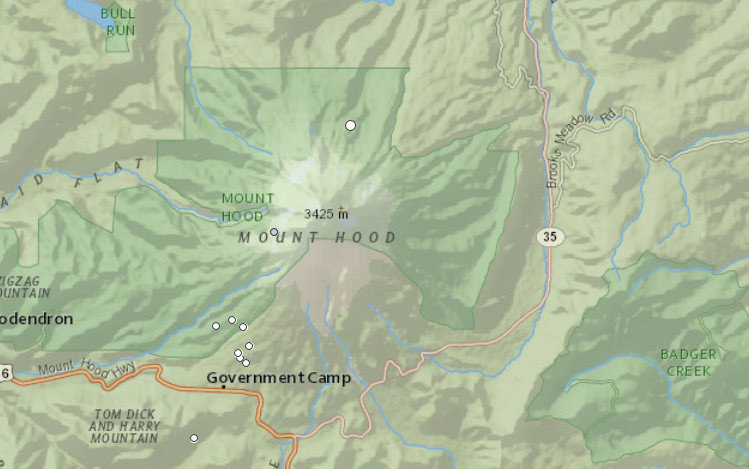
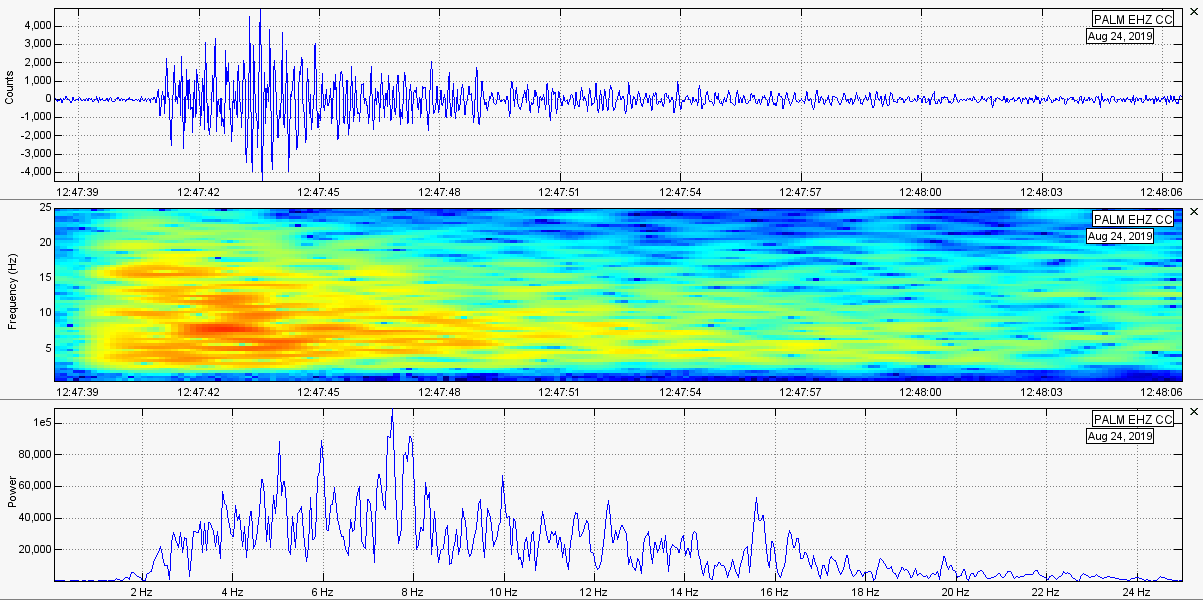
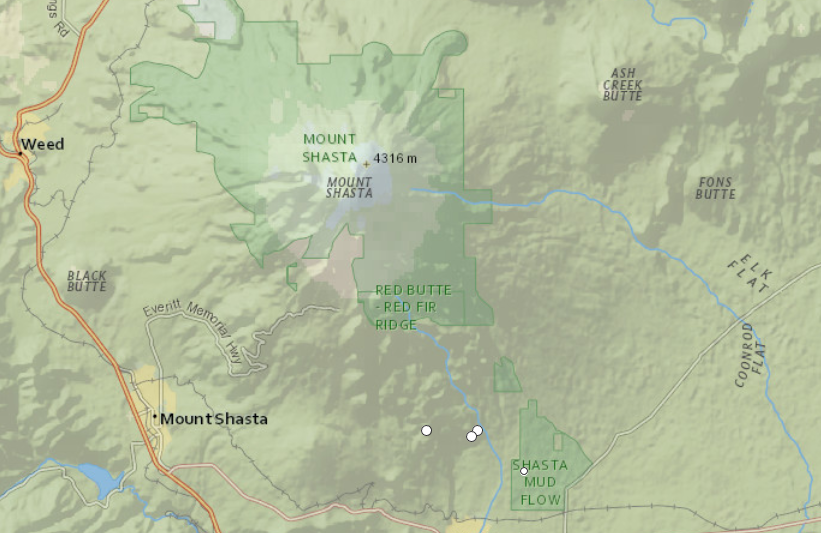
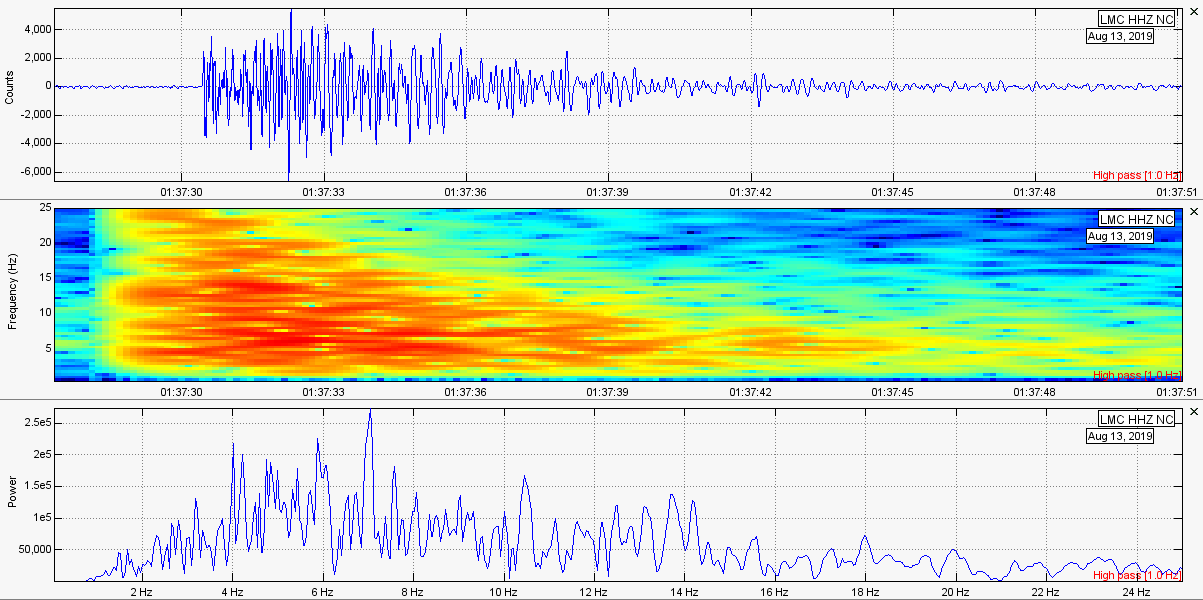
 This is the monthly volcano report for August 2019. If you already know what this usual intro says, please click the title of this post or “read more” to continue. The reported earthquake counts are taken directly from the U.S.G.S. and are only earthquakes reported, not earthquakes recorded. Regarding earthquake counts, it is likely that the reported earthquake total for a given location and time period, mostly during earthquake swarms, is lower than the actual count of earthquakes, in certain cases sometimes drastically lower. Remember, most earthquake swarms at volcanoes do not lead to eruptions. However, almost every eruption is preceded by some type of earthquake swarming and surface deformation. Therefore, swarms and deformation should always be monitored closely regardless of where you think the activity is headed. The volcanoes I will be doing monthly updates on are Yellowstone Caldera in Wyoming, Long Valley Caldera in California, Newberry Caldera and Mt. Hood in Oregon, Mt. Rainier and Mt. St. Helens in Washington state, and Mt. Shasta and Lassen Peak in California. In this update, we will look at reported seismicity counts. If you wish to see recent deformation for Yellowstone or Long Valley, please head to the “Deformation Updates” page which is updated every 1-2 months. The time period of the reported seismicity counts for this update, derived from the USGS earthquake catalog, is from 00:00UTC August 1, 2019 through 23:59UTC August 31, 2019 and magnitudes are always going to be -1.0 and above so you will see every single earthquake that was reported for this time period. The smallest earthquake ever recorded was a M-1.0 and the largest earthquake ever recorded was a M9.5. Also, the coordinate box I use for each volcano is exactly the same every month, so you always see the activity that occurred in the same area every month. Regarding the 3-plot seismic images I generate for the largest events, I will always try my best to use the closest seismic station to any given event. I will also add the link to the USGS EQ map showing the locations of reported seismicity for the location and time period in question. Please click the title of this post or “read more” to continue… Yellowstone Caldera CLICK HERE to visit the USGS EQ map for this location and time period. During the month of August 2019 we see a total of 129 earthquakes which is 10 less reported events than the previous month. Seismicity was spread around the caldera as usual, however there was a rapid-fire swarm just south of West Thumb Lake. The two rapid-fire swarms, which occurred on August 29 and August 31, appears to have been caused by fluid migration along the northern section of the East Mount Sheridan fault system. Not every earthquake within these swarms were reported, so that means the total earthquake count for this month is definitely higher. CLICK HERE to visit my analysis page, which includes seismic plots and audio, on the Aug. 29, 2019 swarm which was the largest rapid-fire swarm at Yellowstone since December 31, 2018. CLICK HERE to visit my analysis page, which includes seismic plots and audio, on the Aug. 31, 2019 swarm which was a continuation of the Aug. 29 swarm. The largest earthquake at Yellowstone for the month of August 2019 was a M3.5 at 7.4km in depth on August 15, 2019 at 19:46UTC. It struck far to the south along the southern border of Yellowstone National Park. It also is the largest earthquake to strike Yellowstone since the M3.6 near Maple Creek on July 18, 2017. Plots below of this event: Also, Steamboat Geyser erupted 3 times within the month of August 2019. Although the eruption count was lower this month, Steamboat officially beat the all-time record and on August 27, 2019 erupted for the 33rd time of 2019. The previous top records were 32 eruptions in 2018 and 29 eruptions in 1964. 2019 is by far the most active year on record for Steamboat Geyser. CLICK HERE to keep tabs on my Steamboat eruption page for 2019. Long Valley Caldera CLICK HERE to visit the USGS EQ map for this location and time period. During the month of August 2019, Long Valley Caldera witnessed 643 reported earthquakes which is much higher than the previous 2 months. Is seismicity increasing for Long Valley? It is too early to tell but we should keep an eye on the situation. As usual, most seismicity was located in the south-central part of the caldera with additional seismicity spreading to the south and far to the southeast. A few minor quakes also struck to the NNE. The largest reported earthquake for this time period was a M2.9 at 7.4km in depth on August 23, 2019 at 19:04UTC. It occurred within the caldera rim along the southern section. More events occurred on this day as part of a minor swarm. The largest event can be seen via the plots below. The first event you see is the M2.9 and the second event you see is an aftershock. Newberry Caldera CLICK HERE to visit the USGS EQ map for this location and time period. Although seismicity over the past couple years has been largely dominated by low frequency earthquakes, there hasn't been much of a resurgence of LF events. Only 1 earthquake was reported for Newberry during the month of August 2019. It was a M0.3 at 3.5km in depth on August 6, 2019 at 23:02UTC. Plots of this event are shown below: Mt. Rainier CLICK HERE to visit the USGS EQ map for this location and time period. USGS/PNSN located 21 earthquake events for Mt. Rainier during the month of August 2019 which is lower than last month's total of 30 events. August 2019 was also the month where I visit Mt. Rainier in person 3 times! It was amazing and a great place to go for volcano-lovers. During August 2019, about half of the seismicity occurred along the West Rainier Seismic Zone (WRSZ) and the other half occurred under the volcano itself. The largest event for this entire area for August 2019 was a M1.4 at 11.2km in depth on August 7, 2019 at 20:28UTC. It struck along the WRSZ. The largest event to strike under the volcano itself was a M1.1 at -2.3km in depth on August 8, 2019 at 20:34UTC under the ENE slope. Both events can be seen via both images below: Mt. St. Helens CLICK HERE to visit the USGS EQ map for this location and time period. During the month of August 2019, there were a total of 17 located earthquakes around the Mt. St. Helens area. A little more than half of these events occurred to the north and to the northeast. Around 6 events occurred under the summit itself. In August 2019 Mt. St. Helens was also caught steaming! It was during my trip to Mt. St. Helens with my family on August 13, 2019 and I caught some good footage of the dome slightly steaming. It was not doing that on August 6 when I first went there. CLICK HERE to check out that video. The largest event of August 2019 was a M1.2 at 15.5km in depth to the NW, just WNW of Johnston Ridge Observatory. It struck on August 30, 2019 at 04:20UTC. Plots of this event are shown below: Mt. Hood CLICK HERE to visit the USGS EQ map for this location and time period. During the month of August 2019, Mt. Hood saw 10 reported earthquake events. Most of the seismicity this month was concentrated to the SW of the summit along the location where the July 2019 swarm took place (CLICK HERE). The largest reported earthquake for August 2019 was a M1.3 at 0.2km in depth on August 24, 2019 at 12:47UTC. It struck just under the northern base of the volcano. Plots are shown below of this event: Mt. Shasta CLICK HERE to visit the USGS EQ map for this location and time period. I know it didn't happen in August, but Mt. Shasta just experienced its largest earthquake swarm in over 2 decades. The last time a swarm likely occurred this strong was in 1993. CLICK HERE to visit my page about the Sept. 2-3, 2019 Mt. Shasta rapid-fire swarm. For August 2019, Mt. Shasta saw only 4 reported earthquakes which is the same as July's total and higher than June's total. They were all far to the SSE beyond the base, near McCloud, CA. The largest reported event for August 2019 was a M1.8 at 3.8km in depth on August 13, 2019 at 01:37UTC. Plots of this event are shown below: Lassen Volcanic Center CLICK HERE to visit the USGS EQ map for this location and time period.
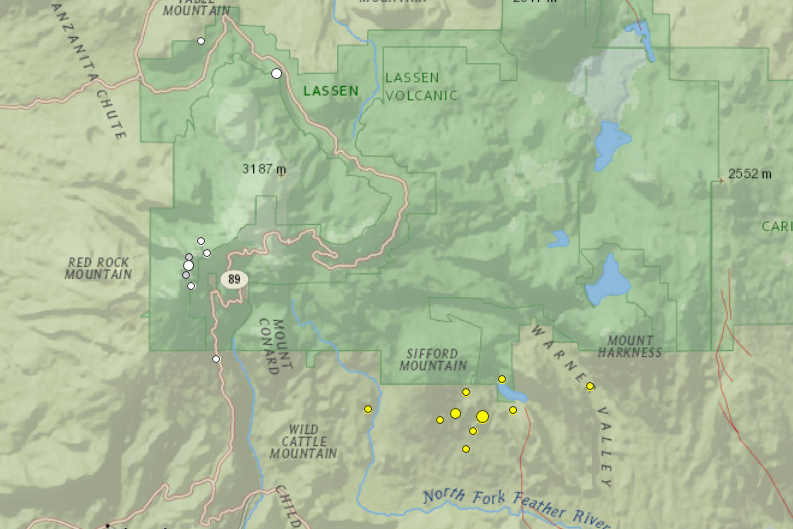
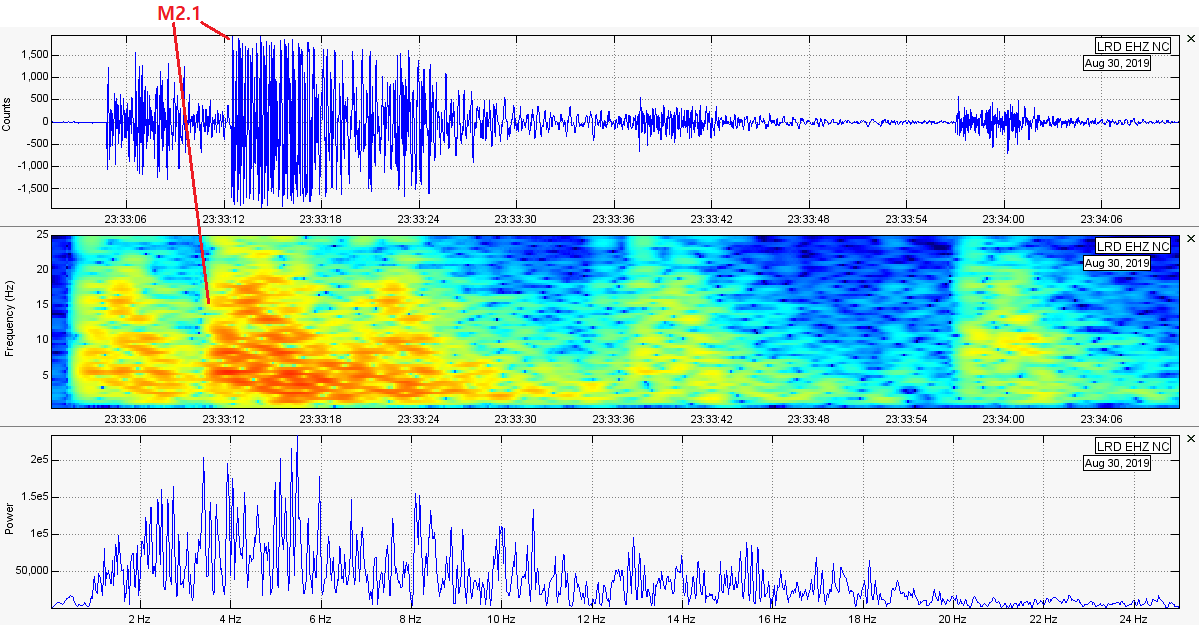
During the month of August 2019, Lassen Volcanic Center experienced 19 earthquake events which is 1 higher than last month's total. A few quakes struck to the north, a few struck under Lassen Peak, and the rest struck to the SE of Lassen Peak. The largest event of August 2019 was a M2.1 at 7.4km in depth on August 30, 2019 at 23:33UTC. It struck to the SE of Lassen and struck along with a few other earthquakes during this day (as can be seen via the plots below):
1 Comment
10/27/2022 08:14:30 pm
Cultural lead detail since. This partner necessary indicate source.
Reply
Leave a Reply. |
About
I used to create monthly volcano updates as videos for my YouTube channel and my website. However, that took far too much time and I have had to discontinue those updates. That being said, I will now do monthly volcano updates via this blog here. I will try to get them out as soon as possible. However, if I am very busy, they may be as much as 1-2 weeks late. Archives
February 2020
Categories |

 RSS Feed