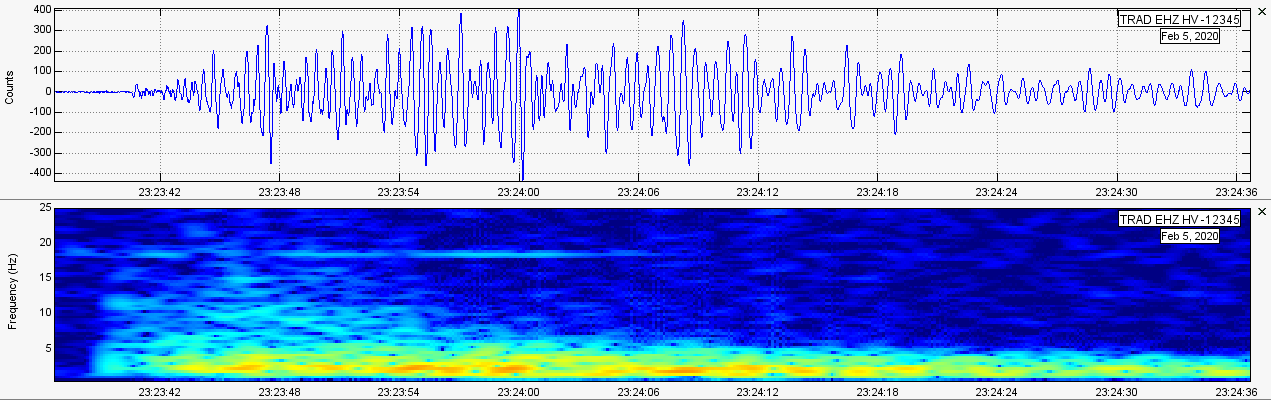
 In this post I wanted to quickly show data and information pertaining to a certain event that happened at about 23:23UTC on Feb. 5, 2020. Please click the title of this post or "read more" to continue... First off, over the past week or so there has been quite an increase in seismicity around Kilauea, Mauna Loa, the Kilauea LERZ, and the mantle plume conduit(s) under Pahala, HI. I recently made a post about this detailing some of those events and past spasmodic tremor over the past few months. Please CLICK HERE if you wish to view that detailed post. Strange M2.8 under Kilauea 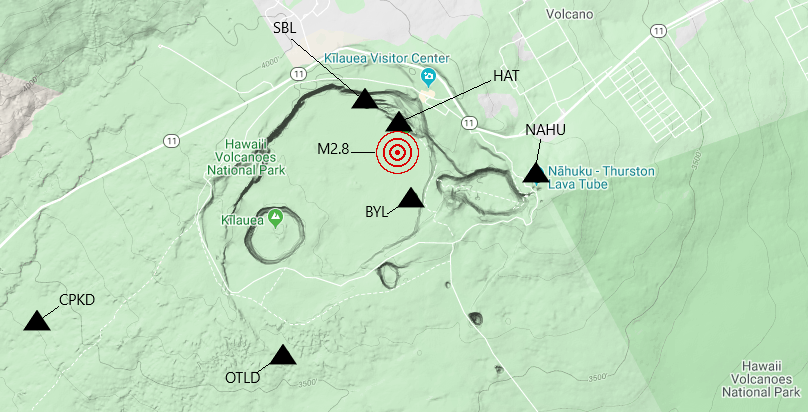 On February 5, 2020 at 23:23UTC, a M2.8 earthquake struck just beneath the caldera floor at Kilauea at -0.1km in depth, reportedly. I first thought nothing of it, but decided to check the waveform/frequency content of this event. I downloaded data from station CPKD, one of the stations shown on the map above. I use that station frequently to monitor the waveforms of earthquakes that occur under Kilauea, since it is only a mile or so from the caldera and frequency attenuation should not be a problem. I was surprised to see some really low frequencies associated with most of the event, signaling this was likely a hybrid earthquake Then I downloaded data from all six stations shown in the map above. To my surprise, stations BYL, HAT, and SBL, the stations closest to the epicenter, showed a quick burst of high frequencies, also with an unnaturally long coda (end tail of an earthquake). Here is why I was perplexed: Frequencies attenuate with distance, meaning the further from the epicenter you are the lower the frequencies will be from that same event. For high frequencies, say around 25Hz, to diminish to mainly low frequencies, say 5Hz and below, it would take many, many miles. Stations only a couple of miles away showed mainly low frequencies, especially OTLD and CPKD, and stations directly at the epicenter saw much higher frequencies within the initial burst, but with an unnaturally long end tail. Basically, the frequencies of this event should not have dropped so dramatically over such a short distance of a couple miles. Why is this? Well, in my opinion, this signature is very similar to the volcanic eruption signatures that occurred at Kilauea during the 2018 eruptions (CLICK HERE to visit my Hawaii 2018 eruption page which shows a few examples of what the eruption signatures looked like). There was no eruption on this day, but it is very possible a small amount of magma encountered a small groundwater pocket and "exploded". This could explain why there was such a long coda, why frequencies dropped so dramatically within a short distance, and why it occurred so shallow. But who knows, I am only an amateur. Below are the seismogram plots from the six stations shown on the map above. The plots are placed in order from the closest station shown at the top of the image. Note how dramatic the frequency attenuation was over such a short distance. 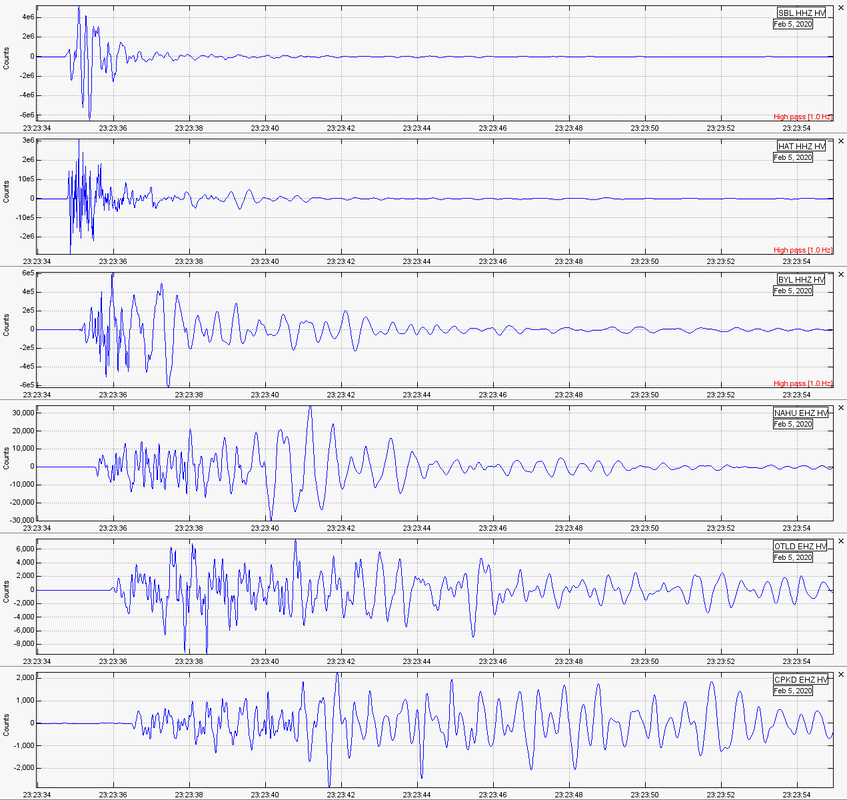 And here we have the spectrogram plots from those same six stations (note the very long coda): 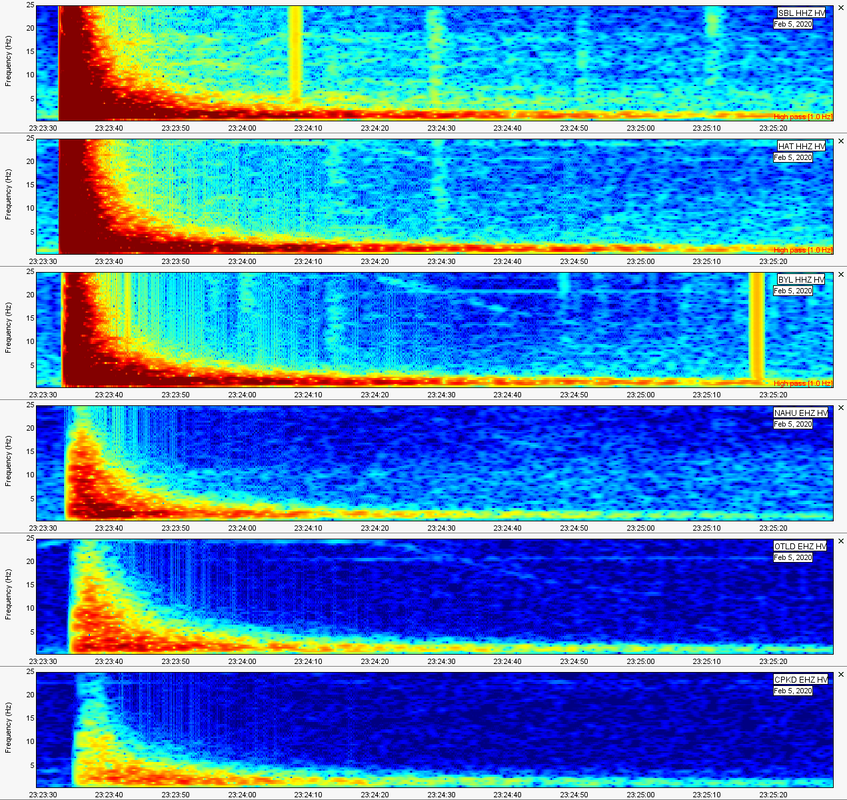
1 Comment
4/25/2021 10:37:33 am
Hay Ben miss your yt videos very much. I hope that you and your beautiful family are doing good these days. Leave a Reply. |
About
This blog is specifically for activity that occurs in Hawaii. In light of 2018's eruptions on the Big Island, I felt it necessary to have a section entirely devoted to events in Hawaii. I now mostly use this blog to update people on volcanic spasmodic tremor which occurs deep within the mantle plume conduit(s) under Pahala, HI. Don't know what spasmodic tremor is? Don't fret! Simply go to the Hawaii menu and click the page about Hawaii Spasmodic Tremor. Archives
February 2020
Categories |
 RSS Feed