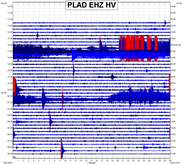
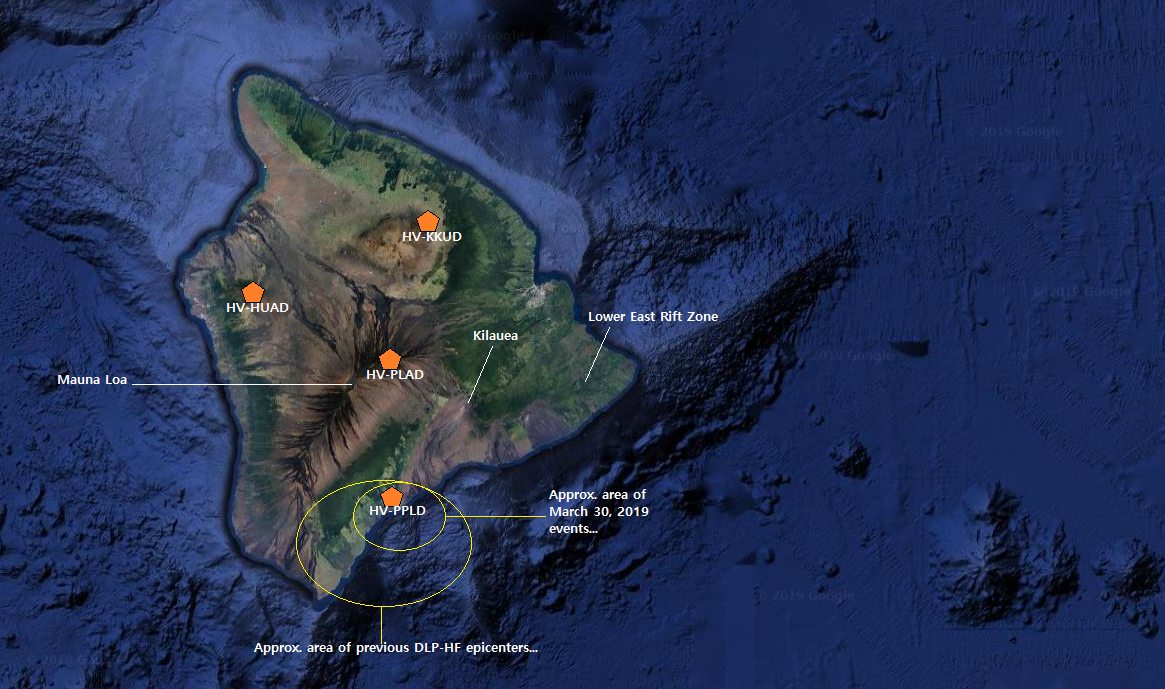
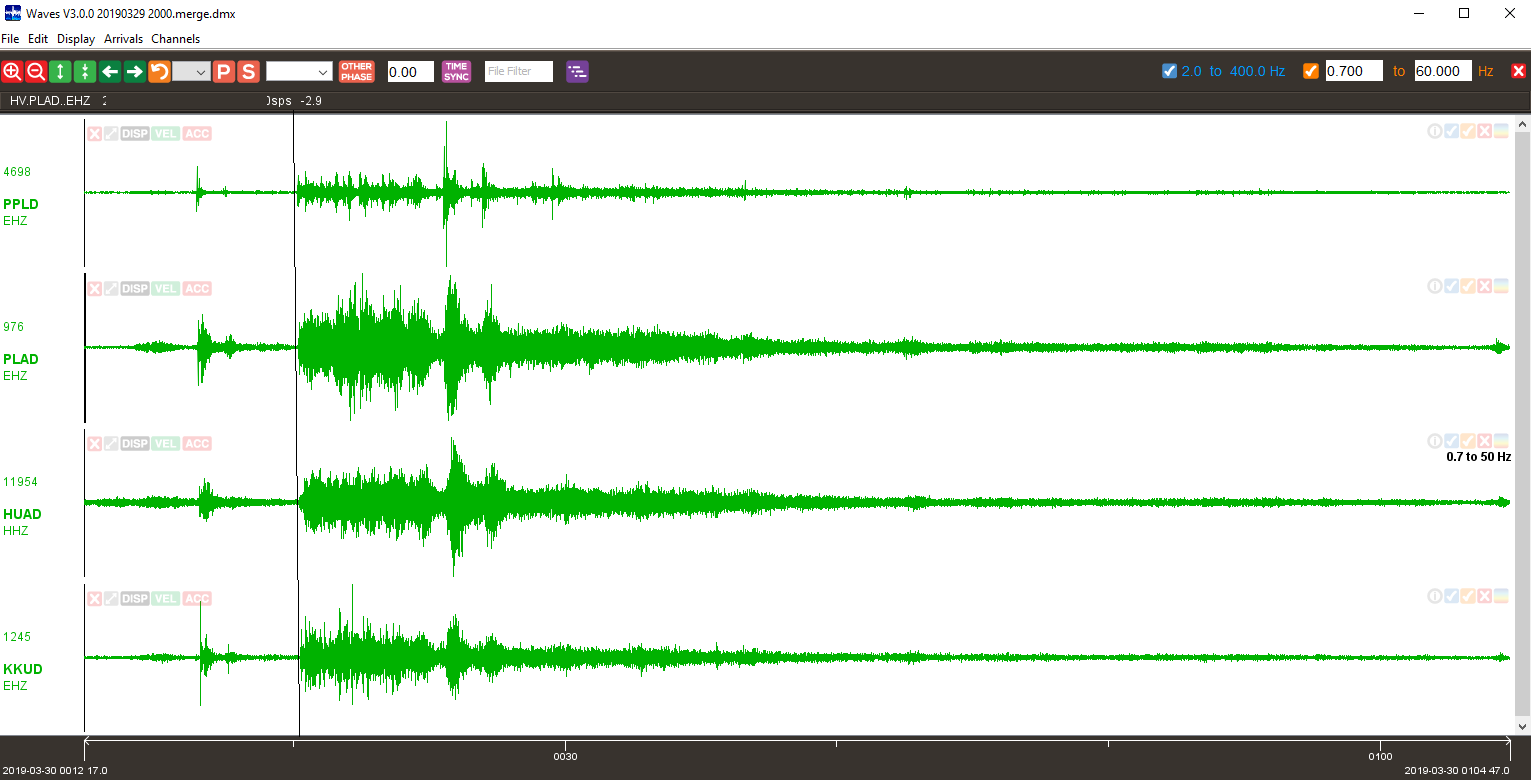
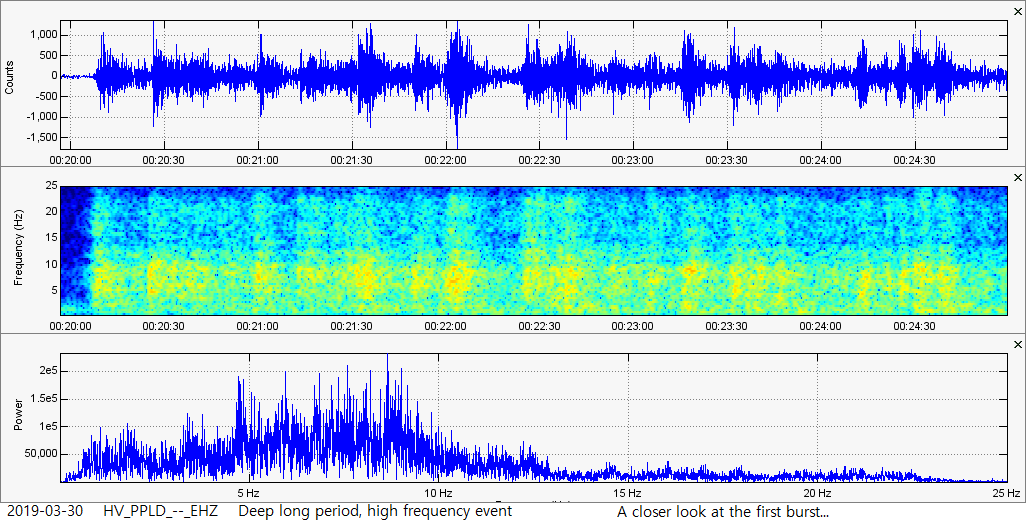
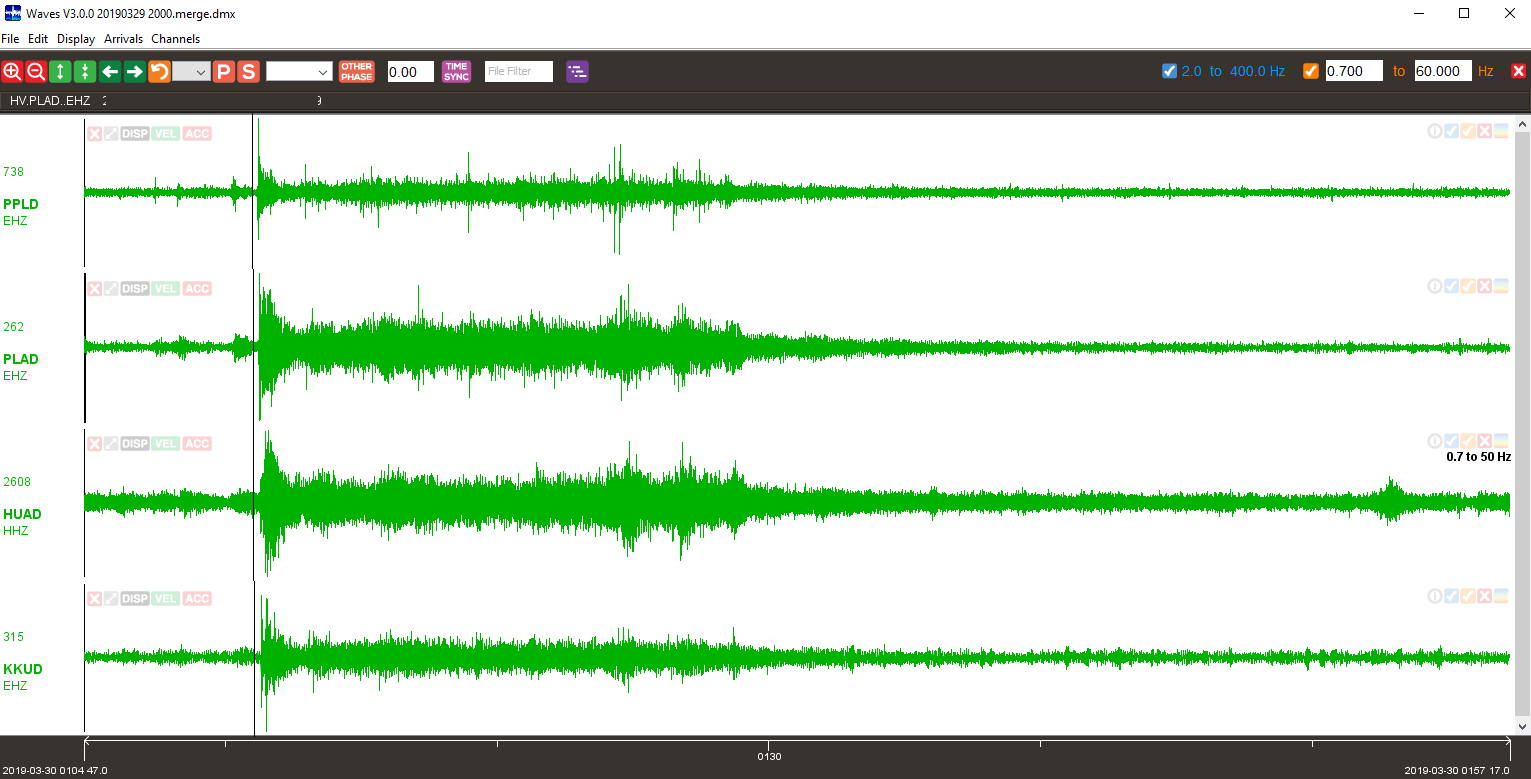
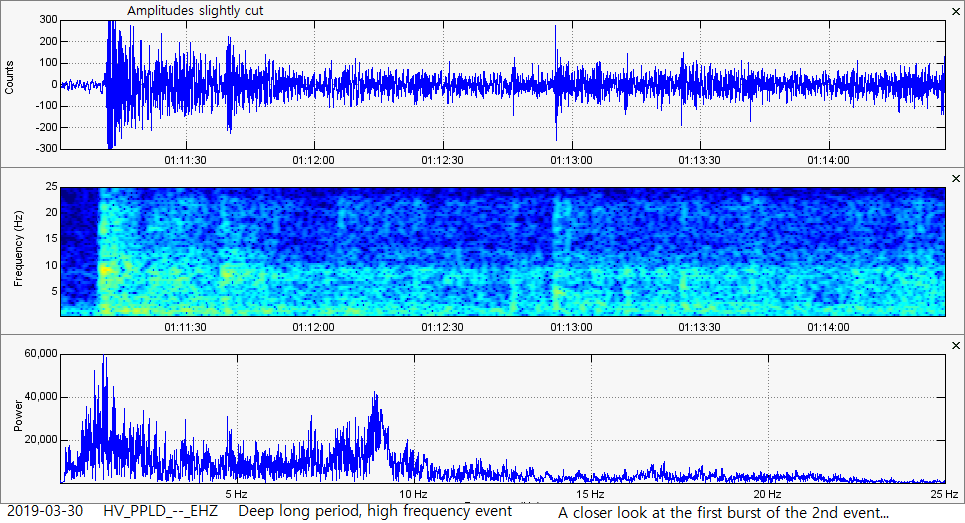
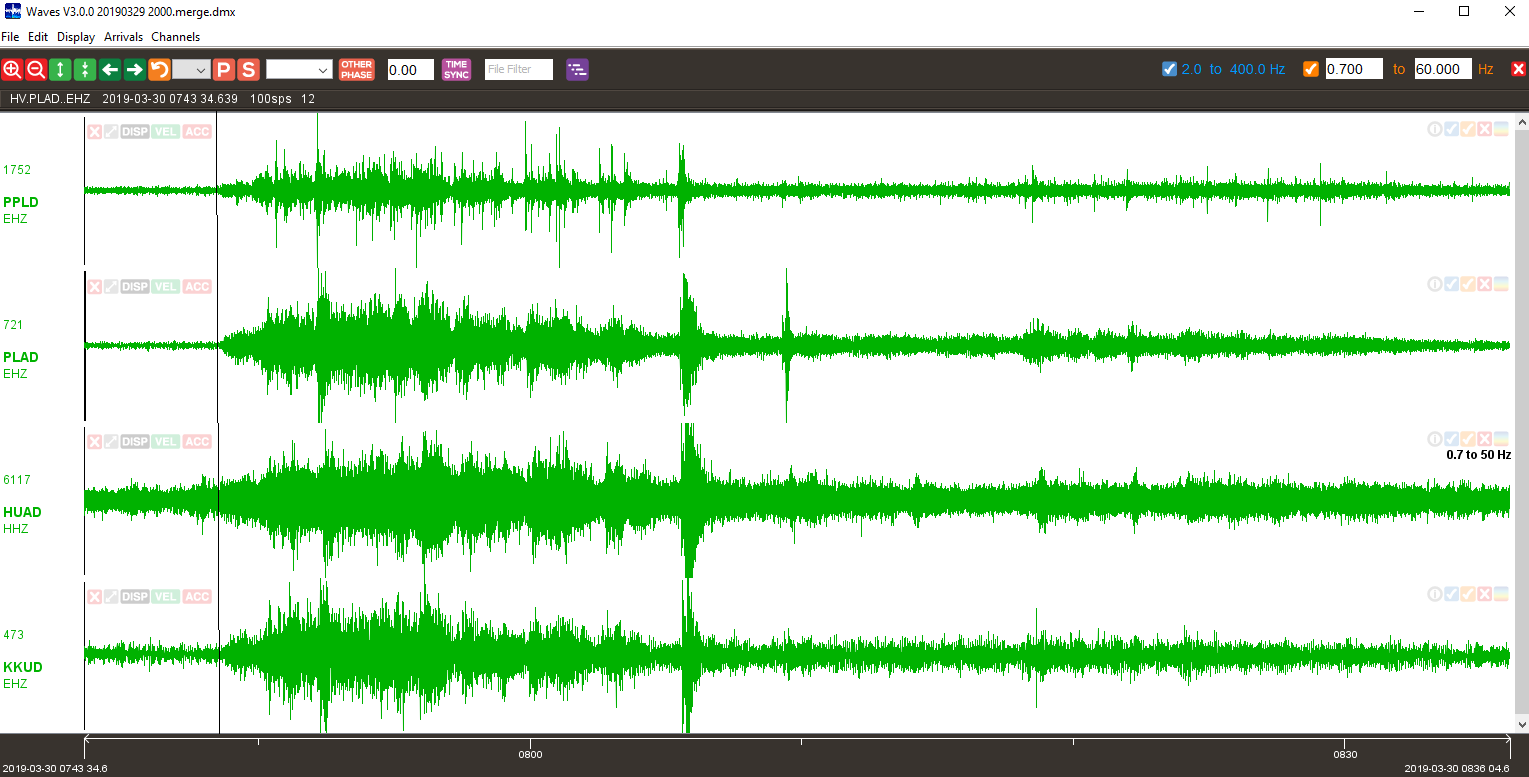
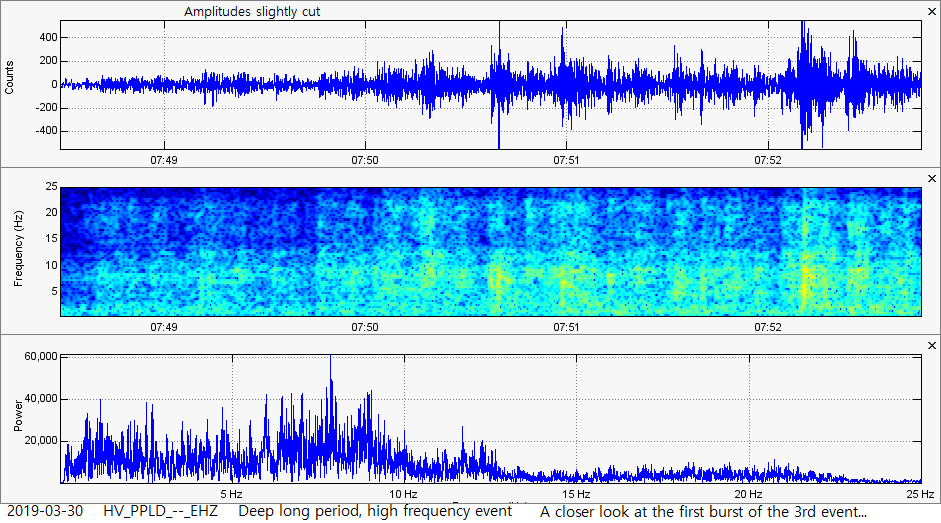
 Here we go once again! On March 30, 2019 more DLP-HF events occurred under the Big Island of Hawaii. These DLP-HF (deep long period, high frequency) events, as I like to call them, seem to be happening much more lately. They occur primarily between 30km and 50km in depth under Pahala, Hawaii and can last a great amount of time. What is causing these events? Mass amounts of magma flowing through the main conduit from the mantle plume to the volcanoes? I don't know and I won't pretend to know. I will simply show some data and I suggest, if you know how to analyze seismic data, to check these events out for yourself. If you haven't already, please click the title of this post or "read more" to continue... On March 30, 2019 more DLP-HF (deep long period, high frequency) events rumbled the Big Island of Hawaii. Of course it is highly unlikely anybody felt these, but I feel these events are extremely important and could signal some type of change in the deep magmatic activity that occurs under Kilauea and the other volcanoes. In the image above I have labeled the 4 seismic stations I will use for the analysis below. The small circle is the likely epicenter of these DLP-HF events for March 30, 2019. The larger circle is the approximate area of previous DLP-HF events, including the ones seen on January 23 and March 27-28, 2019. If you wish to see my previous blog post about the March 27-28, 2019 events, please CLICK HERE. If you wish to see my blog post on the first ones I ever spotted, which occurred on January 23, 2019, please CLICK HERE. Also, if you wish to see the USGS earthquake map showing seismicity for March 30, 2019, including the events reported for these DLP-HF events, then please CLICK HERE. Some of the reported events for these strange DLP-HF events are labeled as "Other Event" by USGS, simply because it really is a strange event. However lately it seems they are mainly reporting them as earthquakes, even though these are more than just earthquakes. These DLP-HF events occur deep, primarily between 30km and 50km in depth, off the shore of Pahala, Hawaii. They also can last anywhere from 15 minutes to almost a whole hour at times! They also contain mid to high range frequencies and if one occurs, usually a few more follow after a few hours. Also, the amplitudes recorded by seismic stations on the island suggest these are weak. Likely equivalent to a M1.5 to sometimes a M3.0 earthquake. However it is very hard to attach actual magnitudes to these events since they sometimes are emergent and last a very long time. Here are my custom helicorders for the 4 seismic stations labeled in the image above. All of the following data was compiled by me by using data from those 4 stations, the program SWARM, and the program WAVES. Remember, you can pause this slideshow anytime you want... Those events look quite weird, huh? Since 3 events occurred on March 30, 2019, I will show some of the data for each separate event. Why does it seem like these events are occurring more and more lately? 1st event: Here is the first DLP-HF (deep long period, high frequency) event of March 30. Above you can see the seismograms of this event from the 4 stations labeled on the map in the beginning of this post. The first event of March 30 started at about 00:16UTC and lasted approximately 48 minutes. Other events like these have been more emergent, however it seems this one occurred suddenly and shows more "earthquake bursts" than some of the other events. This can be seen in the image directly below, which is a zoomed in look at the first burst of the first event as seen on station PPLD: Here is a slideshow of the 3-plot images I made showing the first event of March 30. You can pause the slideshow anytime and scroll through the images. Again, these were taken from the 4 seismic stations labeled on the map in the beginning of this post. 2nd event: Above are the seismograms of the 2nd event of March 30, 2019. Remember, the 4 stations shown above, which are the 4 stations labeled in the map shown earlier, are the only 4 stations I will use for the data in this post. The 2nd event started at about 1:10UTC and lasted approximately 27 minutes. Below is a closer look at the first burst of the 2nd event as seen on station PPLD: Here are some 3-plot images of the 2nd event, which I generated using the program SWARM and data from the 4 seismic stations labeled on the map shown earlier: 3rd event: Above are the seismograms of the 3rd event which occurred at about 7:48UTC, March 30, 2019, and lasted approximately 53 minutes. That is a long time for one event! This event was more emergent than it's predecessors and lasted the longest I have seen out of any of these events. Again this events seemed to contain multiple earthquakes striking in rapid succession along with tremor occurring as part of this event, peaking at about 9.7Hz or so. Here is a closer look at the first burst of the 3rd event: Now here are the 3-plot images of this 3rd event of March 30, 2019. Again, it is in slideshow format so you can pause it or scroll through the images.
0 Comments
Leave a Reply. |
About
This blog is specifically for activity that occurs in Hawaii. In light of 2018's eruptions on the Big Island, I felt it necessary to have a section entirely devoted to events in Hawaii. I now mostly use this blog to update people on volcanic spasmodic tremor which occurs deep within the mantle plume conduit(s) under Pahala, HI. Don't know what spasmodic tremor is? Don't fret! Simply go to the Hawaii menu and click the page about Hawaii Spasmodic Tremor. Archives
February 2020
Categories |
 RSS Feed