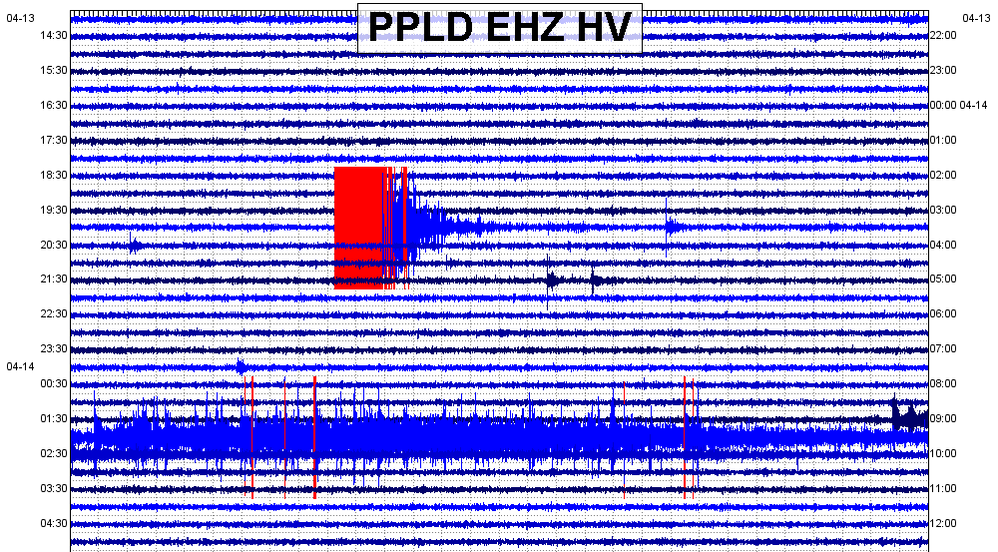
 A clip of the custom-made helicorder for PPLD. The M5.3 is shown, as well as the deep long period, high frequency event. The activity in Hawaii is far from over! For a few days there were extremely low rates of seismicity all across the Big Island of Hawaii. Then, all of a sudden, a strong M5.3 struck the Big Island and almost 2,000 people reported to USGS within hours that they felt this event. Although one would assume this M5.3 struck near Kilauea, it did not! Surprisingly, it struck just to the NE of a dormant volcano called Hualalai. Hualalai has not erupted since the 1800's but if this seismicity was related to a type of magma event, it is possible Hualalai could be recharging for a soon-coming eruption. That is not for sure, but it is possible. Also, just 6 hours or so after the M5.3, another strong deep long period, high frequency event struck near Pahala, Hawaii. If you follow my work, you know I am fascinated with them. In this post I will show some information and data pertaining to these two events. If you have not already, please click the title of this post or "read more" to continue... 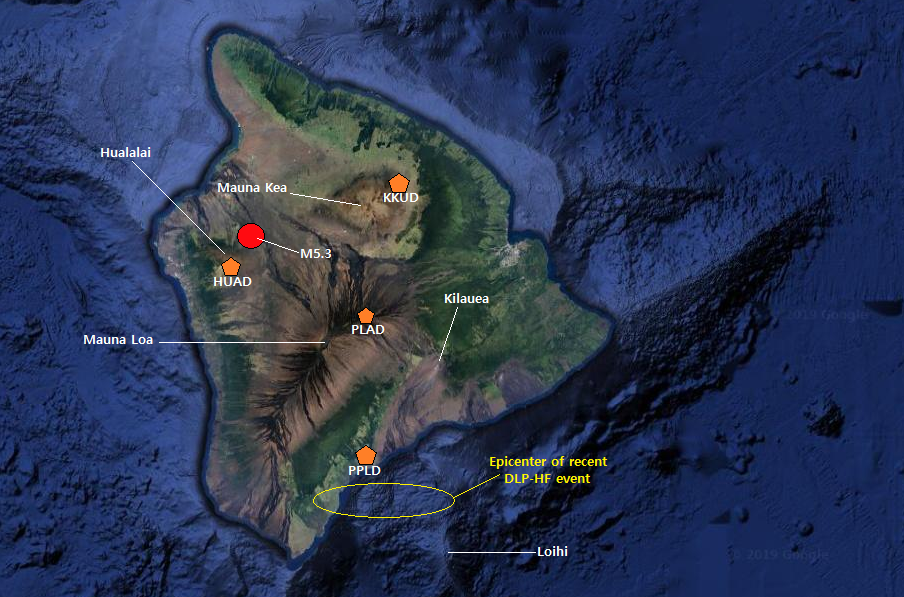 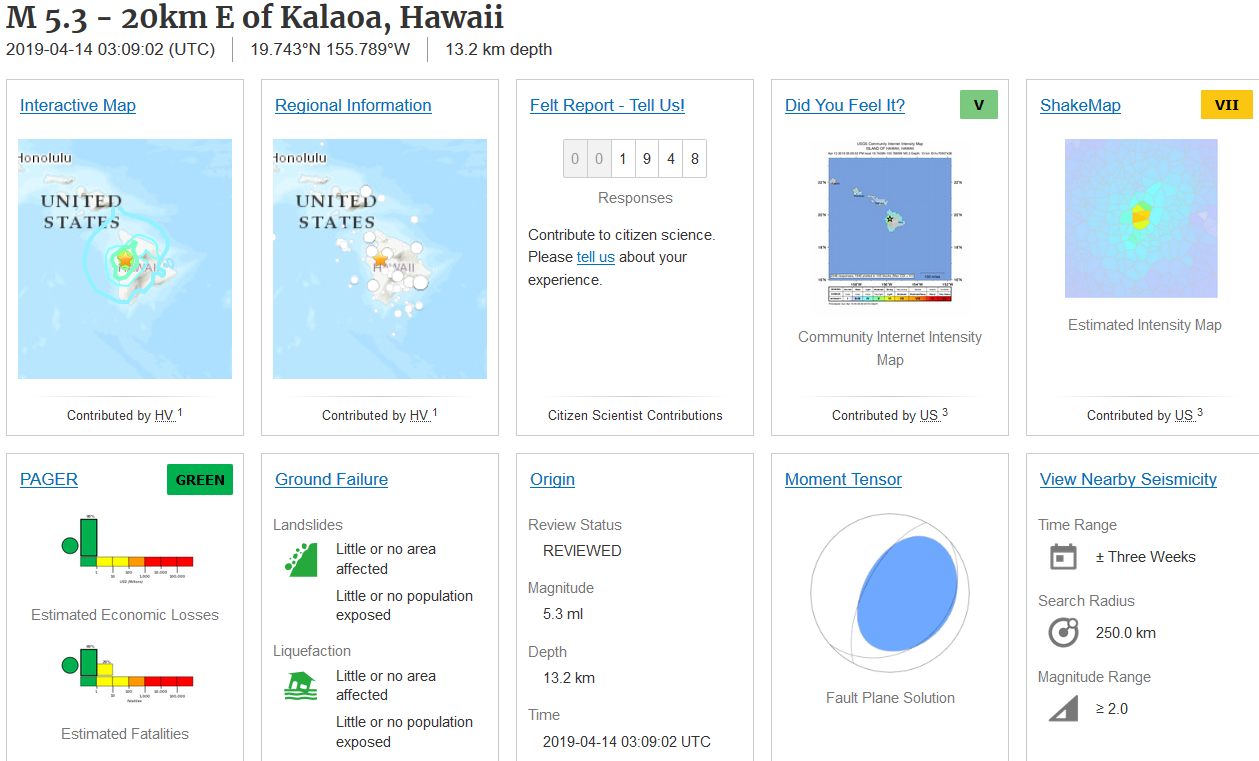 First off, if you wish to see all stations within the HV network in Hawaii, please CLICK HERE. To hear the seismic audio fo this M5.3 and DLP-HF event, please scroll to the end of this post. Also CLICK HERE for the IRIS DataSelect URL builder, the seismic database to download data from, and also CLICK HERE for the download location for the seismic program SWARM. SWARM can help you analyze the data you download. Multiple pages under the "How To" menu of this website can also teach you additional information so you can analyze these events yourself from the comfort of your own home. There were many other earthquakes that occurred, which are not shown on this blog, so I highly recommend you check out the data yourself. The first image you see above shows the location of the M5.3, which struck at 13.2km in depth, and the location of the DLP-HF event which struck only about 6 hours after the M5.3 (DLP-HF epicenter marked in yellow). The image also shows the 4 seismic stations I use for the data shown below. Refer to this map if you wish. If you wish to see the seismicity for during this time period, please CLICK HERE. Now this M5.3 really startled some people in Hawaii, sending fears of another volcanic eruption. Well no eruption occurred... Yet... However we must watch and be wary and I pray for the safety of the people on the Big Island. This M5.3 struck just slightly to the NE of Hualalai volcano, a volcano that has not seen any type of eruptive activity since the 1800's. If you wish to see additional information on Hualalai, please CLICK HERE. This M5.3 was the second largest earthquake to strike the Big Island of Hawaii since the eruptive activity started to calm in August 2018. To see proof of this, please CLICK HERE. That is the USGS earthquake catalog set to M5.0 and above since August 1, 2018 to now. The image you see directly below the map is the event page for the M5.3. Note how many people reported feeling this event! The vast majority of that number was reported within the first few hours of the M5.3 striking the island. Also take a look at the moment tensor provided by USGS. Very intriguing! Although I am nowhere near an expert on moment tensors and fault plane solutions, the majority of the time we see this "fried egg" pattern is either with an inflationary or deflationary event. Could this M5.3 have been caused by the collapse of the Hualalai magma chamber? Maybe. More research would have to be conducted. It did seem like aftershocks radiated away from the epicenter towards the north, right into the ocean. That could show either the magma seeped out from the chamber after it collapsed or, if this was not a collapse event, the spread of the seismic stress along local unknown faults. I choose the first option in my personal opinion. After all, this is a blog and it is always good to look at the data with no bias but to also theorize as to what is taking place. Also, just 50 minutes after this M5.3 struck Hawaii, a M4.0 earthquake struck Utah within the Black Rock Desert Volcanic Field. If you wish to visit that post now, please CLICK HERE. Also, just about 6 hours or so after the M5.3, a deep long period, high frequency tremor-like event struck on the opposite side of the Big Island, under the southern section near Pahala. Now I have talked about these DLP-HF events many times, as I like to call them, and you can find other previous posts about them here on my Hawaii blog post. Now, let's show some data real quick. Remember each slideshow below will show data from each of the 4 stations labeled on the map above. First off, here is a slideshow of 4 custom helicorders. You can see both the M5.3 earthquake and the DLP-HF event which struck about 6 hours later. By the way, the M5.3 was so strong that is caused station HUAD to glitch out terribly. Here is a look at the seismograms of the M5.3 in the seismic program WAVES. Note HUAD did glitch out pretty bad! 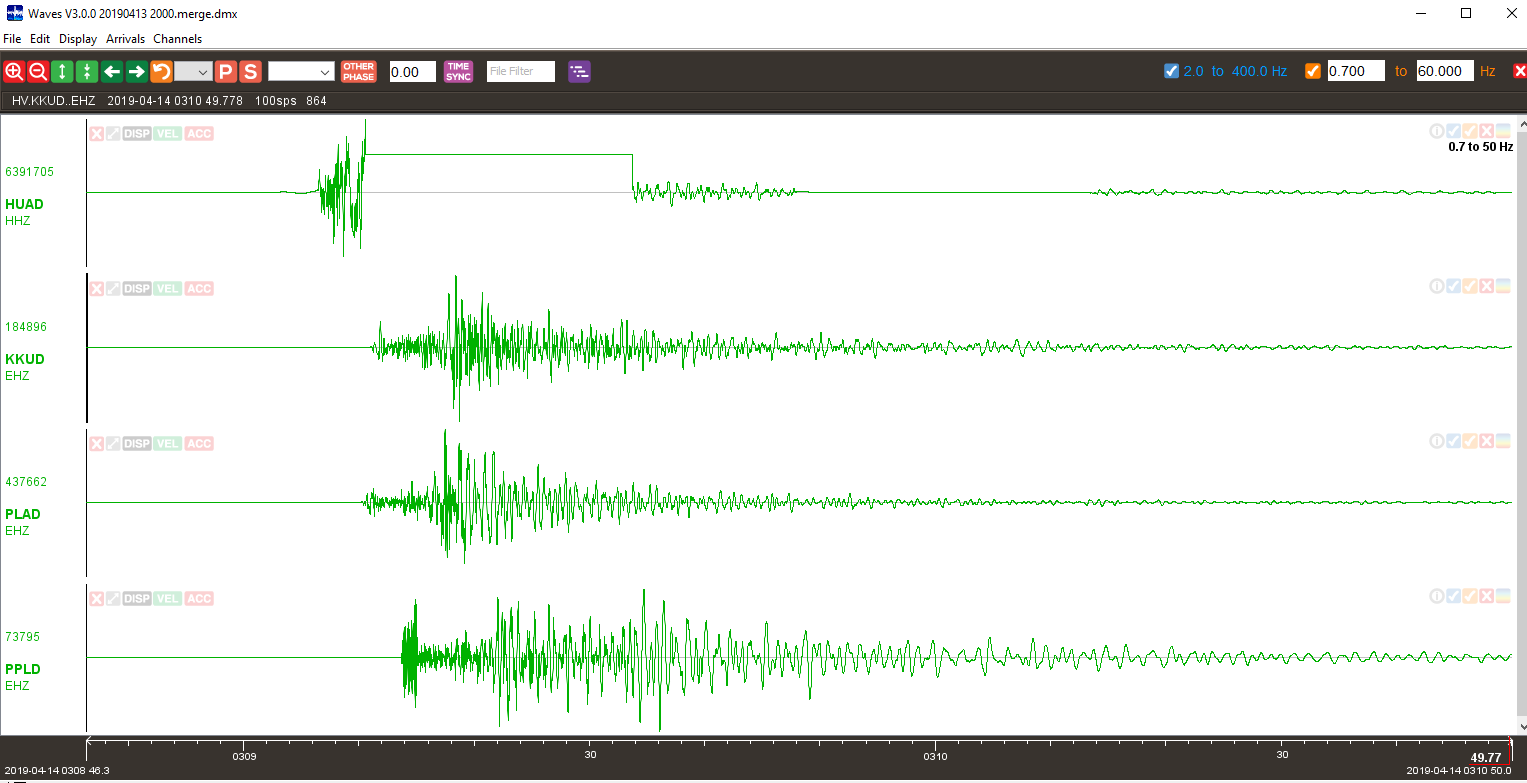 Here are the seismic 3-plot images I generated by using seismic data from the 4 stations labeled on the map above and the seismic program SWARM: And here is a zoomed-in look at the M5.3 earthquake: 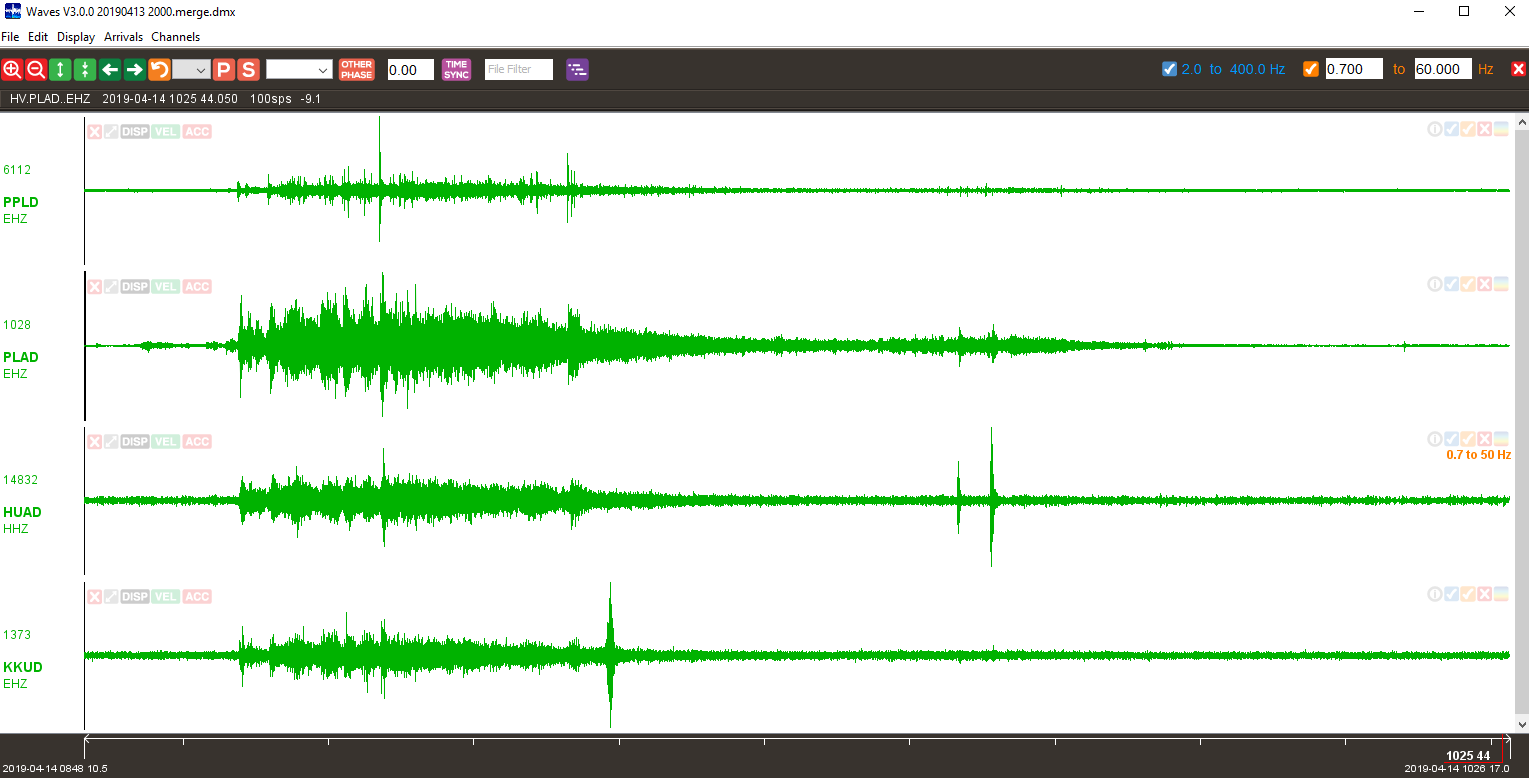 So, remember how I said seismicity was calm for a few days prior to the M5.3? Well the deep long period, high frequency events have not shown themselves for quite a while as well. However, just about 6 hours or so after the M5.3, a good sized DLP-HF event struck the usual location near Pahala, Hawaii. According to USGS, this event struck between 35.1km to 41.9km in depth. That is the usual depth for these strange long period events. The epicenter of this event is labeled on the map in the beginning of this post. However if you wish to see the 3 earthquakes reported for this one DLP-HF event, please CLICK HERE. That is the seismicity for Hawaii during this time period. Although USGS has labeled these events as "Other Event" in the past, for some reason they are labeling these as normal earthquakes. These are NOT normal earthquakes. Zoom in to Pahala and the 3 events reported for the area just south of Pahala are the 3 earthquakes they state occurred as part of this one DLP-HF event. The image directly above is of this DLP-HF event. This event started at about 8:56UTC on April 15, 2019 and lasted until about 10:04UTC. Out of all the DLP-HF events I have studied, this event is by far the longest! This event lasted approximately 1 hour and 8 minutes! That is extremely long for these types of events. It was not the largest I have seen, but it is by far the longest. What is causing these strange long period events? Typically long period tremor occurs within the low frequency band, for example harmonic and volcanic tremor episodes. However these DLP-HF events have dominant frequencies reaching all the way to 10Hz, with weaker frequencies going to about 22Hz. In all truthfulness, these are an enigmatic type of event. Below is a look at this DLP-HF event. If you wish to see it on the helicorder charts, simply look at the helicorder slideshow shown earlier in this post. You can't miss it. Check out the seismic audio of the M5.3 and deep long period, high frequency event: LINK: https://youtu.be/gf3CqBwk7_U
0 Comments
Leave a Reply. |
About
This blog is specifically for activity that occurs in Hawaii. In light of 2018's eruptions on the Big Island, I felt it necessary to have a section entirely devoted to events in Hawaii. I now mostly use this blog to update people on volcanic spasmodic tremor which occurs deep within the mantle plume conduit(s) under Pahala, HI. Don't know what spasmodic tremor is? Don't fret! Simply go to the Hawaii menu and click the page about Hawaii Spasmodic Tremor. Archives
February 2020
Categories |
 RSS Feed