Here are 3 more examples of what tectonic tremor looks like during ETS (episodic tremor and slip) sequences. Two examples are from Washington State and one example is from Vancouver Island. I will post the plots in slideshow format from two of the best stations I could find, therefore eliminating the possibility of errors in detection. This should help you somewhat in identifying tectonic tremor throughout your studies. Pay attention to strength and frequency range.
The maps shown below, showing tremor epicenters, was taken from the PNSN tremor map. It is an absolutely amazing tool so please CLICK HERE to visit that now if you wish.
The maps shown below, showing tremor epicenters, was taken from the PNSN tremor map. It is an absolutely amazing tool so please CLICK HERE to visit that now if you wish.
Washington State
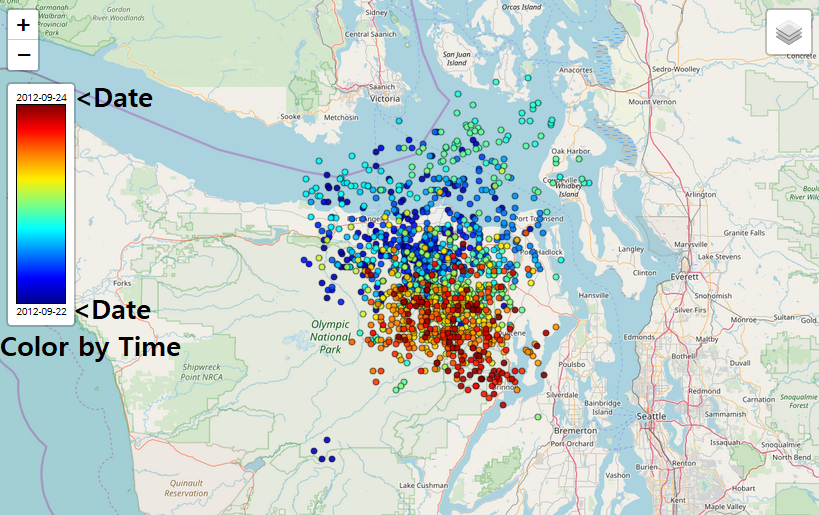
Below is tectonic tremor detected along the northeast edge of the Olympic Peninsula in Washington State. This tremor event occurred among many others on September 23, 2012. This ETS was much greater than what is shown on the map above. However the map above does show tremor epicenters one day before and one day after the time range of the plots below.
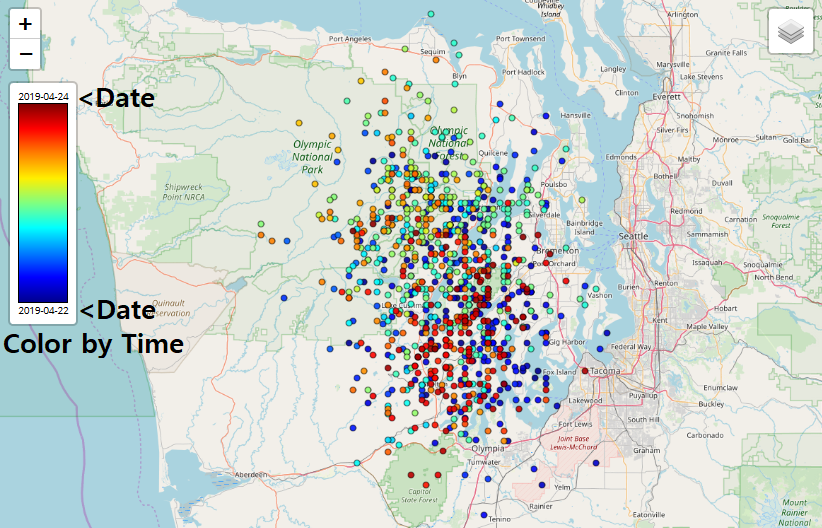
The tectonic tremor event shown below took part of an ETS that spanned along the entire eastern section of the Olympic Peninsula in Washington State in early-2019. The tremor map above shows tremor epicenters one day before and one day after the date listed on the plots below. Again, click the link given all the way at the beginning of this post to see tremor epicenters and time range of your preference. It is a fun tool to use!
Vancouver Island
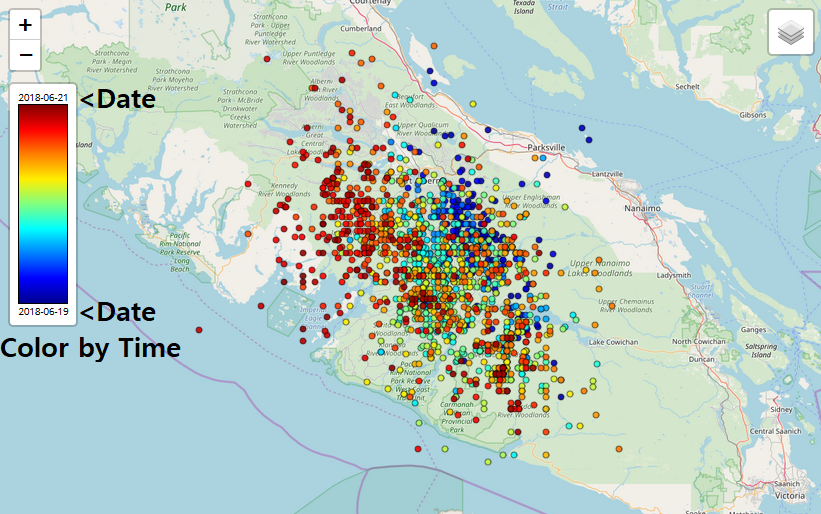
The tectonic tremor shown below is from an ETS event that struck Vancouver Island in 2012. The map above shows tremor epicenters one day before and one day after the date in the plots below.