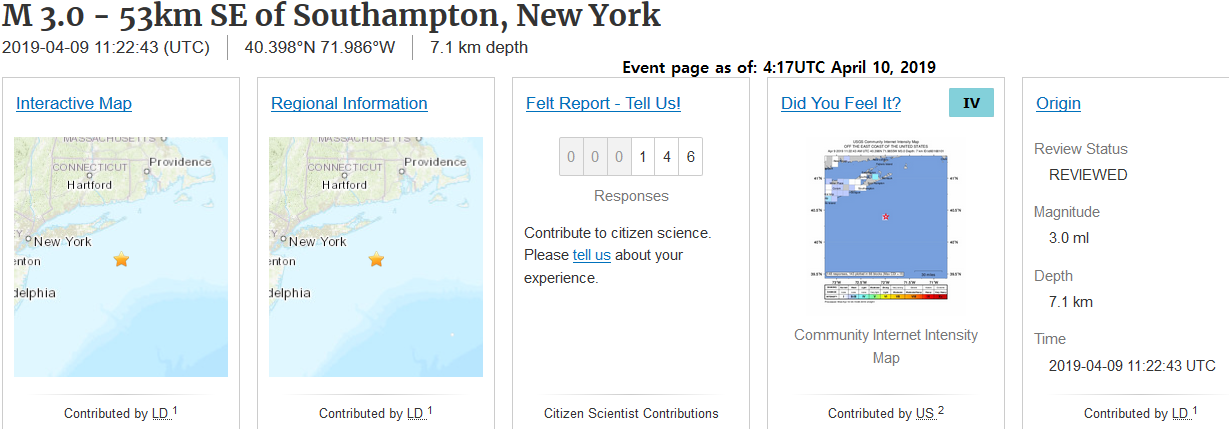
 Above is the event page for the M3.0 earthquake that struck at 7.1km in depth off the coast of New York. If you wish to see some plots, please click the title of this post or "read more" to continue. 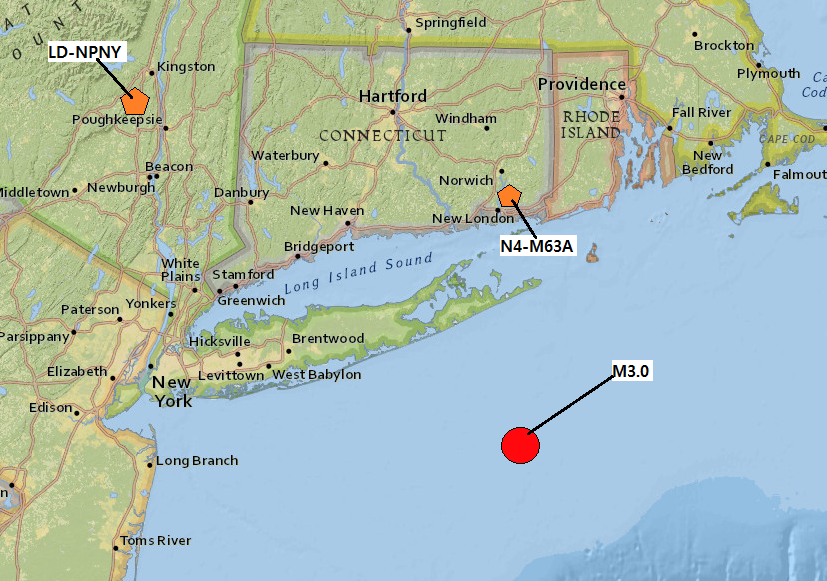 As you can see on the USGS event page first shown, this M3.0 at 7.1km in depth was exceptionally strong. At the time of saving the image, 146 people sent a report to USGS stating they felt this earthquake. That is a great many people to feel any magnitude 3.0 earthquake, especially one occurring this far away from population centers. The image directly above is the location of the earthquake in regards to 2 seismic stations I will use for the plots below. M63A in the N4 network is most likely the closest seismic station to this event. I also wanted to use a station that was more distant from the epicenter so I chose NPNY in the LD network. All plots were generated by me using the seismic program SWARM and data obtained from these stations through IRIS. Remember to always pay attention to chart labels!!! Plots from N4_M63A_00_HHZ: Plots from LD_NPNY_--_HHZ:
0 Comments
Leave a Reply. |
About
This is the seismic events page for the entire east coast of the United States. Any specific events I am interested in will be posted here if I have time, especially rare large events. Remember, this is mainly for fun than for work (unlike my seismo-blog and YouTube channel that I take more seriously). I will simply post the data and any relative information (i.e. reported depths/magnitudes) with as little chit-chat as possible for any events I personally find intriguing. Please use this, and other seismic events pages, as a sort of example. I know I already have an earthquake example page but this will show data only generated by me using SWARM and the IRIS seismic archive. Archives
April 2019
Categories |
 RSS Feed