The events contained within these statistics are the earthquakes REPORTED, not the ACTUAL number of earthquake events. As of the past few years, record keeping has gained momentum thanks to new technology and equipment updates. However, there are still earthquakes that are not reported by USGS even though the seismic trace of some events in question show on multiple seismic stations *shrug*. However this usually only occurs during earthquake swarms, especially at Yellowstone, and with magnitudes generally below M2.0. Every location in question will have at least 3 magnitudes showing all the earthquakes that occurred within that year at and above the magnitude in question. For example, all magnitudes, M1.5+, M2.5+, and M3.5+. But in regard to the Cascadia Subduction Zone, since it sees larger magnitudes than volcanoes, I will do all magnitudes, M2.5+, M4.0+, M5.0+, and M6.0+. I will also show the coordinate box I used and personal charts I created to give the reader a sense of how earthquake activity supposedly progressed for each magnitude throughout the years. I will also leave some GPS deformation charts if possible. As of right now, it seems earthquake counts for Long Valley caldera and the Cascadia Subduction Zone are more accurate than, for example, Newberry Caldera. Newberry didn’t have accurate seismic monitoring installed until 2011-2012. All earthquake statistics are taken directly from the earthquake catalog at earthquake.usgs.gov. Please let me know if there is anything I should change or if there are any mistakes! Of course these earthquake statistics will be updated once per year. I also encourage others to do the same that I have done!
One more thing. 0.0km in depth means sea level. So if you see an earthquake with a depth of -1.5km but the elevation of the surface is only 1.0km for example, then that means the earthquake occurred in the air. We know that is not possible so if that is true for any of the events, then that means the depth is likely to be very wrong. Another thing to add is the increase of seismic monitoring since 1998. Places like Long Valley caldera and the Cascadia Subduction Zone should not see too noticeable of an increase in reported seismicity that is related to increased monitoring, basically since these areas have been monitored closely for longer than 1998. But places like Yellowstone and Newberry caldera, the low-magnitude seismicity might increase slightly throughout time because of increased monitoring, especially in regards to Newberry. But in regards to Yellowstone, a great many small events are still not reported to this day (it being 2019 right now). This can especially be proven on my West Thumb, Yellowstone page under the Seismic Events dropdown menu above. Many, many small events are not reported even though monitoring is sufficient enough for in depth reporting. I don’t know why this is occurring, so Yellowstone might have a slightly higher seismicity count than the reported count. But most of the time quakes that occur above M1.5 or so are reported regardless.
Earthquake counts are shown first, charts visualizing progression of seismicity are shown second, and my take on the seismic progression is at the bottom. Any additional information will be provided right below. Also, my charts will contain a horizontal trendline (rising, dropping, or level). I know these are important, yes. However trendlines should not be the most important thing to look at. I have seen trendlines head downwards many times when recent activity has started to spike. They are important, but remember to always look at the data first. All dates are in UTC. UTC is ahead of Pacific Time, for example, by 7 hours. This means, for example, an earthquake occurring at 1:00UTC on April 22 would still be April 21 for us here in the USA.
Also, in regards to the largest event section, "LE" means largest event. If dealing with multiples of the same magnitudes, I will post in order from most recent. If you wish to know the locations of any of the GPS stations listed below, either CLICK HERE for the UNR map (where I got some of the deformation plots below) or CLICK HERE for the UNAVCO map. I highly suggest using the UNR map, seeing that you can see all-time plots.
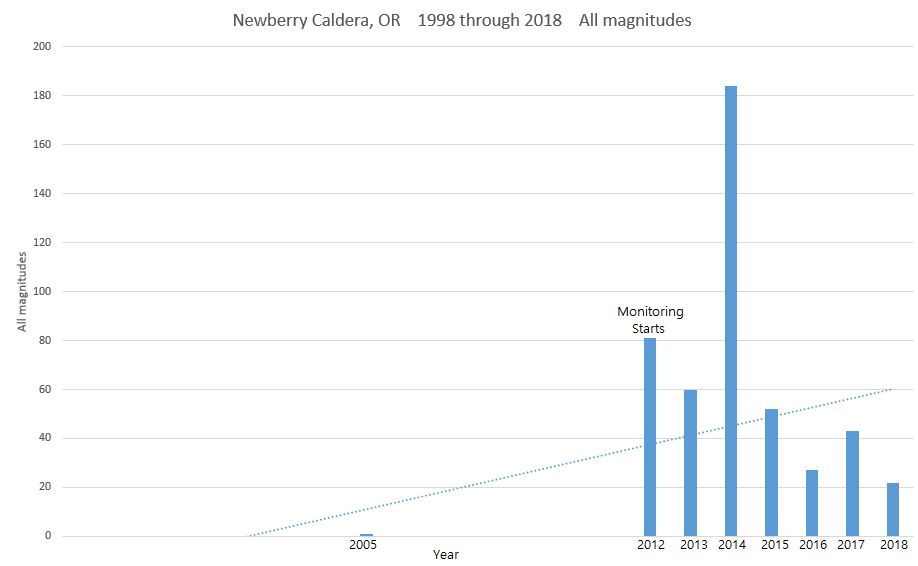
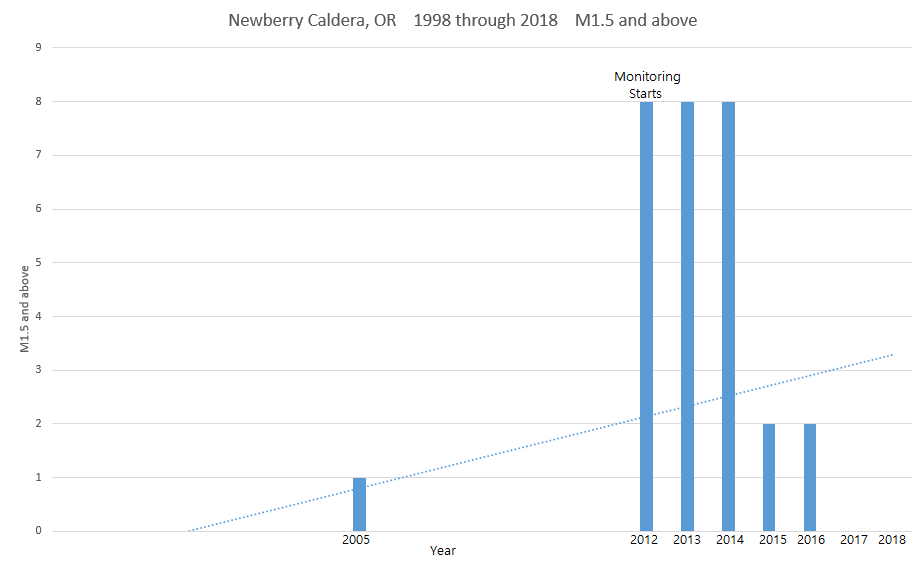
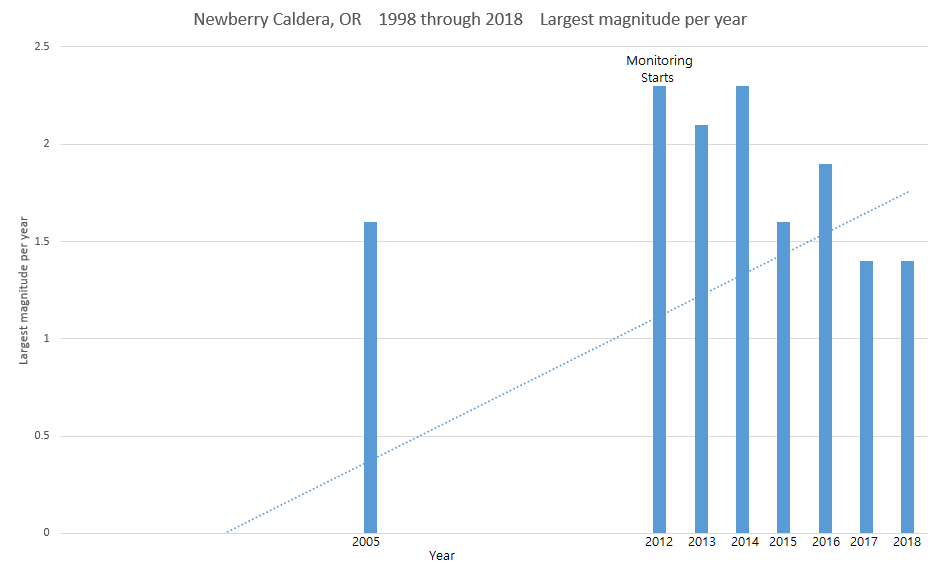
DISCLAIMER: You will notice barely any earthquakes are ever reported prior to 2011-2012. Sadly, Newberry had barely any monitoring instruments in the area prior to that time period. Nowadays it is monitored closely via seismic and GPS deformation instruments. Also, the reported events here are ONLY earthquakes. Any reported explosions, quarry blasts, or other human-caused events will not be counted. Some of these earthquakes were caused by drilling and geothermal testing operations to see if Newberry would qualify for a geothermal pumping operation. It did not and seismicity sharply increased and then decreased when they had to shut the operation down. According to Oregon Univserity, the hottest temperatures ever recorded at a Cascade volcano were recorded at Newberry no more than a decade ago. For more information from PNSN, please CLICK HERE. For more information from Oregon University, please CLICK HERE. Ever since geothermal testing was conducted, seismicity has mostly remained directly under the caldera with many of the reported events being low frequency earthquakes, rather than regular high-frequency tectonic earthquakes (though high frequency events still happen). This is likely due to a small increase in magmatic/hydrothermal activity possibly caused by natural causes or by human intervention via geothermal testing.
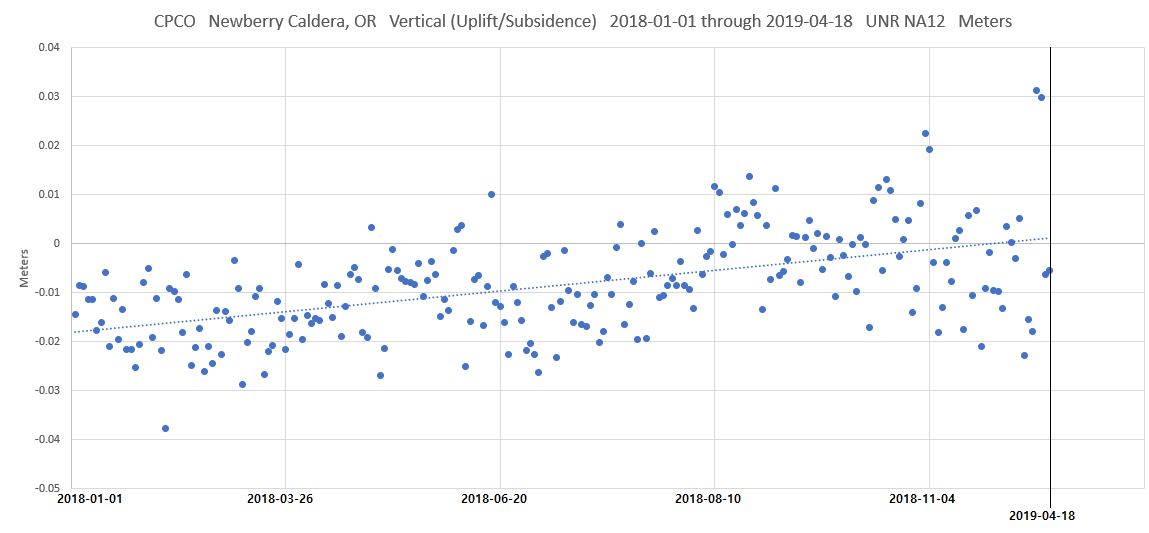
DISCLAIMER: Regarding the GPS deformation plot shown below, just know that samples were NOT taken everyday. Of course it will still show the deformation you need to see. However, you might think the labeled dates are wrong. They are not. These plots do not show gaps in the data and sometimes, in regards to CPCO at Newberry, there can be either 3 days of a gap or even 15 days of a gap. Regardless, again, you can still see the ongoing uplift/subsidence patterns, so it is not too much of a hindrance.
One more thing. 0.0km in depth means sea level. So if you see an earthquake with a depth of -1.5km but the elevation of the surface is only 1.0km for example, then that means the earthquake occurred in the air. We know that is not possible so if that is true for any of the events, then that means the depth is likely to be very wrong. Another thing to add is the increase of seismic monitoring since 1998. Places like Long Valley caldera and the Cascadia Subduction Zone should not see too noticeable of an increase in reported seismicity that is related to increased monitoring, basically since these areas have been monitored closely for longer than 1998. But places like Yellowstone and Newberry caldera, the low-magnitude seismicity might increase slightly throughout time because of increased monitoring, especially in regards to Newberry. But in regards to Yellowstone, a great many small events are still not reported to this day (it being 2019 right now). This can especially be proven on my West Thumb, Yellowstone page under the Seismic Events dropdown menu above. Many, many small events are not reported even though monitoring is sufficient enough for in depth reporting. I don’t know why this is occurring, so Yellowstone might have a slightly higher seismicity count than the reported count. But most of the time quakes that occur above M1.5 or so are reported regardless.
Earthquake counts are shown first, charts visualizing progression of seismicity are shown second, and my take on the seismic progression is at the bottom. Any additional information will be provided right below. Also, my charts will contain a horizontal trendline (rising, dropping, or level). I know these are important, yes. However trendlines should not be the most important thing to look at. I have seen trendlines head downwards many times when recent activity has started to spike. They are important, but remember to always look at the data first. All dates are in UTC. UTC is ahead of Pacific Time, for example, by 7 hours. This means, for example, an earthquake occurring at 1:00UTC on April 22 would still be April 21 for us here in the USA.
Also, in regards to the largest event section, "LE" means largest event. If dealing with multiples of the same magnitudes, I will post in order from most recent. If you wish to know the locations of any of the GPS stations listed below, either CLICK HERE for the UNR map (where I got some of the deformation plots below) or CLICK HERE for the UNAVCO map. I highly suggest using the UNR map, seeing that you can see all-time plots.
DISCLAIMER: You will notice barely any earthquakes are ever reported prior to 2011-2012. Sadly, Newberry had barely any monitoring instruments in the area prior to that time period. Nowadays it is monitored closely via seismic and GPS deformation instruments. Also, the reported events here are ONLY earthquakes. Any reported explosions, quarry blasts, or other human-caused events will not be counted. Some of these earthquakes were caused by drilling and geothermal testing operations to see if Newberry would qualify for a geothermal pumping operation. It did not and seismicity sharply increased and then decreased when they had to shut the operation down. According to Oregon Univserity, the hottest temperatures ever recorded at a Cascade volcano were recorded at Newberry no more than a decade ago. For more information from PNSN, please CLICK HERE. For more information from Oregon University, please CLICK HERE. Ever since geothermal testing was conducted, seismicity has mostly remained directly under the caldera with many of the reported events being low frequency earthquakes, rather than regular high-frequency tectonic earthquakes (though high frequency events still happen). This is likely due to a small increase in magmatic/hydrothermal activity possibly caused by natural causes or by human intervention via geothermal testing.
DISCLAIMER: Regarding the GPS deformation plot shown below, just know that samples were NOT taken everyday. Of course it will still show the deformation you need to see. However, you might think the labeled dates are wrong. They are not. These plots do not show gaps in the data and sometimes, in regards to CPCO at Newberry, there can be either 3 days of a gap or even 15 days of a gap. Regardless, again, you can still see the ongoing uplift/subsidence patterns, so it is not too much of a hindrance.
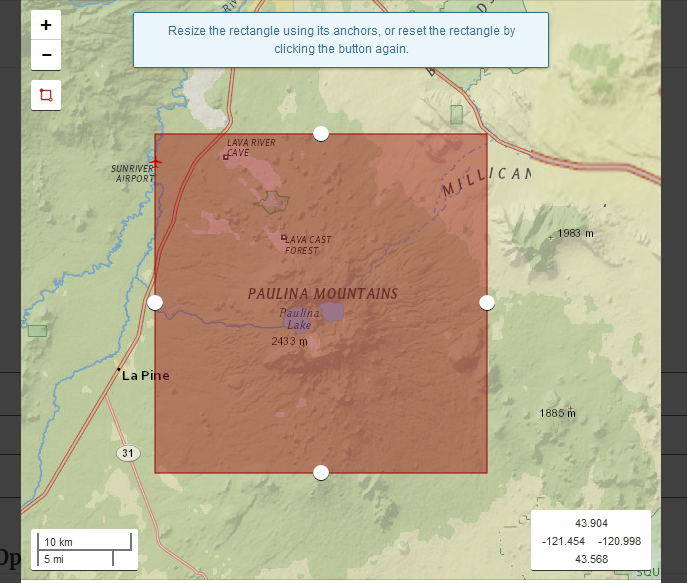
Coordinate box for Newberry caldera
Newberry Caldera seismicity:
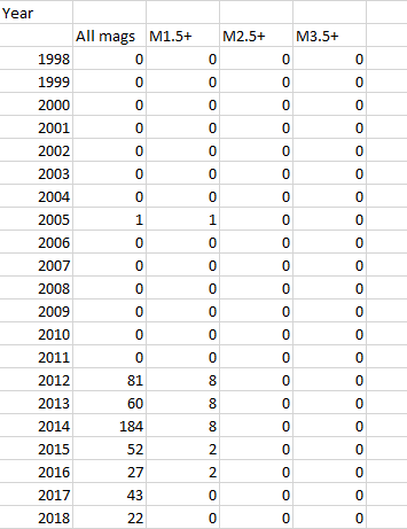
Largest magnitudes per year:
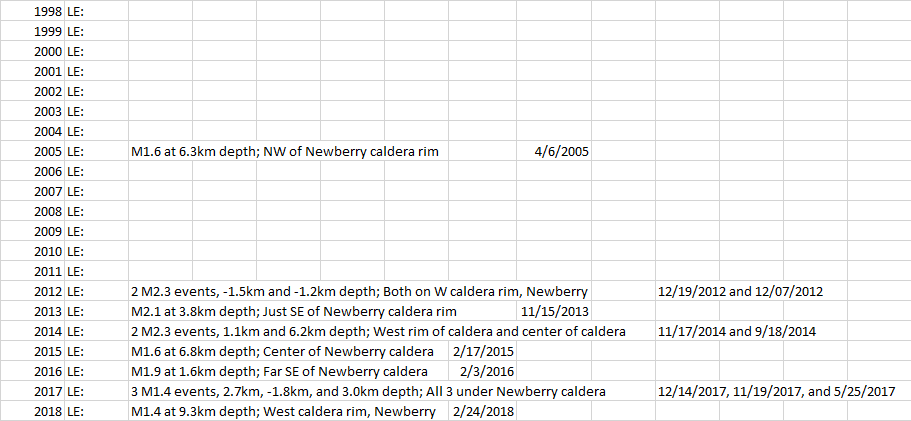
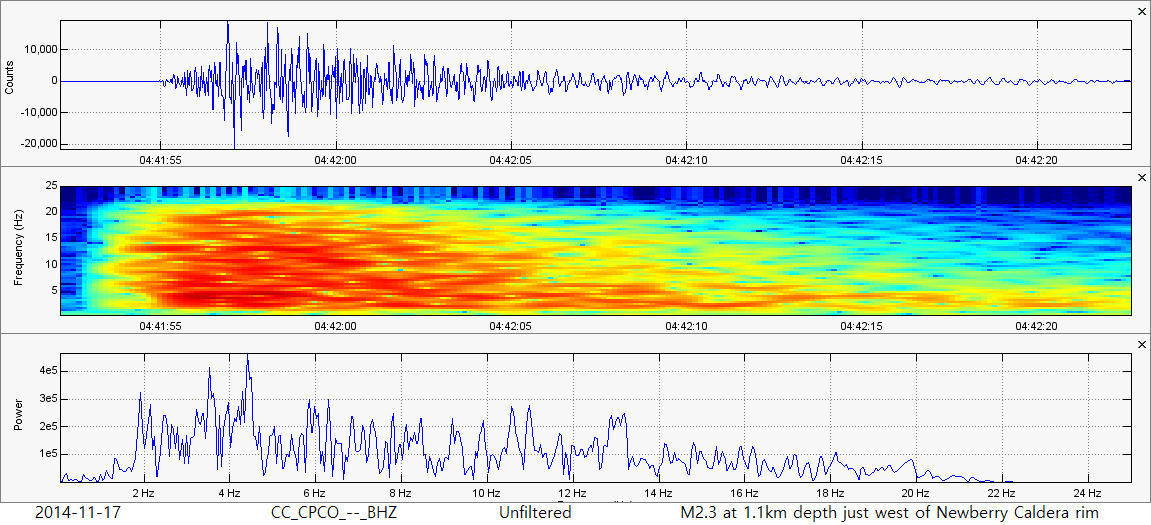
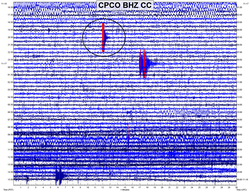
Largest earthquake to occur from 1998 through 2018 were multiple M2.3 events in 2012 and 2014. Please refer to the spreadsheet above. For the plots directly below, I used the most recent largest event at Newberry (the M2.3 on 11/17/2014).
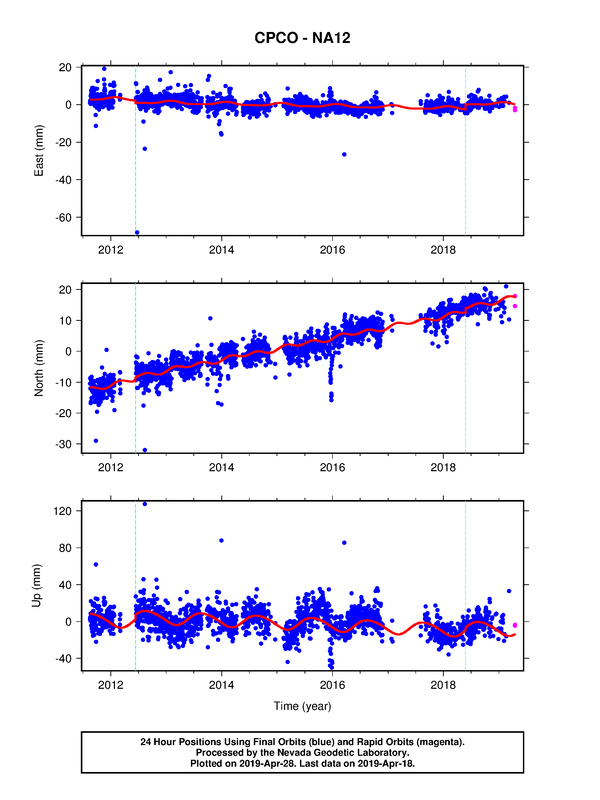
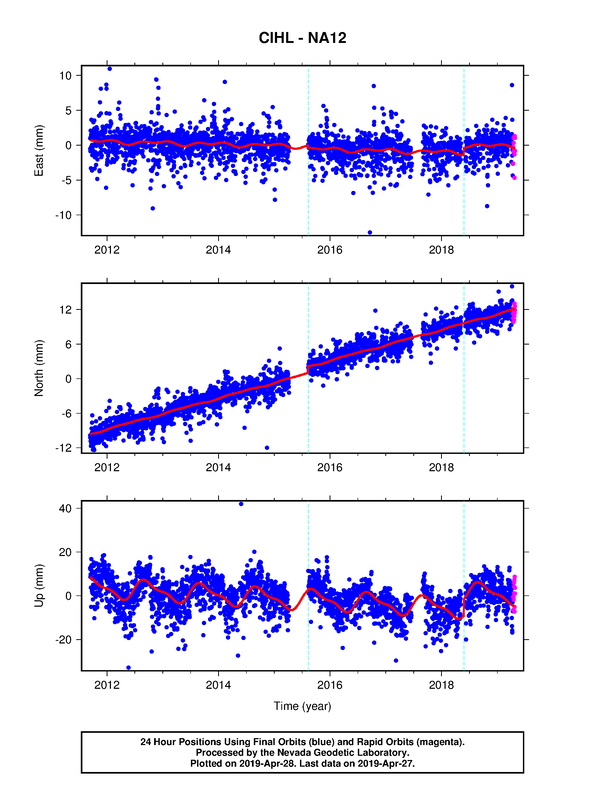
GPS deformation charts from 2 stations at Newberry. If you wish to see the locations, click the link I left above that takes you to the UNR map. These plots were generated by UNR:
|
|
My own custom GPS vertical (uplift/subsidence) deformation plot showing data from station CPCO, which resides in the center of the caldera. Data was obtained from UNR (link above). Also, there are many instances where it had been days or longer where samples were not taken. Gaps in the data are not shown. Dates have been checked:
Charts detailing data from the spreadsheets above:
My opinions/educated guesses:
It is sad monitoring did not begin at Newberry until 2011-2012. Only one earthquake was ever recorded at Newberry prior to monitor installation (was likely detected by distant stations). Although we do not have a good idea of historical seismicity for this volcano, it carries the hottest temperatures ever recorded at a Cascade Range volcano. That shows Newberry is still very active. Geothermal pumping created many of the earthquakes, yes. However I believe many were also caused by the volcano's magma chamber and hydrothermal system "reacting" to the geothermal pumping. It is no surprise they stopped their study and geothermal pumping is no longer being conducted at Newberry.
Now, the trendlines on the charts can be very deceiving and are useless for Newberry's seismicity only. That is because we only have a small data range to go on. However once geothermal pumping ceased, seismicity has gotten lower and lower each year. Well, somewhat. Something interesting to add is that much of the reported seismicity for 2017-present consisted of low frequency earthquakes, rather than all of them being of the high frequency variety. This might have to do with the magmatic/hydrothermal system still reacting from the geothermal pumping operation that was conducted at this volcano for a few years. Seismicity remains low and so does deformation.
Speaking of deformation, the two plots from UNR show there is a very slow amount of overall subsidence occurring since 2011-2012. Yearly periods of slight uplift are thought to be caused by seasonal changes due to fluctuations in groundwater, especially since this fluctuation is detected even in non-volcanic areas. Take a look at my custom GPS chart. It is showing a slight trend in uplift. I cannot say whether the slight uplift was being caused by these seasonal changes or by an influx of magma from below. You be the judge!