The events contained within these statistics are the earthquakes REPORTED, not the ACTUAL number of earthquake events. As of the past few years, record keeping has gained momentum thanks to new technology and equipment updates. However, there are still earthquakes that are not reported by USGS even though the seismic trace of some events in question show on multiple seismic stations *shrug*. However this usually only occurs during earthquake swarms, especially at Yellowstone, and with magnitudes generally below M2.0. Every location in question will have at least 3 magnitudes showing all the earthquakes that occurred within that year at and above the magnitude in question. For example, all magnitudes, M1.5+, M2.5+, and M3.5+. But in regard to the Cascadia Subduction Zone, since it sees larger magnitudes than volcanoes, I will do all magnitudes, M2.5+, M4.0+, M5.0+, and M6.0+. I will also show the coordinate box I used and personal charts I created to give the reader a sense of how earthquake activity supposedly progressed for each magnitude throughout the years. I will also leave some GPS deformation charts if possible. As of right now, it seems earthquake counts for Long Valley caldera and the Cascadia Subduction Zone are more accurate than, for example, Newberry Caldera. Newberry didn’t have accurate seismic monitoring installed until 2011-2012. All earthquake statistics are taken directly from the earthquake catalog at earthquake.usgs.gov. Please let me know if there is anything I should change or if there are any mistakes! Of course these earthquake statistics will be updated once per year. I also encourage others to do the same that I have done!
One more thing. 0.0km in depth means sea level. So if you see an earthquake with a depth of -1.5km but the elevation of the surface is only 1.0km for example, then that means the earthquake occurred in the air. We know that is not possible so if that is true for any of the events, then that means the depth is likely to be very wrong. Another thing to add is the increase of seismic monitoring since 1998. Places like Long Valley caldera and the Cascadia Subduction Zone should not see too noticeable of an increase in reported seismicity that is related to increased monitoring, basically since these areas have been monitored closely for longer than 1998. But places like Yellowstone and Newberry caldera, the low-magnitude seismicity might increase slightly throughout time because of increased monitoring, especially in regards to Newberry. But in regards to Yellowstone, a great many small events are still not reported to this day (it being 2019 right now). This can especially be proven on my West Thumb, Yellowstone page under the Seismic Events dropdown menu above. Many, many small events are not reported even though monitoring is sufficient enough for in depth reporting. I don’t know why this is occurring, so Yellowstone might have a slightly higher seismicity count than the reported count. But most of the time quakes that occur above M1.5 or so are reported regardless.
Earthquake counts are shown first, charts visualizing progression of seismicity are shown second, and my take on the seismic progression is at the bottom. Any additional information will be provided right below. Also, my charts will contain a horizontal trendline (rising, dropping, or level). I know these are important, yes. However trendlines should not be the most important thing to look at. I have seen trendlines head downwards many times when recent activity has started to spike. They are important, but remember to always look at the data first. All dates are in UTC. UTC is ahead of Pacific Time, for example, by 7 hours. This means, for example, an earthquake occurring at 1:00UTC on April 22 would still be April 21 for us here in the USA.
Also, in regards to the largest event section, "LE" means largest event. If dealing with multiples of the same magnitudes, I will post in order from most recent. If you wish to know the locations of any of the GPS stations listed below, either CLICK HERE for the UNR map (where I got some of the deformation plots below) or CLICK HERE for the UNAVCO map. I highly suggest using the UNR map, seeing that you can see all-time plots.
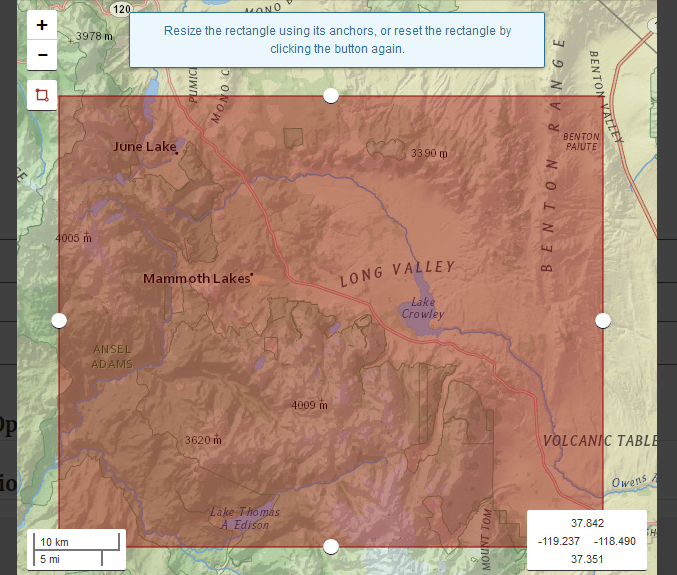
Coordinate box for Long Valley super-volcano
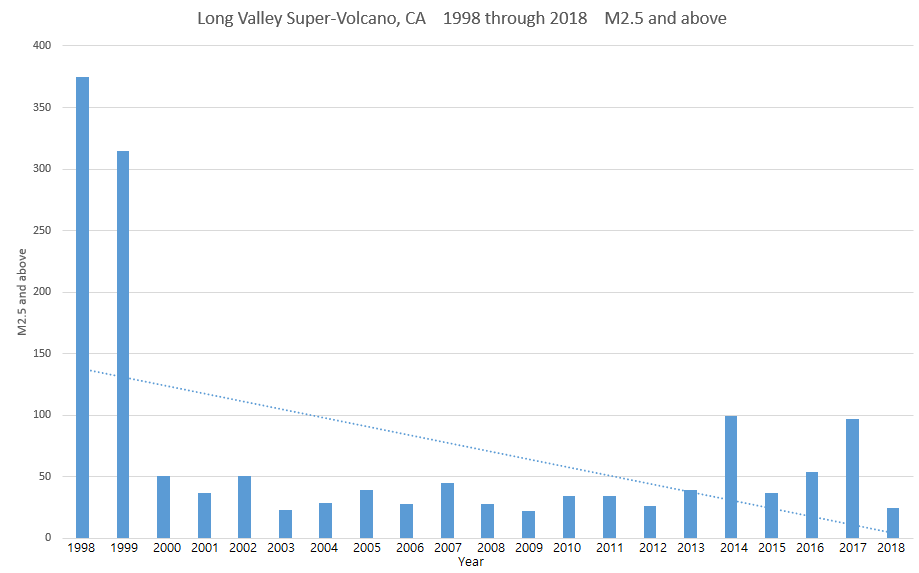
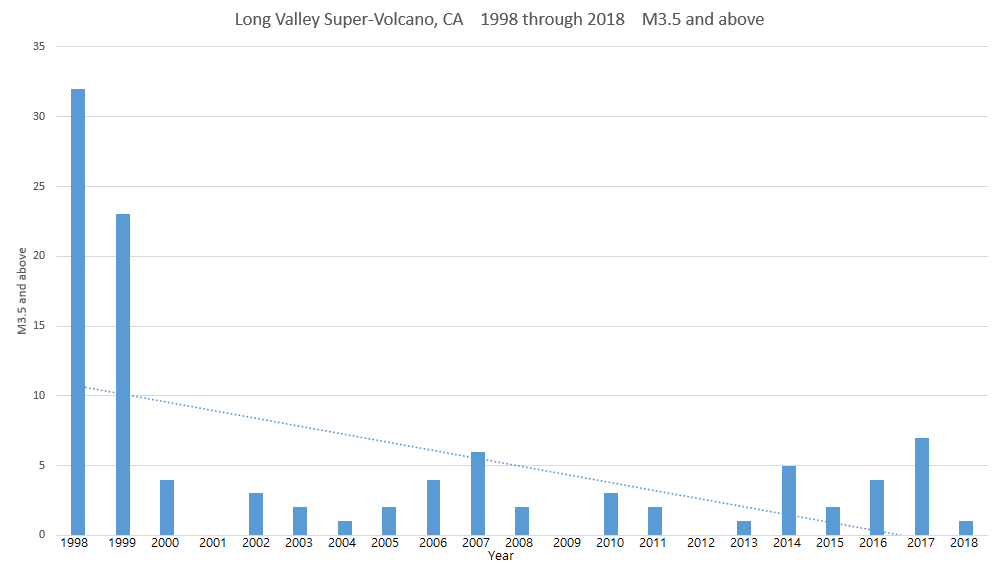
Long Valley seismicity counts:
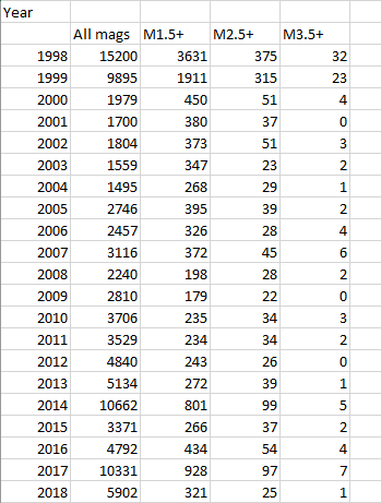
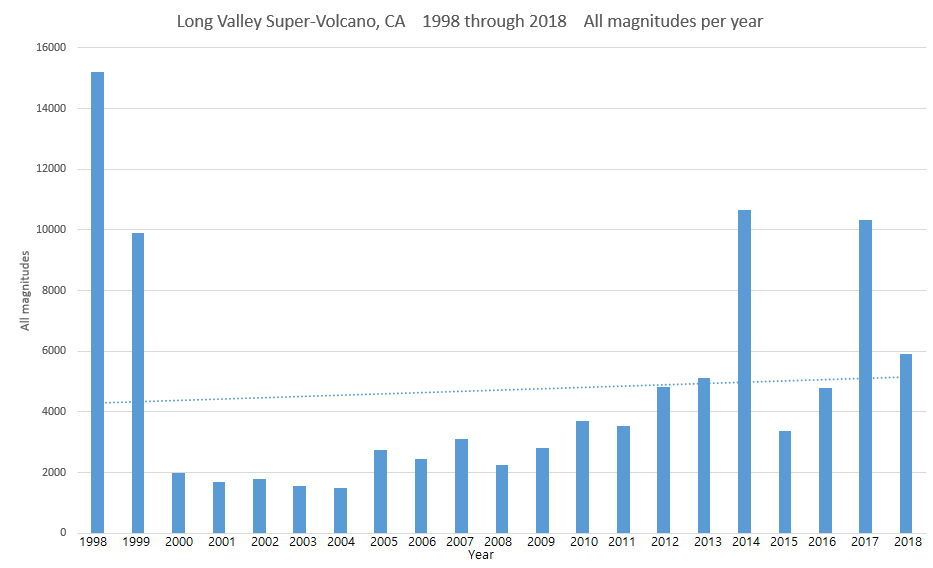
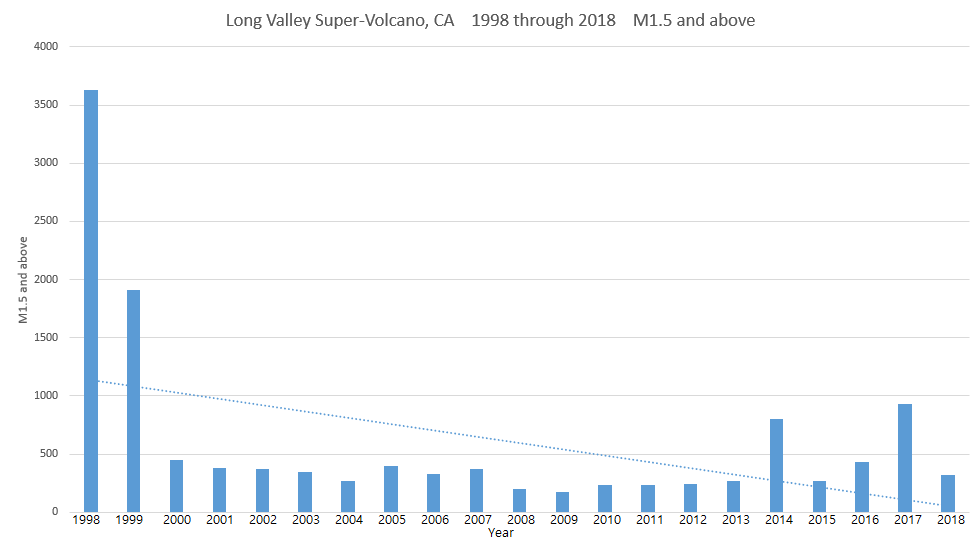
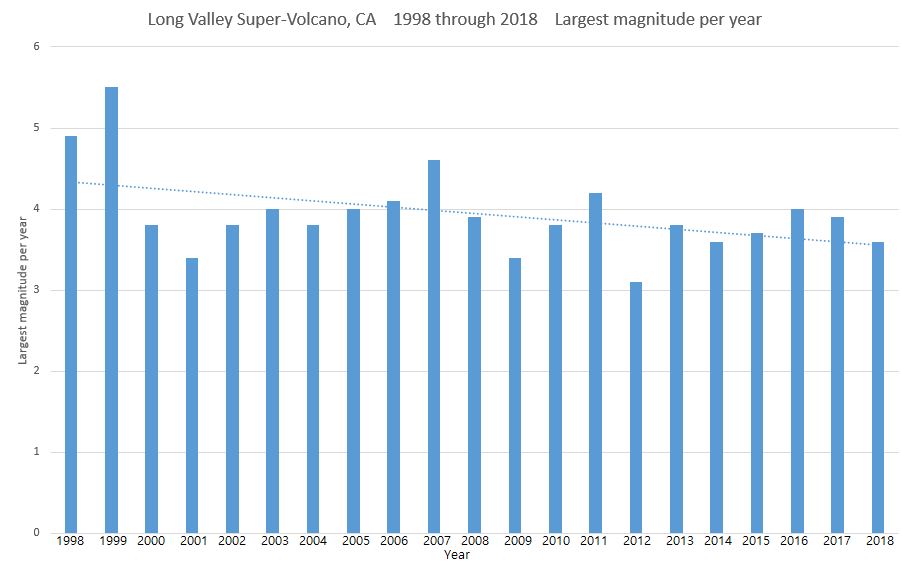
Largest magnitudes per year:
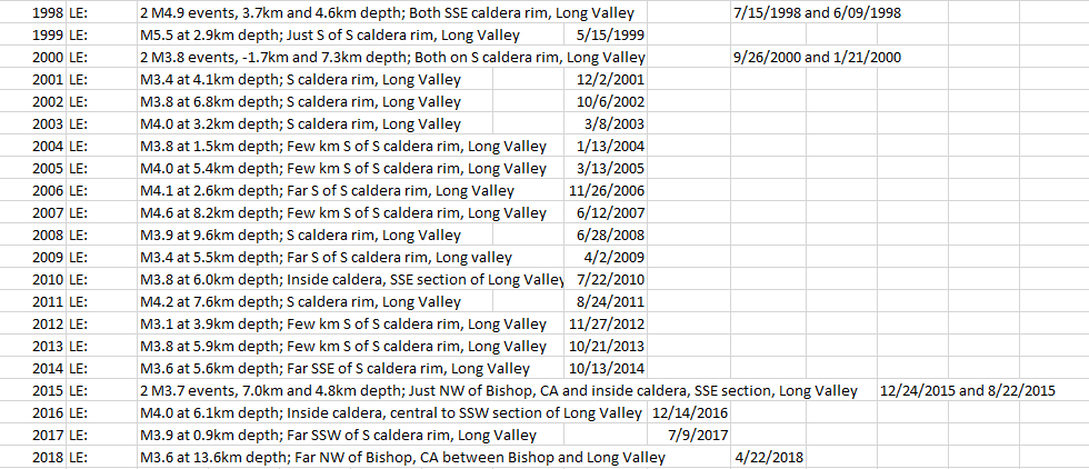
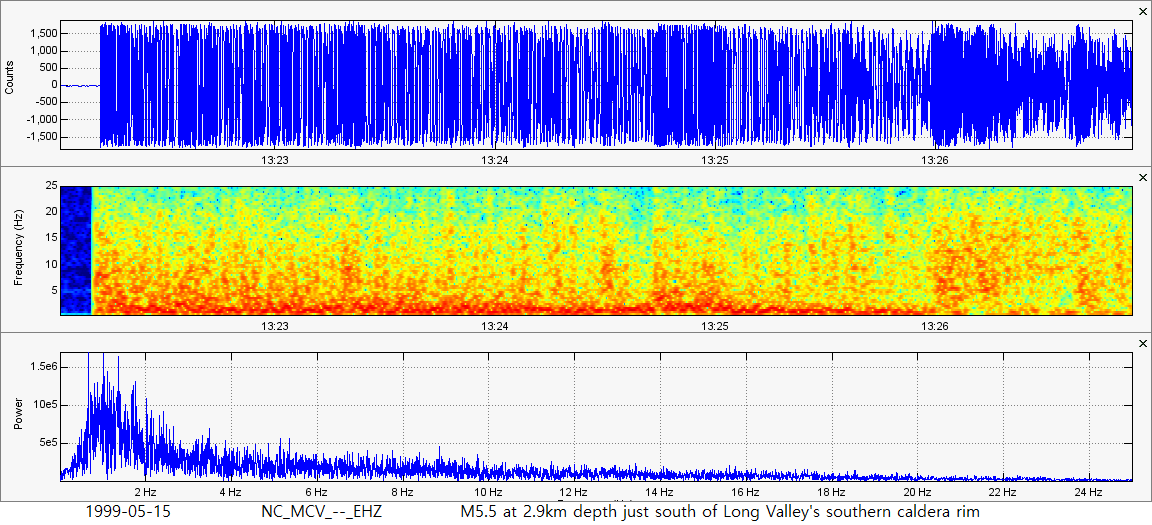
Largest event to occur from 1998 through 2018 was a M5.5 at 2.9km depth; Just S of S caldera rim, Long Valley on 5/15/1999. Plots shown directly below. Keep in mind this quake occurred in 1999 and the station was likely an analog station. This means the seismic traces might look weird:
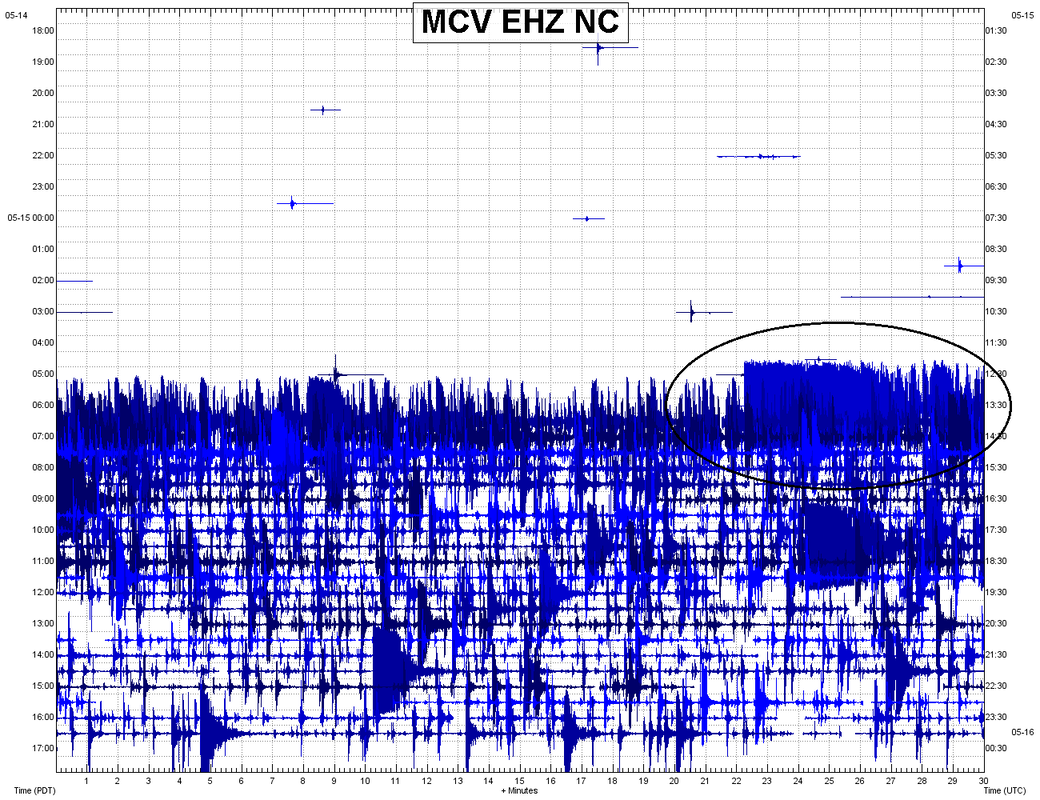
Yes, those are all earthquakes.
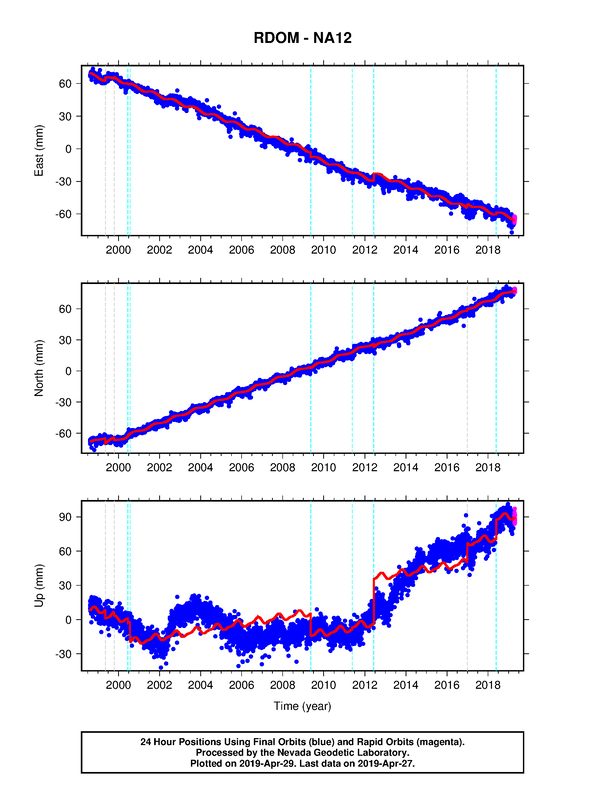
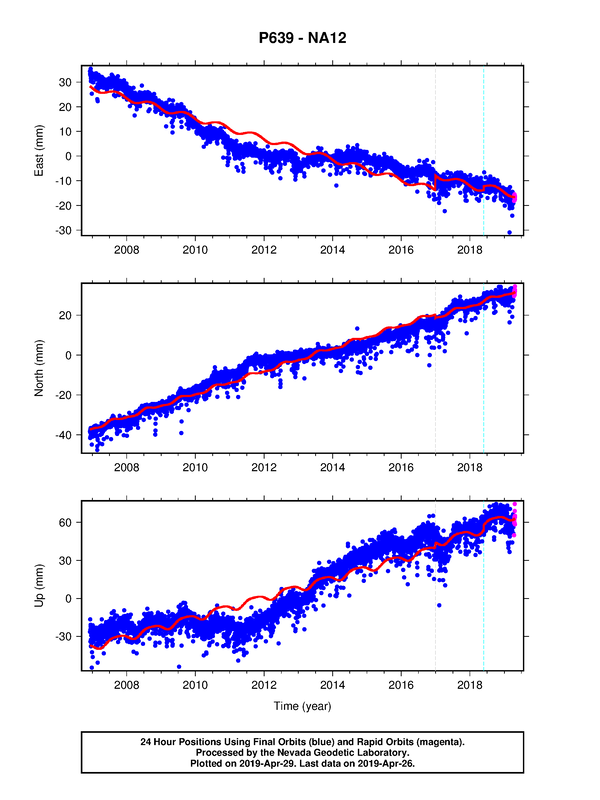
The following are GPS deformation plots generated by UNR. Station RDOM resides on top of Long Valley's resurgent dome. Remember, you can find the link to UNR above.
|
|
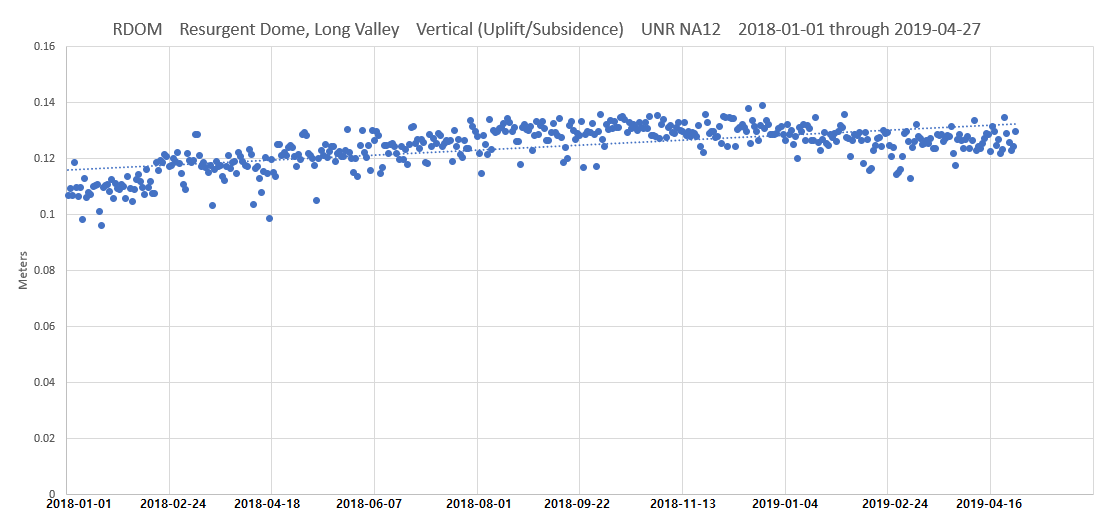
The following is my own custom GPS plot showing vertical (uplift/subsidence) deformation from January 1, 2018 through April 27, 2019 (raw data obtained from UNR):
Charts detailing data from the spreadsheets above:
My opinions/educated guesses:
Long Valley Caldera, which resides in eastern California on the slopes of the Sierra Nevada Range, is an enormous super-volcano. Scientists recently discovered around 240 cubic miles of magma rests just a few miles beneath the surface of this sleeping beast (CLICK HERE). Prior to 1978, Long Valley was extremely calm. However, around 1980, things began to change. Large swelling of the caldera began in conjunction with huge seismicity and moderate to severe volcanic degassing. According to USGS, Long Valley is a site of ongoing, non-eruptive volcanic activity (CLICK HERE). From 1978 to 2014, the ground has swelled more than 2.5 feet (CLICK HERE)! That is an impressive amount of uplift for any caldera within that time frame.
Although Yellowstone Caldera in Wyoming garners more star attention, it is no doubt that Long Valley is much more of an immediate threat at this moment. Large amounts of land saw thousands of trees die from volcanic gas. And, in the late-90's, Long Valley was averaging more than 10,000 quakes per year! Long Valley, again, currently houses enough magma to kick-start a supereruption. There is no sign of that right now, but scientists were starting to lose sleep due to the sheer amount of activity in the late-90's.
You can see this on the yearly charts above. Note the extreme amount of earthquakes in 1998 and 1999. What is not shown is the time period prior to this. Activity was quite severe and even had moments where multiple M6 quakes struck in one day! Thank God that it calmed down! However, take a look at the past 5 years. It does seem seismicity is increasing once again and uplift still occurs at Long Valley, though not at the rate seen in the late-90's. This doesn't mean Long Valley is approaching a super-eruption right now, but there is too much magma down there to stay quiet for too long. In my opinion, Long Valley is the most dangerous volcano, or super-volcano for that matter, in the entire United States. Long Valley has been accurately and intensely monitored since 1980.
Now on to the GPS charts. Take a look at the ones provided by UNR. You can tell there has still been significant uplift since the year 2000, though not as bad as the unrest in the 90's. The trend of continued uplift likely will continue until a super-eruption occurs. After all, 240 cubic miles of magma is an insane amount of magma. Some volcanoes can subside when magma retreats from the system. But in regards to Long Valley, where could all of that magma go?
Now take a look at my custom GPS chart showing uplift/subsidence for the Long Valley resurgent dome since January 1, 2018. You can tell uplift was ongoing but sort of stalled half way through. Subsidence began just slightly, however subsidence trends at Long Valley are usually short-lived. It is likely uplift is starting again at Long Valley. Keep an eye out for increased uplift, degassing, and seismicity. I would be very concerned if Long Valley saw another period of unrest much like the one seen in the 90's.
Overall, there is no reason to lose sleep. After all, there are many things that can kill us before Long Valley erupts. Hope for the best, but prepare for the worst. Join me in monitoring this area via seismic and GPS deformation data!